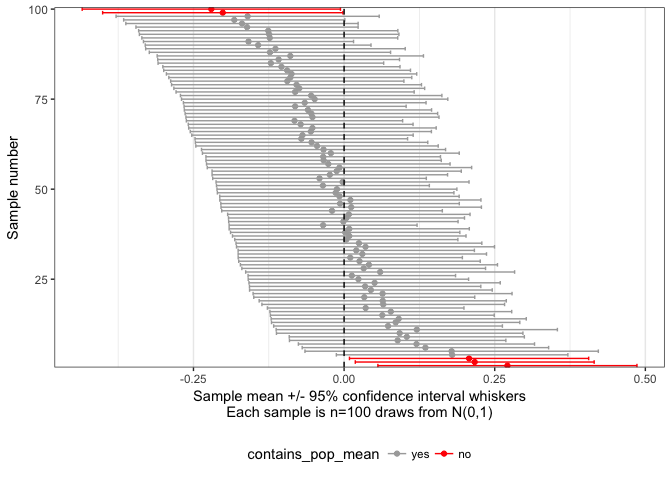
This is a very brief demonstration on how to visualise confidence intervals
First we clear the workspace, load required packages and set a seed for reproducibility when working with random number generation
rm(list=ls())
library('tidyverse')
set.seed(196628)Then we create a function for repeatedly drawing random normal distributed numbers and calculating sample mean and confidence intervals
mk_samples = function(n, size, mean = 0, sd = 1){
  m = sapply(1:n, function(i){
    s = rnorm(n = size, mean = mean, sd = sd)
    return( c(mean(s), t.test(s)$conf.int) )
  })
  rownames(m) = c("sample_mean", "ci_lower", "ci_upper")
  m = m %>% t %>% as_tibble
  return(m)
}Now we run the mk_samples() function
n = 100
m = mk_samples(n = n, size = 100) %>%
  arrange(desc(ci_lower)) %>%
  mutate(i = seq(1,n)) %>%
  mutate(contains_pop_mean = ifelse(0 > ci_lower & 0 < ci_upper,'yes','no') %>%
           factor(levels = c('yes', 'no')))
m
## # A tibble: 100 x 5
## sample_mean ci_lower ci_upper i contains_pop_mean
## <dbl> <dbl> <dbl> <int> <fctr>
## 1 0.27107828 0.056091337 0.4860652 1 no
## 2 0.21680406 0.018569854 0.4150383 2 no
## 3 0.20741777 0.008901981 0.4059336 3 no
## 4 0.17929221 -0.012861105 0.3714455 4 yes
## 5 0.17851806 -0.064949428 0.4219856 5 yes
## 6 0.13496431 -0.069553520 0.3394821 6 yes
## 7 0.12009085 -0.075892146 0.3160738 7 yes
## 8 0.08889772 -0.090681676 0.2684771 8 yes
## 9 0.10405637 -0.091063876 0.2991766 9 yes
## 10 0.09227670 -0.112272478 0.2968259 10 yes
## # ... with 90 more rows
Finally, we can visualise the calculated confidence intervals and see the definition of a confidence interval: If samples are repeatedly drawn from a population, then the 95% confidence interval of 95 in 100 samples contain the population mean:
m %>%
  ggplot(aes(x=sample_mean,y=i,colour=contains_pop_mean)) +
  geom_point() +
  geom_errorbarh(aes(xmin=ci_lower,xmax=ci_upper),height=1) +
  geom_vline(xintercept = 0, linetype = 'dashed') +
  scale_y_continuous(expand = c(0, 0)) +
  scale_color_manual(values=c('darkgrey','red')) +
  xlab(paste0('Sample mean +/- 95% confidence interval whiskers\n',
              'Each sample is n=100 draws from N(0,1)')) +
  ylab("Sample number") +
  theme_bw() +
  theme(panel.grid.major.y = element_blank(),
        panel.grid.minor.y = element_blank(),
        legend.position='bottom')