A complete set of tools to code games with Godot Engine in Visual Studio Code.
IMPORTANT NOTE: Versions 1.0.0 and later of this plugin only support Godot 3.2 or later.
The extension comes with a wealth of features to make your Godot programming experience as comfortable as possible:
- Syntax highlighting for the GDScript (
.gd) language - Syntax highlighting for the
.tscnand.tresscene formats - Full typed GDScript support
- Optional "Smart Mode" to improve productivity with dynamically typed scripts
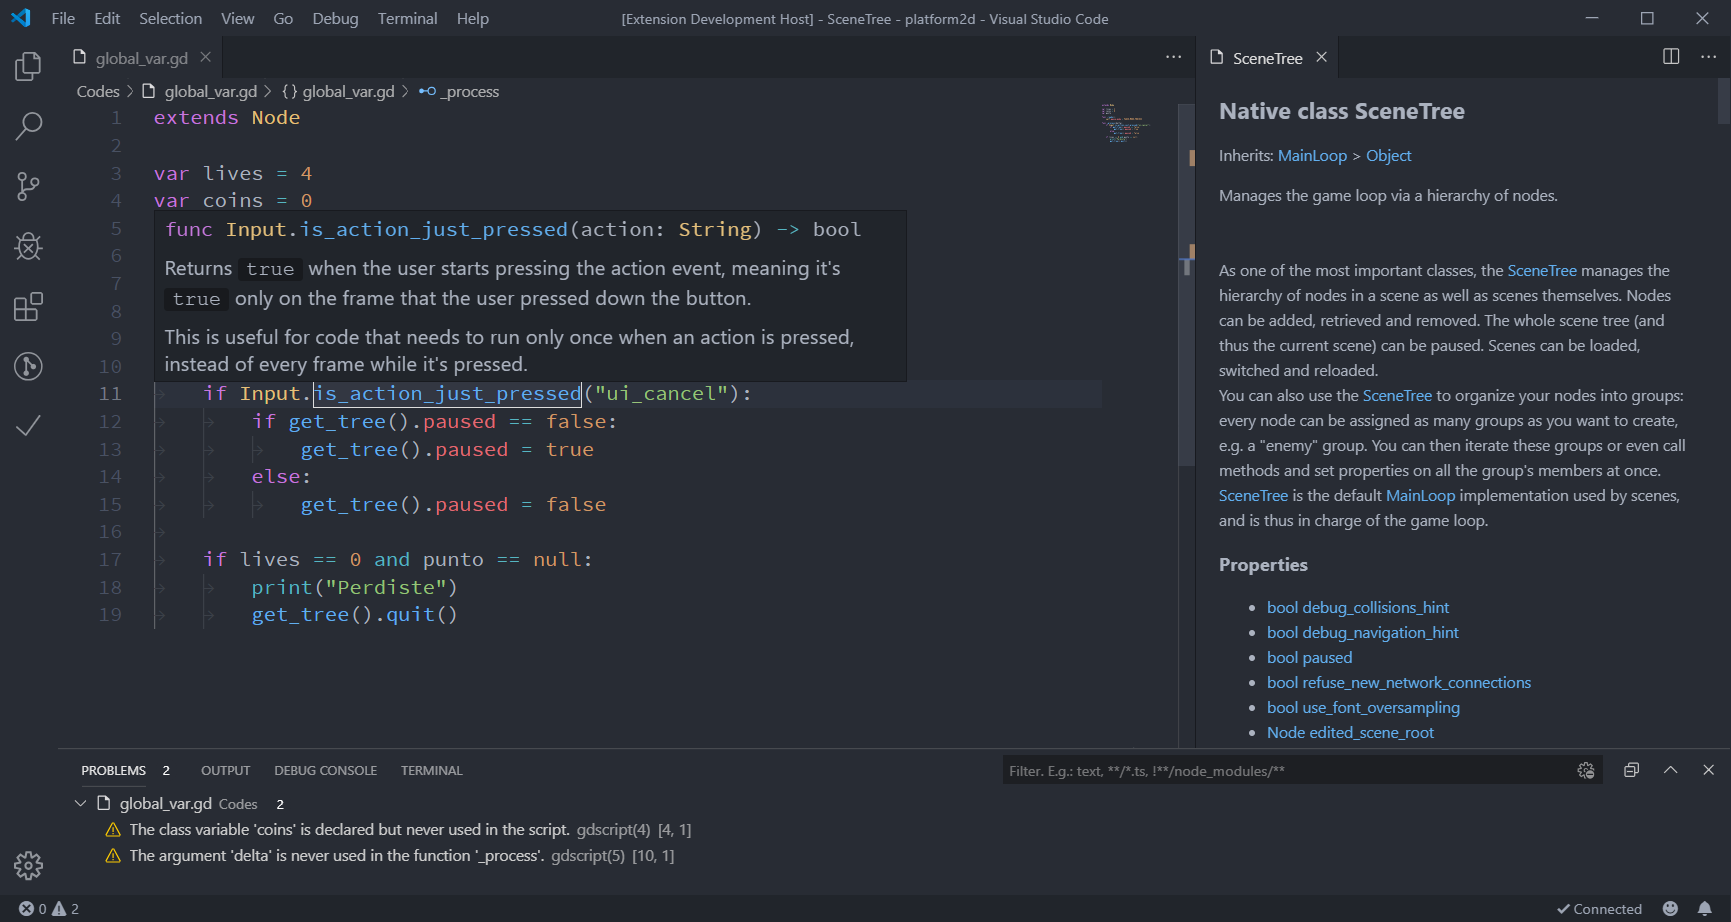
- Function definitions and documentation display on hover (see image below)
- Rich autocompletion
- Display script warnings and errors
- Ctrl + click on a variable or method call to jump to its definition
- Full documentation of the Godot Engine's API supported (select Godot Tools: List native classes of Godot in the Command Palette)
- Run a Godot project from VS Code
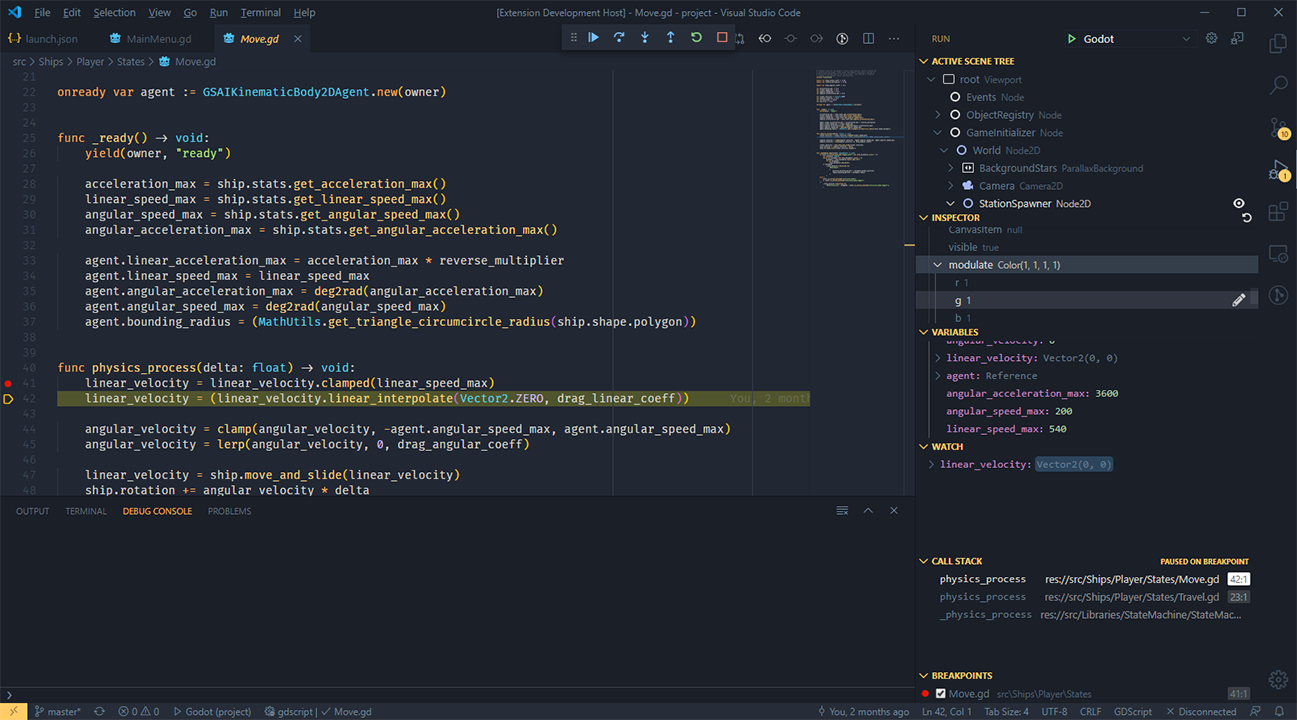
- Debug your GDScript-based Godot project from VS Code with breakpoints, step-in/out/over, variable watch, call stack, and active scene tree
The extension adds a few entries to the VS Code Command Palette under "Godot Tools":
- Open workspace with Godot editor
- Run the workspace as a Godot project
- List Godot's native classes
If you like this extension, you can set VS Code as your default script editor for Godot by following these steps:
- Open the Editor Settings
- Select Text Editor > External
- Make sure the Use External Editor box is checked
- Fill Exec Path with the path to your VS Code executable
- Fill Exec Flags with
{project} --goto {file}:{line}:{col}
You can use the following settings to configure Godot Tools:
editor_path- The absolute path to the Godot editor executable. Under Mac OS, this is the executable inside of Godot.app.gdscript_lsp_server_port- The WebSocket server port of the GDScript language server.check_status- Check the GDScript language server connection status.
The debugger is for GDScript projects. To debug C# projects, use C# Tools for Godot.
To configure the GDScript debugger:
- Open the command palette:
>Debug: Open launch.json- Select the Debug Godot configuration.
- Change any relevant settings.
- Press F5 to launch.
Configurations
Required
- "project": Absolute path to a directory with a project.godot file. Defaults to the currently open VSCode workspace with
${workspaceFolder}. - "port": Number that represents the port the Godot remote debugger will connect with. Defaults to
6007. - "address": String that represents the IP address that the Godot remote debugger will connect to. Defaults to
127.0.0.1.
Optional
- "launch_game_instance": true/false. If true, an instance of Godot will be launched. Will use the path provided in
editor_path. Defaults totrue. - "launch_scene": true/false. If true, and launch_game_instance is true, will launch an instance of Godot to a currently active opened TSCN file. Defaults to
false. - "scene_file": Path relative to the project.godot file to a TSCN file. If launch_game_instance and launch_scene are both true, will use this file instead of looking for the currently active opened TSCN file.
Usage
- Stacktrace and variable dumps are the same as any regular debugger
- The active scene tree can be refreshed with the Refresh icon in the top right.
- Nodes can be brought to the fore in the Inspector by clicking the Eye icon next to nodes in the active scene tree, or Objects in the inspector.
- You can edit integers, floats, strings, and booleans within the inspector by clicking the pencil icon next to each.
The Godot Tools extension is an open source project from the Godot organization. Feel free to open issues and create pull requests anytime.
See the full changelog for the latest changes.
- npm
- Typescript to compile, installed using npm with
npm install -g typescript - VSCE to create a VSIX file, installed using npm with
npm install -g vsce
- Open a command prompt/terminal and browse to the location of this repository on your local filesystem.
- Download dependencies by using the command
npm install - When done, package a VSIX file by using the command
vsce package. - Install it by opening Visual Studio Code, opening the Extensions tab, clicking on the More actions (...) button in the top right, and choose Install from VSIX... and find the compiled VSIX file.
When developing for the extension, you can open this project in Visual Studio Code and debug the extension by using the Run Extension launch configuration instead of going through steps 3 and 4. It will launch a new instance of Visual Studio Code that has the extension running. You can then open a Godot project folder and debug the extension or GDScript debugger.
- Godot 3.2 or later is required.
- Make sure to open the project in the Godot editor first. If you opened the editor after opening VS Code, you can click the Retry button in the bottom-right corner in VS Code.
- GDScript is a dynamically typed script language. The language server can't infer all variable types.
- To increase the number of results displayed, open the Editor Settings, go to the Language Server section then check Enable Smart Resolve.

