This is a short, user-friendly, and well-documented code to study the gravitational collapse of massless scalar fields in spherical symmetry. It uses the ADM formalism and follows the original seminal study of Matt Choptuik in 1993.
To compile the code you will need a C++ compiler. I use gcc and thus that is the default behaviour of the Makefile. If you wish to use a different compiler, then you must change the CXX variable inside the Makefile. The code also makes use of OpenMP, but if you do not want it or do not have it, simply remove the -fopenmp flag from the Makefile. Finally, if you choose to change the -O2 flag to -Ofast, the code will still work, but the NaN checker function will break.
To compile the code, go to the root directory and type
$: make
Compilation can be made faster, while still being safe on memory, by running
$: make -j
This will create the SFcollapse1D executable, while also creating the obj/ and out/ directories.
To compile the documentation, go to the doc/ directory and type
$: make
It will take a few seconds to compile the documentation, which will generate the file SFcollapse1D.pdf.
To run a simple example, which will ensure that the code has compiled properly, type
$: ./SFcollapse1D 200 10 10 0.2 0.3
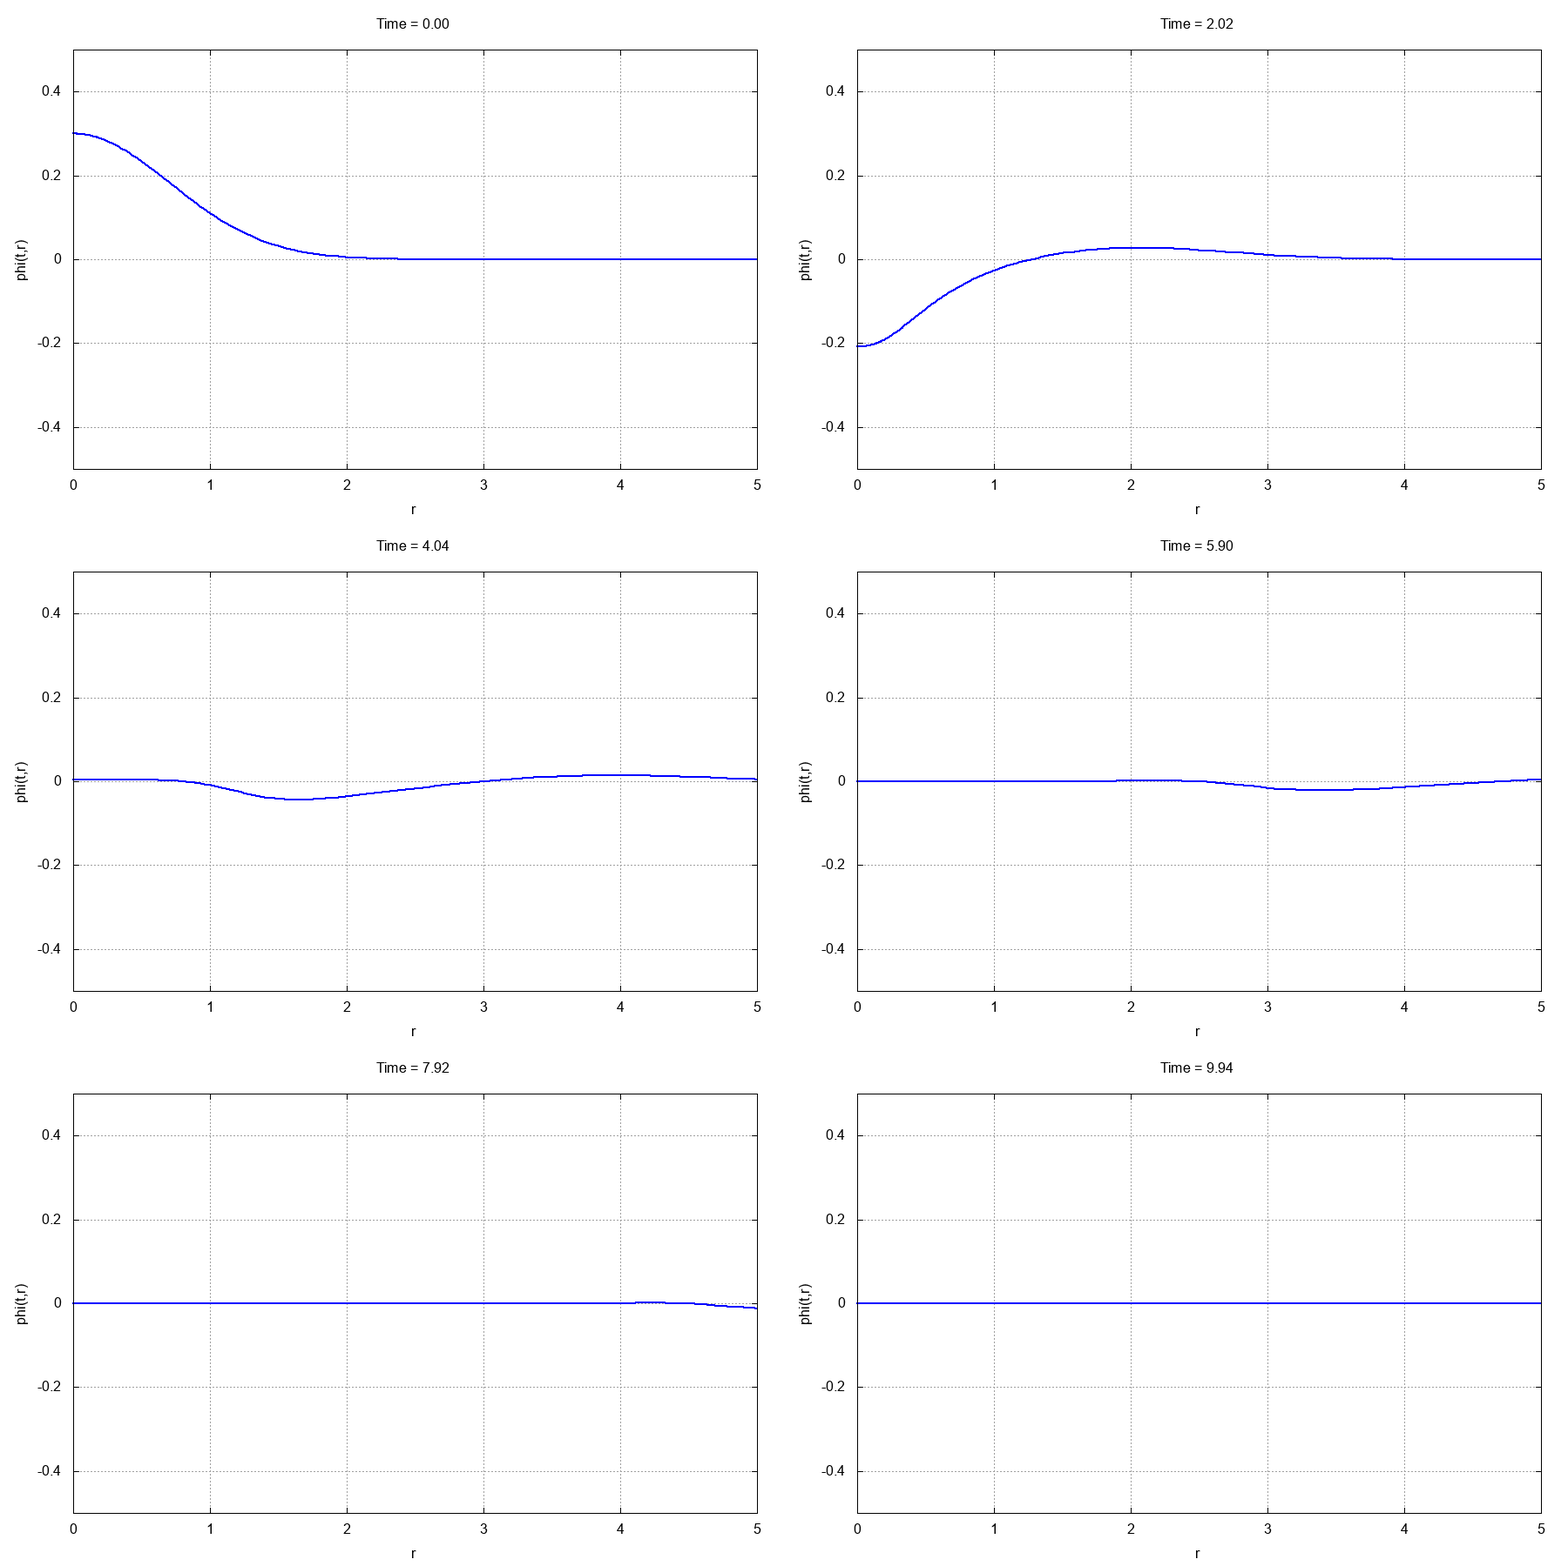
The entire run should take less than 10 seconds. If you have gnuplot installed and the gif terminal, go to the animations/ directory and type
$: gnuplot -e "which_var='scalarfield'" anim.gp
This should produce the following .gif animation:
For the sake of those wishing to reproduce results from our production
runs, we provide a script which will help the user to easily reproduce
some of our published results. In particular, after running make, one
can then run
$: ./runscript.sh
and wait for the 30-60 minutes (depending on your system) that is
required to perform to runs with SFcollapse1D and generate the data
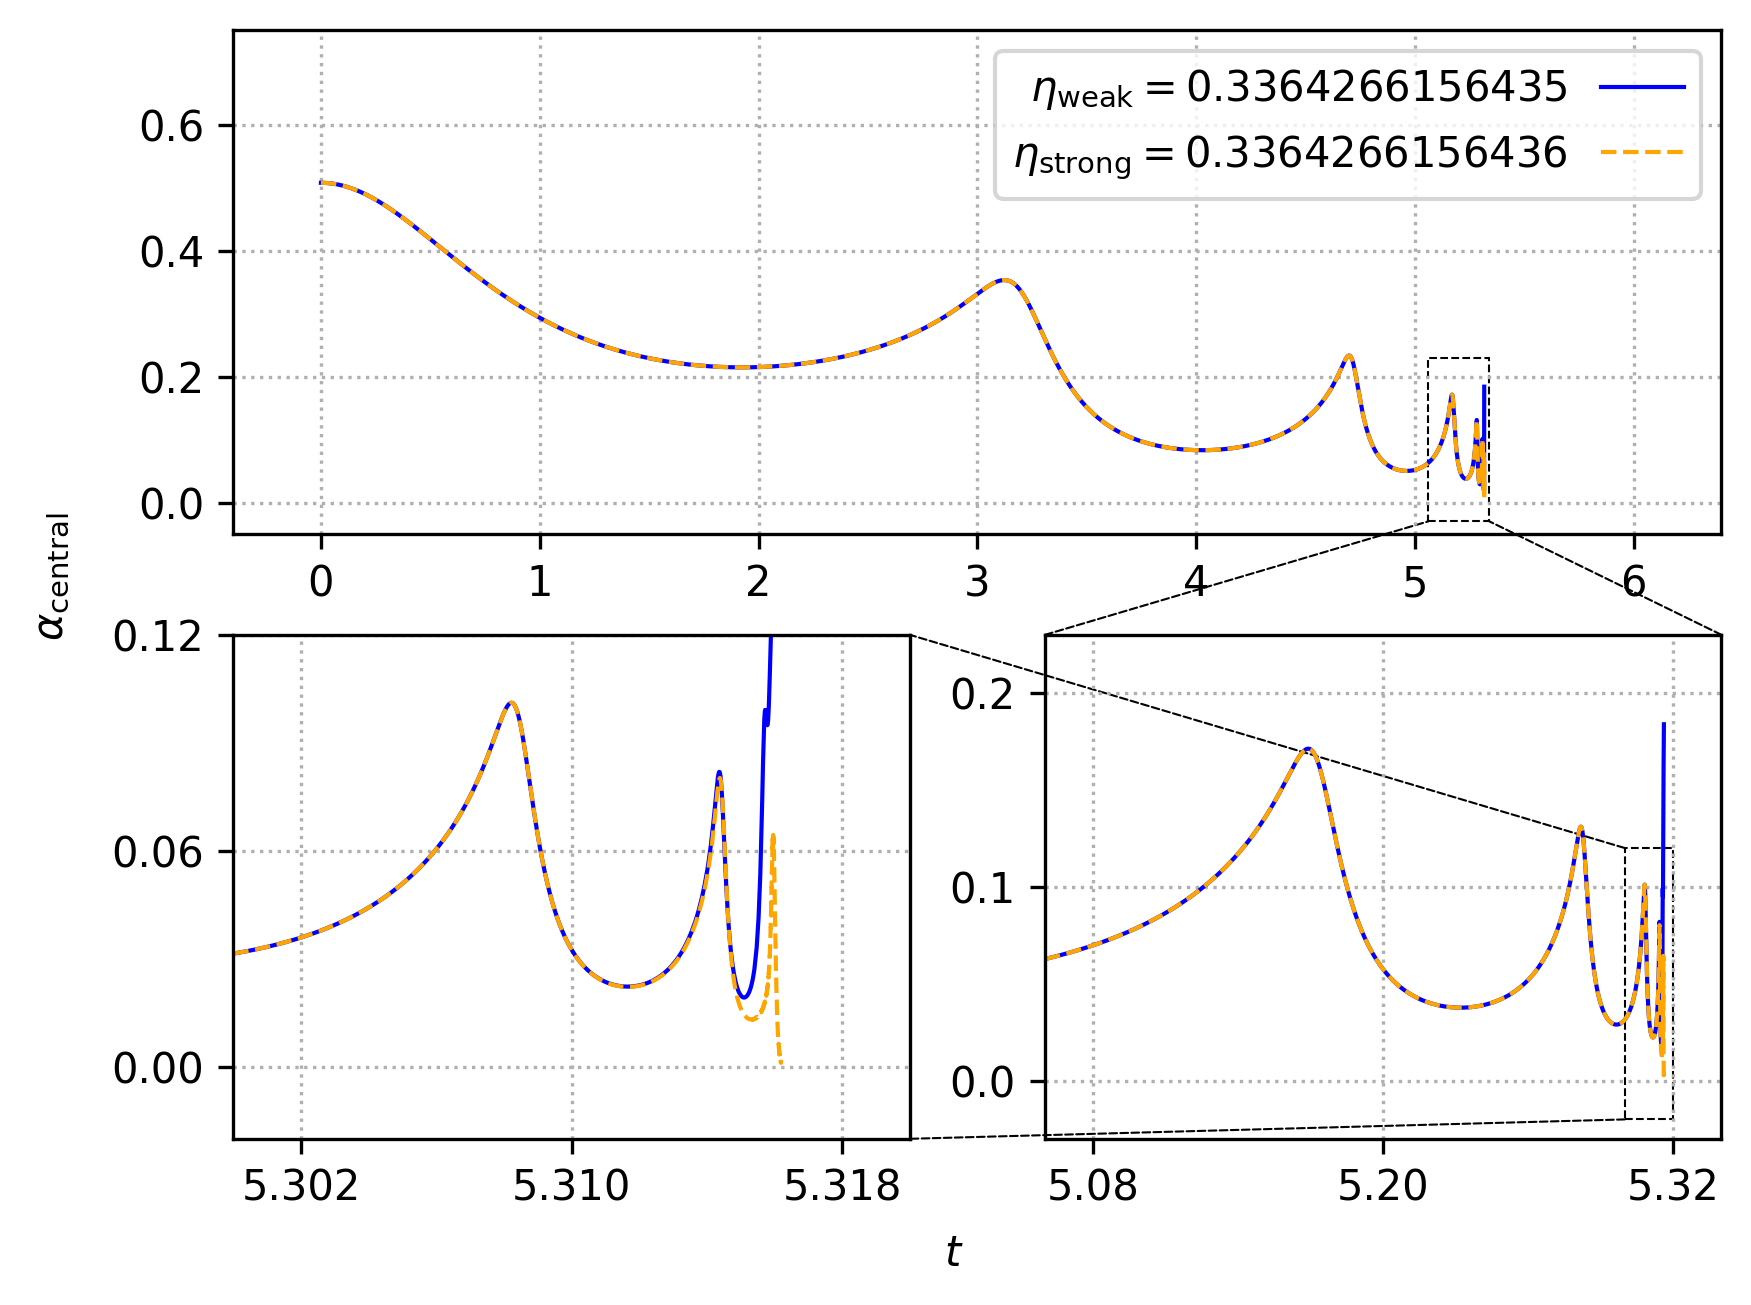
required to make the plots lapse_self_similarity.png and
central_scalar_field.png. These plots are generated using the
generate_plot.py script.
If for some reason the user is not able to generate the file
runscript.sh using make, the contents of that file are (modulo some
processor affinity optimizations):
#!/bin/bash
./SFcollapse1D 320 16 5.3162 0.08 0.3364266156435
mv out_central_values.dat out_weak.dat
./SFcollapse1D 320 16 5.3162 0.08 0.3364266156436
mv out_central_values.dat out_strong.dat
python generate_plot.py
The plots generated after running the commands above, which we display below, reproduce Figures 2 and 4 in Werneck et al. (2021), respectively.


