rfm
Tools for RFM Analysis
Overview
Tools for RFM (recency, frequency and monetary) analysis. Generate RFM score from both transaction and customer level data. Visualize the relationship between recency, frequency and monetary value using heatmap, histograms, bar charts and scatter plots.
Installation
# Install rfm from CRAN
install.packages("rfm")

# Or the development version from GitHub
# install.packages("devtools")
devtools::install_github("rsquaredacademy/rfm")
Articles
Usage
Introduction
RFM (recency, frequency, monetary) analysis is a behavior based technique used to segment customers by examining their transaction history such as
- how recently a customer has purchased (recency)
- how often they purchase (frequency)
- how much the customer spends (monetary)
It is based on the marketing axiom that 80% of your business comes from 20% of your customers. RFM helps to identify customers who are more likely to respond to promotions by segmenting them into various categories.
Data
To calculate the RFM score for each customer we need transaction data which should include the following:
- a unique customer id
- date of transaction/order
- transaction/order amount
RFM Table
rfm uses consistent prefix rfm_ for easy tab completion. Use
rfm_table_order() to generate the RFM score.
analysis_date <- lubridate::as_date('2006-12-31', tz = 'UTC')
rfm_result <- rfm_table_order(rfm_data_orders, customer_id, order_date, revenue, analysis_date)
rfm_result
#> # A tibble: 995 x 9
#>    customer_id        date_most_recent recency_days transaction_count amount
#>    <chr>              <date>                  <dbl>             <dbl>  <dbl>
#>  1 Abbey O'Reilly DVM 2006-06-09                205                 6    472
#>  2 Add Senger         2006-08-13                140                 3    340
#>  3 Aden Lesch Sr.     2006-06-20                194                 4    405
#>  4 Admiral Senger     2006-08-21                132                 5    448
#>  5 Agness O'Keefe     2006-10-02                 90                 9    843
#>  6 Aileen Barton      2006-10-08                 84                 9    763
#>  7 Ailene Hermann     2006-03-25                281                 8    699
#>  8 Aiyanna Bruen PhD  2006-04-29                246                 4    157
#>  9 Ala Schmidt DDS    2006-01-16                349                 3    363
#> 10 Alannah Borer      2005-04-21                619                 4    196
#>    recency_score frequency_score monetary_score rfm_score
#>            <int>           <int>          <int>     <dbl>
#>  1             3               4              3       343
#>  2             4               1              2       412
#>  3             3               2              3       323
#>  4             4               3              3       433
#>  5             5               5              5       555
#>  6             5               5              5       555
#>  7             3               5              5       355
#>  8             3               2              1       321
#>  9             2               1              2       212
#> 10             1               2              1       121
#> # ... with 985 more rows
Heat Map
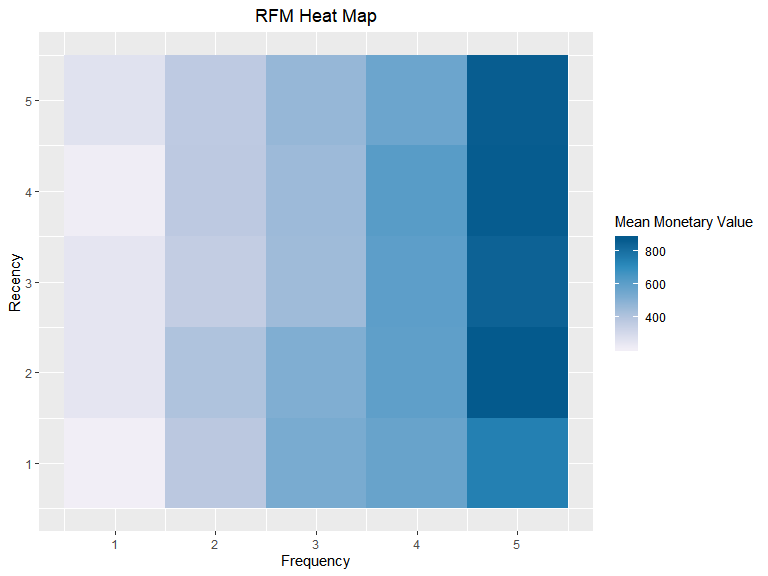
The heat map shows the average monetary value for different categories of recency and frequency scores. Higher scores of frequency and recency are characterized by higher average monetary value as indicated by the darker areas in the heatmap.
rfm_heatmap(rfm_result)Bar Chart
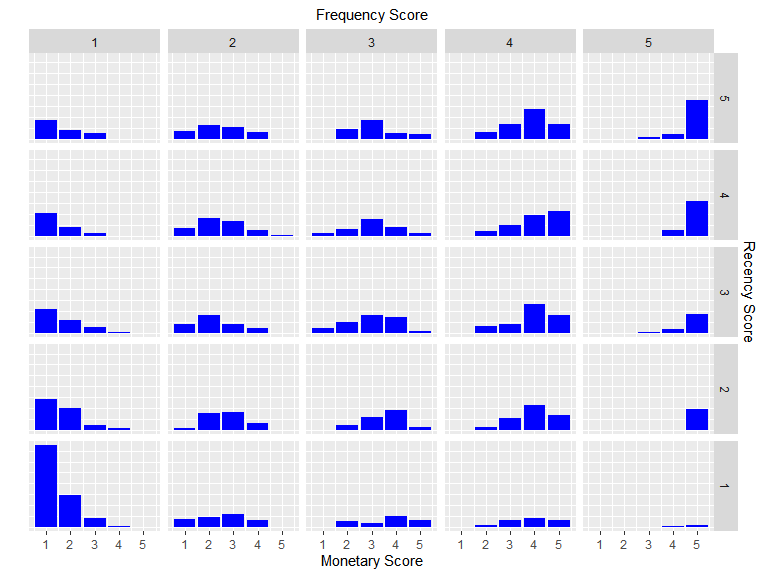
Use rfm_bar_chart() to generate the distribution of monetary scores
for the different combinations of frequency and recency scores.
rfm_bar_chart(rfm_result)Histogram
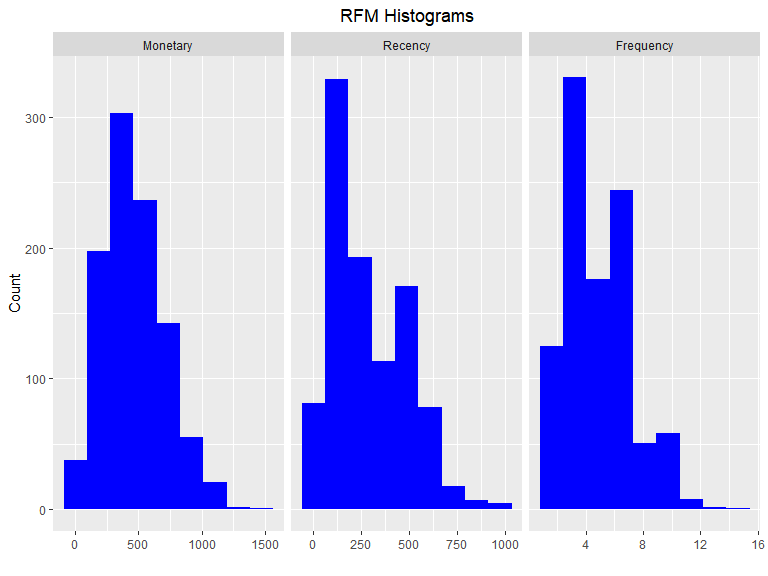
Use rfm_histograms() to examine the relative distribution of
- monetary value (total revenue generated by each customer)
- recency days (days since the most recent visit for each customer)
- frequency (transaction count for each customer)
rfm_histograms(rfm_result)Customers by Orders
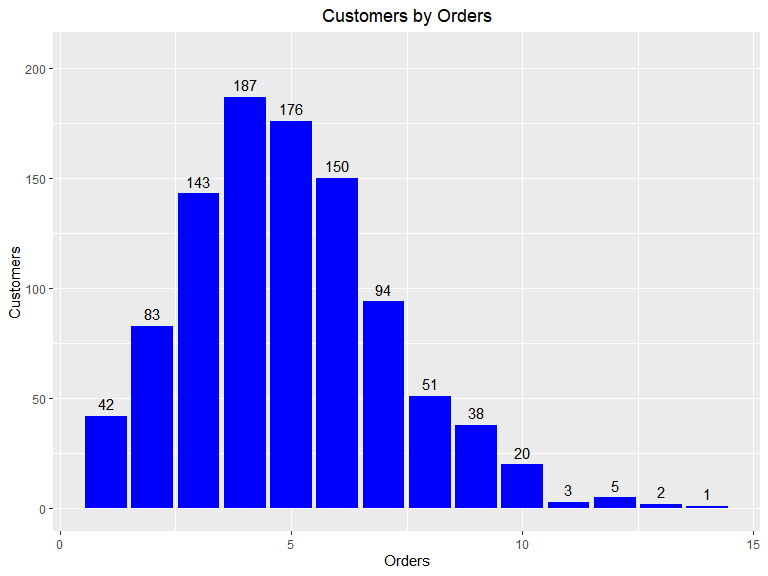
Visualize the distribution of customers across orders.
rfm_order_dist(rfm_result)Scatter Plots
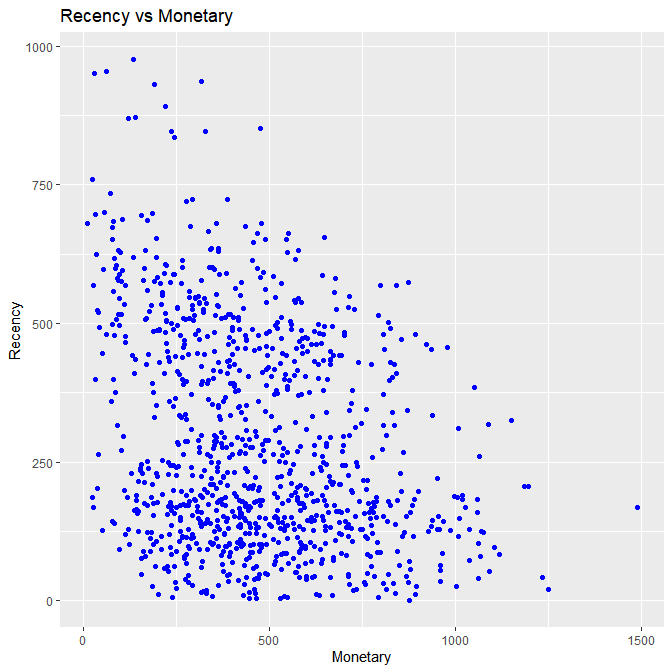
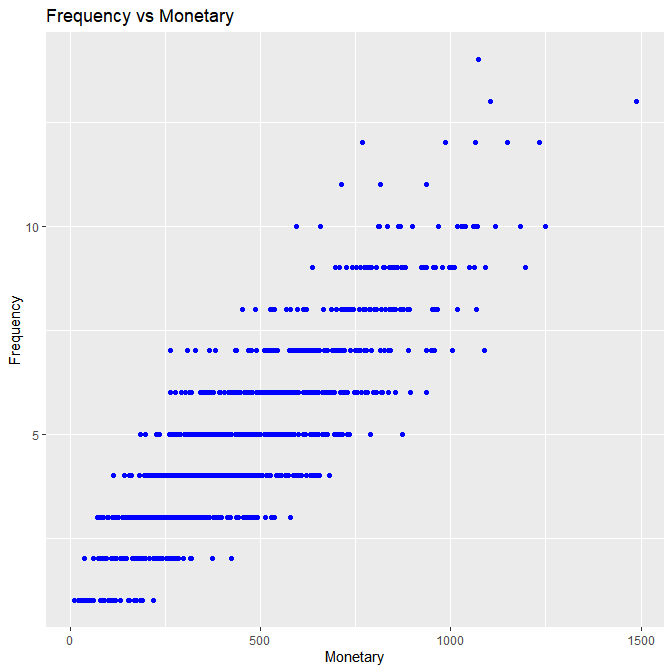
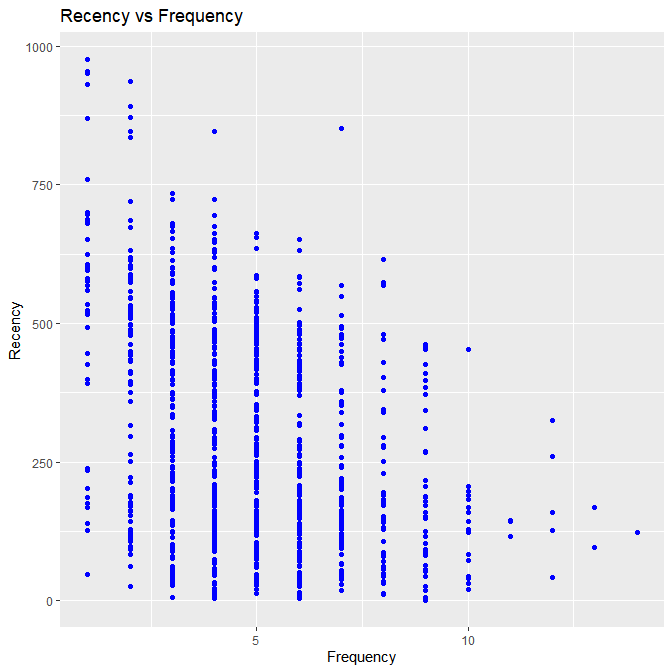
The best customers are those who:
- bought most recently
- most often
- and spend the most
Now let us examine the relationship between the above.
Recency vs Monetary Value
rfm_rm_plot(rfm_result)Frequency vs Monetary Value
rfm_fm_plot(rfm_result)Recency vs Frequency
rfm_rf_plot(rfm_result)Getting Help
If you encounter a bug, please file a minimal reproducible example using reprex on github. For questions and clarifications, use StackOverflow.


