Classifying data from hybrid, fuel only and electric vehicles
api-demo.mov
Medium post about how the natural language API works
Data consists on vehicle model information for three kinds of vehicles: fuel-based, electric and hybrid vehicles.
Data is extracted from an API listed on this site. The data source and data processing steps Contains information licensed under the Open Government License - Canada.
The vehicles in this dateset underwent five cycle fuel consumption testing:
- City test
- Highway test
- Cold temperature operation
- Air conditioner use
- Higher speeds with more rapid acceleration and braking
Vehicles are assigned a CO2 rating, a smog rating, and CO2 emissions are evaluated.
I am interested to uncover patterns and interesting insights between fuel-based, electric and hybrid vehicles.
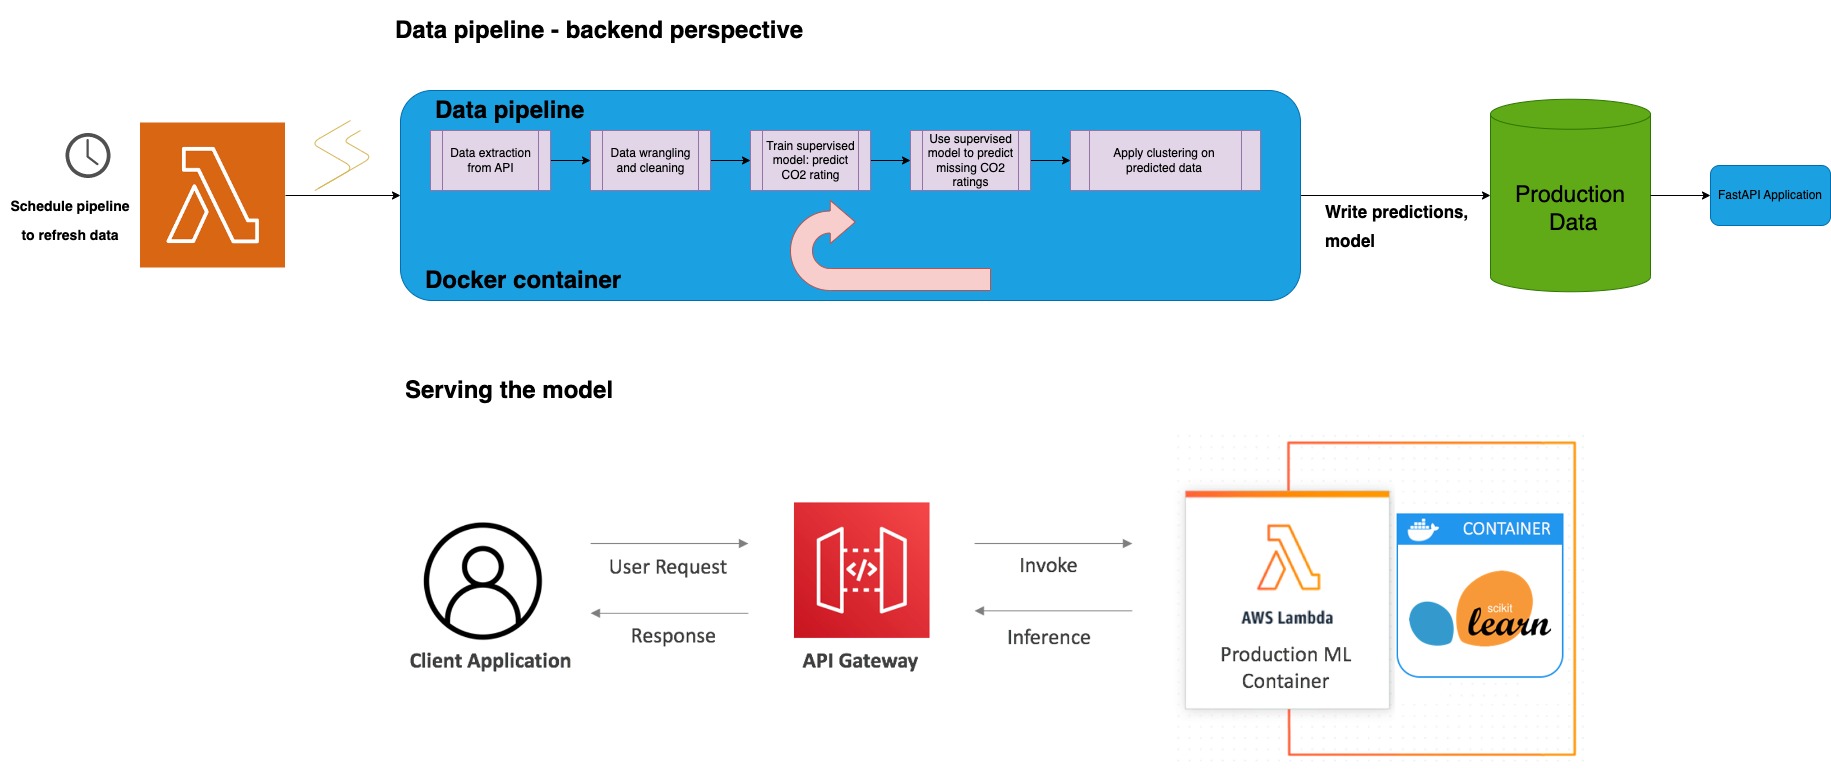
The data pipeline consists of five scripts:
- Data download and wrangling: extracts data on vehicle models from this public API
- CO2 ratings are missing in a large proportion of fuel-based vehicles. The goal of this script is to perform supervised learning (voting classifier) to impute missing CO2 scores based on fuel-based vehicles. A model is setup and saved.
- Model is used to complete missing values for CO2 ratings. KNNImputer is used on to complete missing smog rating scores.
- Once the data is labelled, clustering is perfomed with the purpose of uncovering patterns. Recursive feature elimination with cross-validation is used to identify key features. Once key features are selected, Agglomerative Clustering, TSNE is computed for 2 and 3 dimensions, then results are compared against labelled data.
- Results are served via an API with two key entry points:
- Search: a natural language entry point that can ask questions about the data.
- Predict: use the API to predict CO2 rating scores based on key features.
- [In progress] a dashboard with visualizations (includes interesting vehicle stats, clustering results in 3D)
- [Future work] scrape vehicle purchases data and analyse consumer trends with a focus on changes in ratios of types of vehicles purchased over time
Dashboard: http://18.221.229.86:8050/
Natural language text api: http://18.221.15.147:8000/docs#/
Ensure you have Docker installed. Ensure you have an OpenAI API key. Create a .env file with the parameters
OPENAI_API_KEY=<your-api-key>
docker pull lgfunderburk/vehicle_classification:search
docker run -it --rm -p 8000:8000 -v /path/to/your/.env:/app/.env lgfunderburk/vehicle_classification:search
Then visit http://localhost:8000
Alternatively, you can clone the repo and build the images locally
git clone https://github.com/lfunderburk/fuel-electric-hybrid-vehicle-ml.git
cd fuel-electric-hybrid-vehicle-ml
docker build -t myapi:latest -f Dockerfile.api .
docker build -t mydashapp:latest -f Dockerfile.dash .
Clone the repo
git clone https://github.com/lfunderburk/fuel-electric-hybrid-vehicle-ml.git
cd fuel-electric-hybrid-vehicle-ml
Create and activate a virtual environment
conda create --name mlenv python==3.10
conda activate mlenv
Install dependencies
pip install -r requrements.txt
From command line at the project root directory level
ploomber build
This command will execute the following data pipeline
tasks:
  - source: src/data/data_extraction.py
    product:
      nb: notebooks/data_extraction.ipynb
  - source: src/models/train_model.py
    product:
      nb: notebooks/train_model.ipynb
      model: models/hard_voting_classifier_co2_fuel.pkl
  - source: src/models/predict_model.py
    product:
      nb: notebooks/predict_model.ipynb
  - source: src/models/clustering.py
    product:
      nb: notebooks/clustering.ipynb
Sample output
name             Ran?      Elapsed (s)    Percentage
---------------  ------  -------------  ------------
data_extraction  True          29.371        8.13723
train_model      True         136.637       37.8553
predict_model    True          52.2234      14.4685
clustering       True         142.715       39.5391
From command line at the project root directory level
pytest
From command line at the project root directory level
uvicorn src.app.app:app
-
This application consists of a Dash app with a dashboard that allows the user to visualize trends in different kinds of vehicles and consumer trends with a time component.
-
The data pipeline is scheduled to refresh and retrain the model in batches, and saves the model's results to a database/api for easier retrieval.
Project based on the cookiecutter data science project template. #cookiecutterdatascience
