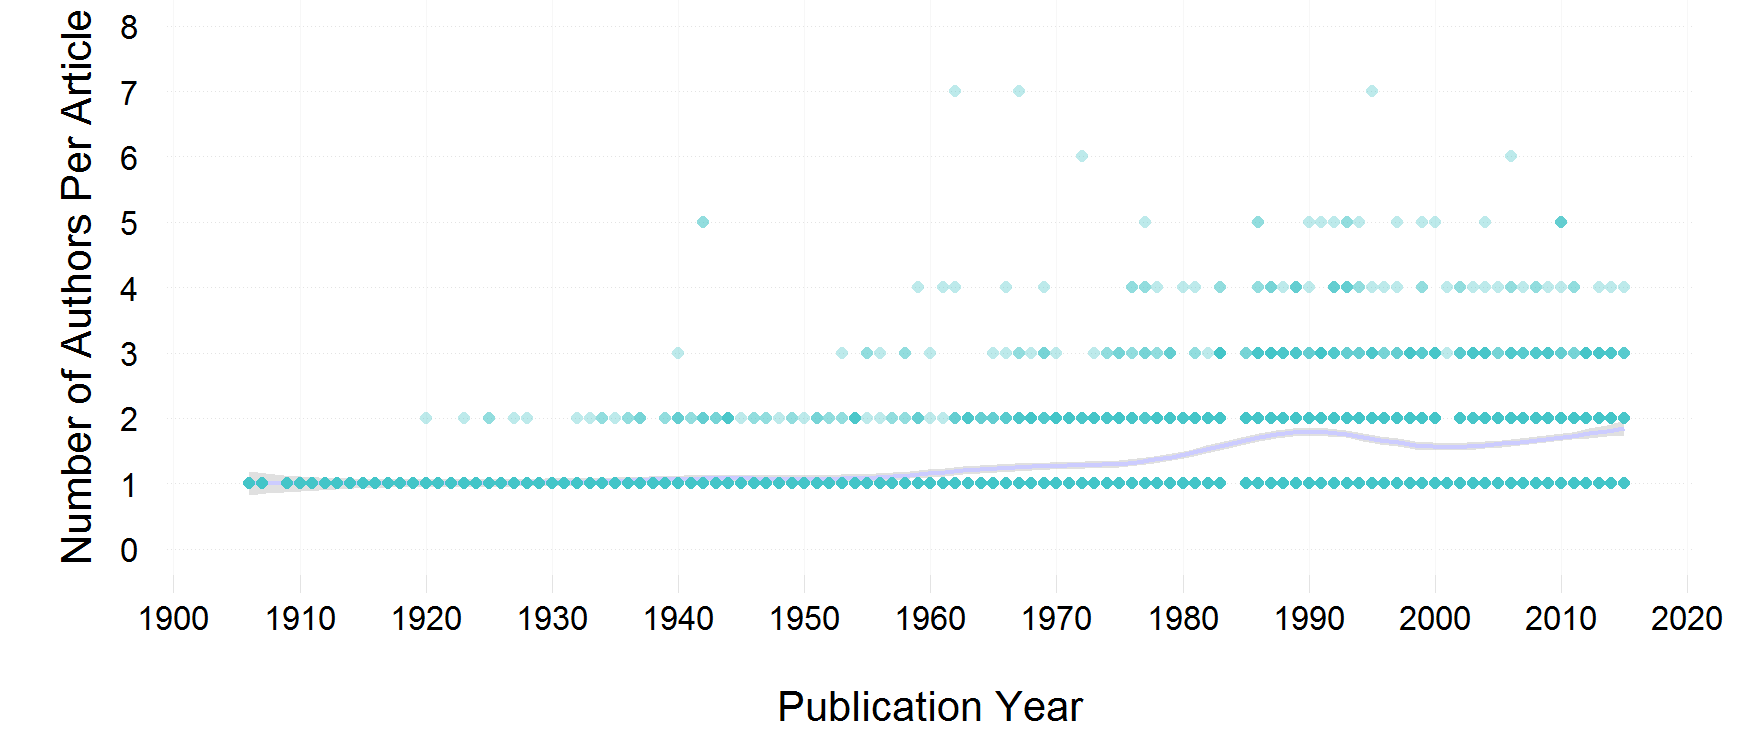
Data are from five prominent political science journals: APSR, BJPS, Perspectives, PS, and World Politics.
- Preview of Results
- Scraping the (meta) data
- The data and the codebook
- Scripts for producing the graphs and graphs
- Related: Proportion of precise quantitative statements in APSR abstracts
The data show that till well into the 1960s, the average article published in the APSR was solo-authored. Today, co-authored papers are the norm.
Over the past 100 or so years, article length has shown marked variability. There is a marked see-saw pattern in the average length of the article, but unlike top economics journals we don't see a marked trend towards longer articles. It is very likely, however, that the length of online appendices has grown substantially.
Number of views an article or abstract has received follows the familiar power law distribution with most articles receiving very few views.
All the data are from journals published by the Cambridge University Press (CUP). CUP has a single publishing platform for all its journals with the link differing only by 'JID'. For instance, to scrape meta data and abstract for all APSR articles from CUP, use (http://journals.cambridge.org/action/displayBackIssues?jid=PSR. The JIDs for various journals are easily found. They can also be scraped from the CUP page listing all the journals that it publishes.
To scrape the data, use get_data.py. The script depends on urllib2. To run the script, python get_data.py
Options:
- Name of the output file. Specify
FINAL_OUTPUT_FILEon line 11 of get_data.py. - Column names. Specify
HEADERon Line 18 of get_data.py.
Note: The script allows for interruption. If interrupted, it will restart from where it stopped. And it will append the results to the existing output file.
Each row in the csv is a separate article. And the columns are:
- article.url
- issue.year
- issue.volume
- issue.date.of.publication
- issue.pages
- article.title
- article.abstract
- article.pages
- 10 colums e.g author1, institution1, etc, ...,author1, institution1
- article.abstract.views
- article.full.text.views
- Recode the data
- Article lengths (measured by number of pages) over time. (Script, Graph)
- Number of authors per article over time. (Script, Graph)
- Number of articles per issue over time. (Script, Graph)
- Number of pages per issue over time. (Script, Graph)
- Distribution of full text views. (Script, Graph)
- Distribution of abstract views. (Script, Graph)
- Proportion of Female Authors per article. (Script, Graph)
- Based on the idea by titleogy, Length of title. (Script, Graph)
Released under CC BY 2.0.
