It is a light and useful Python module, helping you generate a small size, pretty report as PDF slides (or any other format documents which humans can directly read and hand out) each time after your programs finish. All you need to do is to customize a report template using MarkDown with variables names used in your Python program and maintain a dict to store those variables. Then, A few lines of code added before the end of programs can automatically fetch and display them in the final report file. Also, the codes intended to deal with frequent structures/arguments changes or data source changes can benefit from the package if the report can play a role of 'snapshot' (with timestamp) of each code version.
- Documentation: https://hk-journalist.readthedocs.io/en/latest/index.html
- Slides for sharing: slides
- Quick Start
- I am too lazy to write a
mdtemplate - Support For zh_CN (New feature 🎉)
- What will my variables on slides look like?
- More examples and instructions
- Tips
- Prerequirements
Before installing hkjournalist, please make sure pandoc and pdflatex are already properly installed in the environment. (install instruction)
pip install hkjournalist
Write such an md file, use a pair of {} to wrap every variable which will be assigned a specified value in your code. save it to template.md
% Hello World
% Xinyi Li
% 2019-12-19
---
### sine plot

### sine table
{sin_table}
### sine function
```{{.python}}
{sin_func}
```
First, you should define a dict to record mapping with variable names and their value
from hkjournalist import Journalist

config = {}
Then, start your programming, and do not forget to assign value to corresponding variable names in config:
def sin_2x_and_cos_2x(x):
    y = np.sin(x) * np.sin(x) + np.cos(x) *  np.cos(x)
    return y

x = np.arange(0, 4 * np.pi, 0.1)
y1 = np.sin(x)
y2 = np.cos(x)

df = pd.DataFrame({'x': x, 'sin(x)': y1, 'cos(x)': y2})
df['sin^2^(x)+cos^2^(x)'] = sin_2x_and_cos_2x(df['x']).values
df = df.set_index('x')

# plot sine curve as sin_plot
ax = df.plot()
plt.tight_layout()
config['sin_plot'] = ax

# random select 5 point (x,y) as sin_table
config['sin_table'] = df.sample(5)

# sin_2x_and_cos_2x as sin_func
config['sin_func'] = sin_2x_and_cos_2xLast but not least, attach 3 lines critical code below to have your Journalist make a report and save it to big_news.pdf (you can get all code above in demo and the output file big_news.pdf)
# HK journalist runs faster than everyone! hear variable and make a report
reporter = Journalist(template_file='template.md')
reporter.hear(config)
reporter.report(output_file='big_news.pdf', beamer=True, overwrite=True)
Report slides display as below:

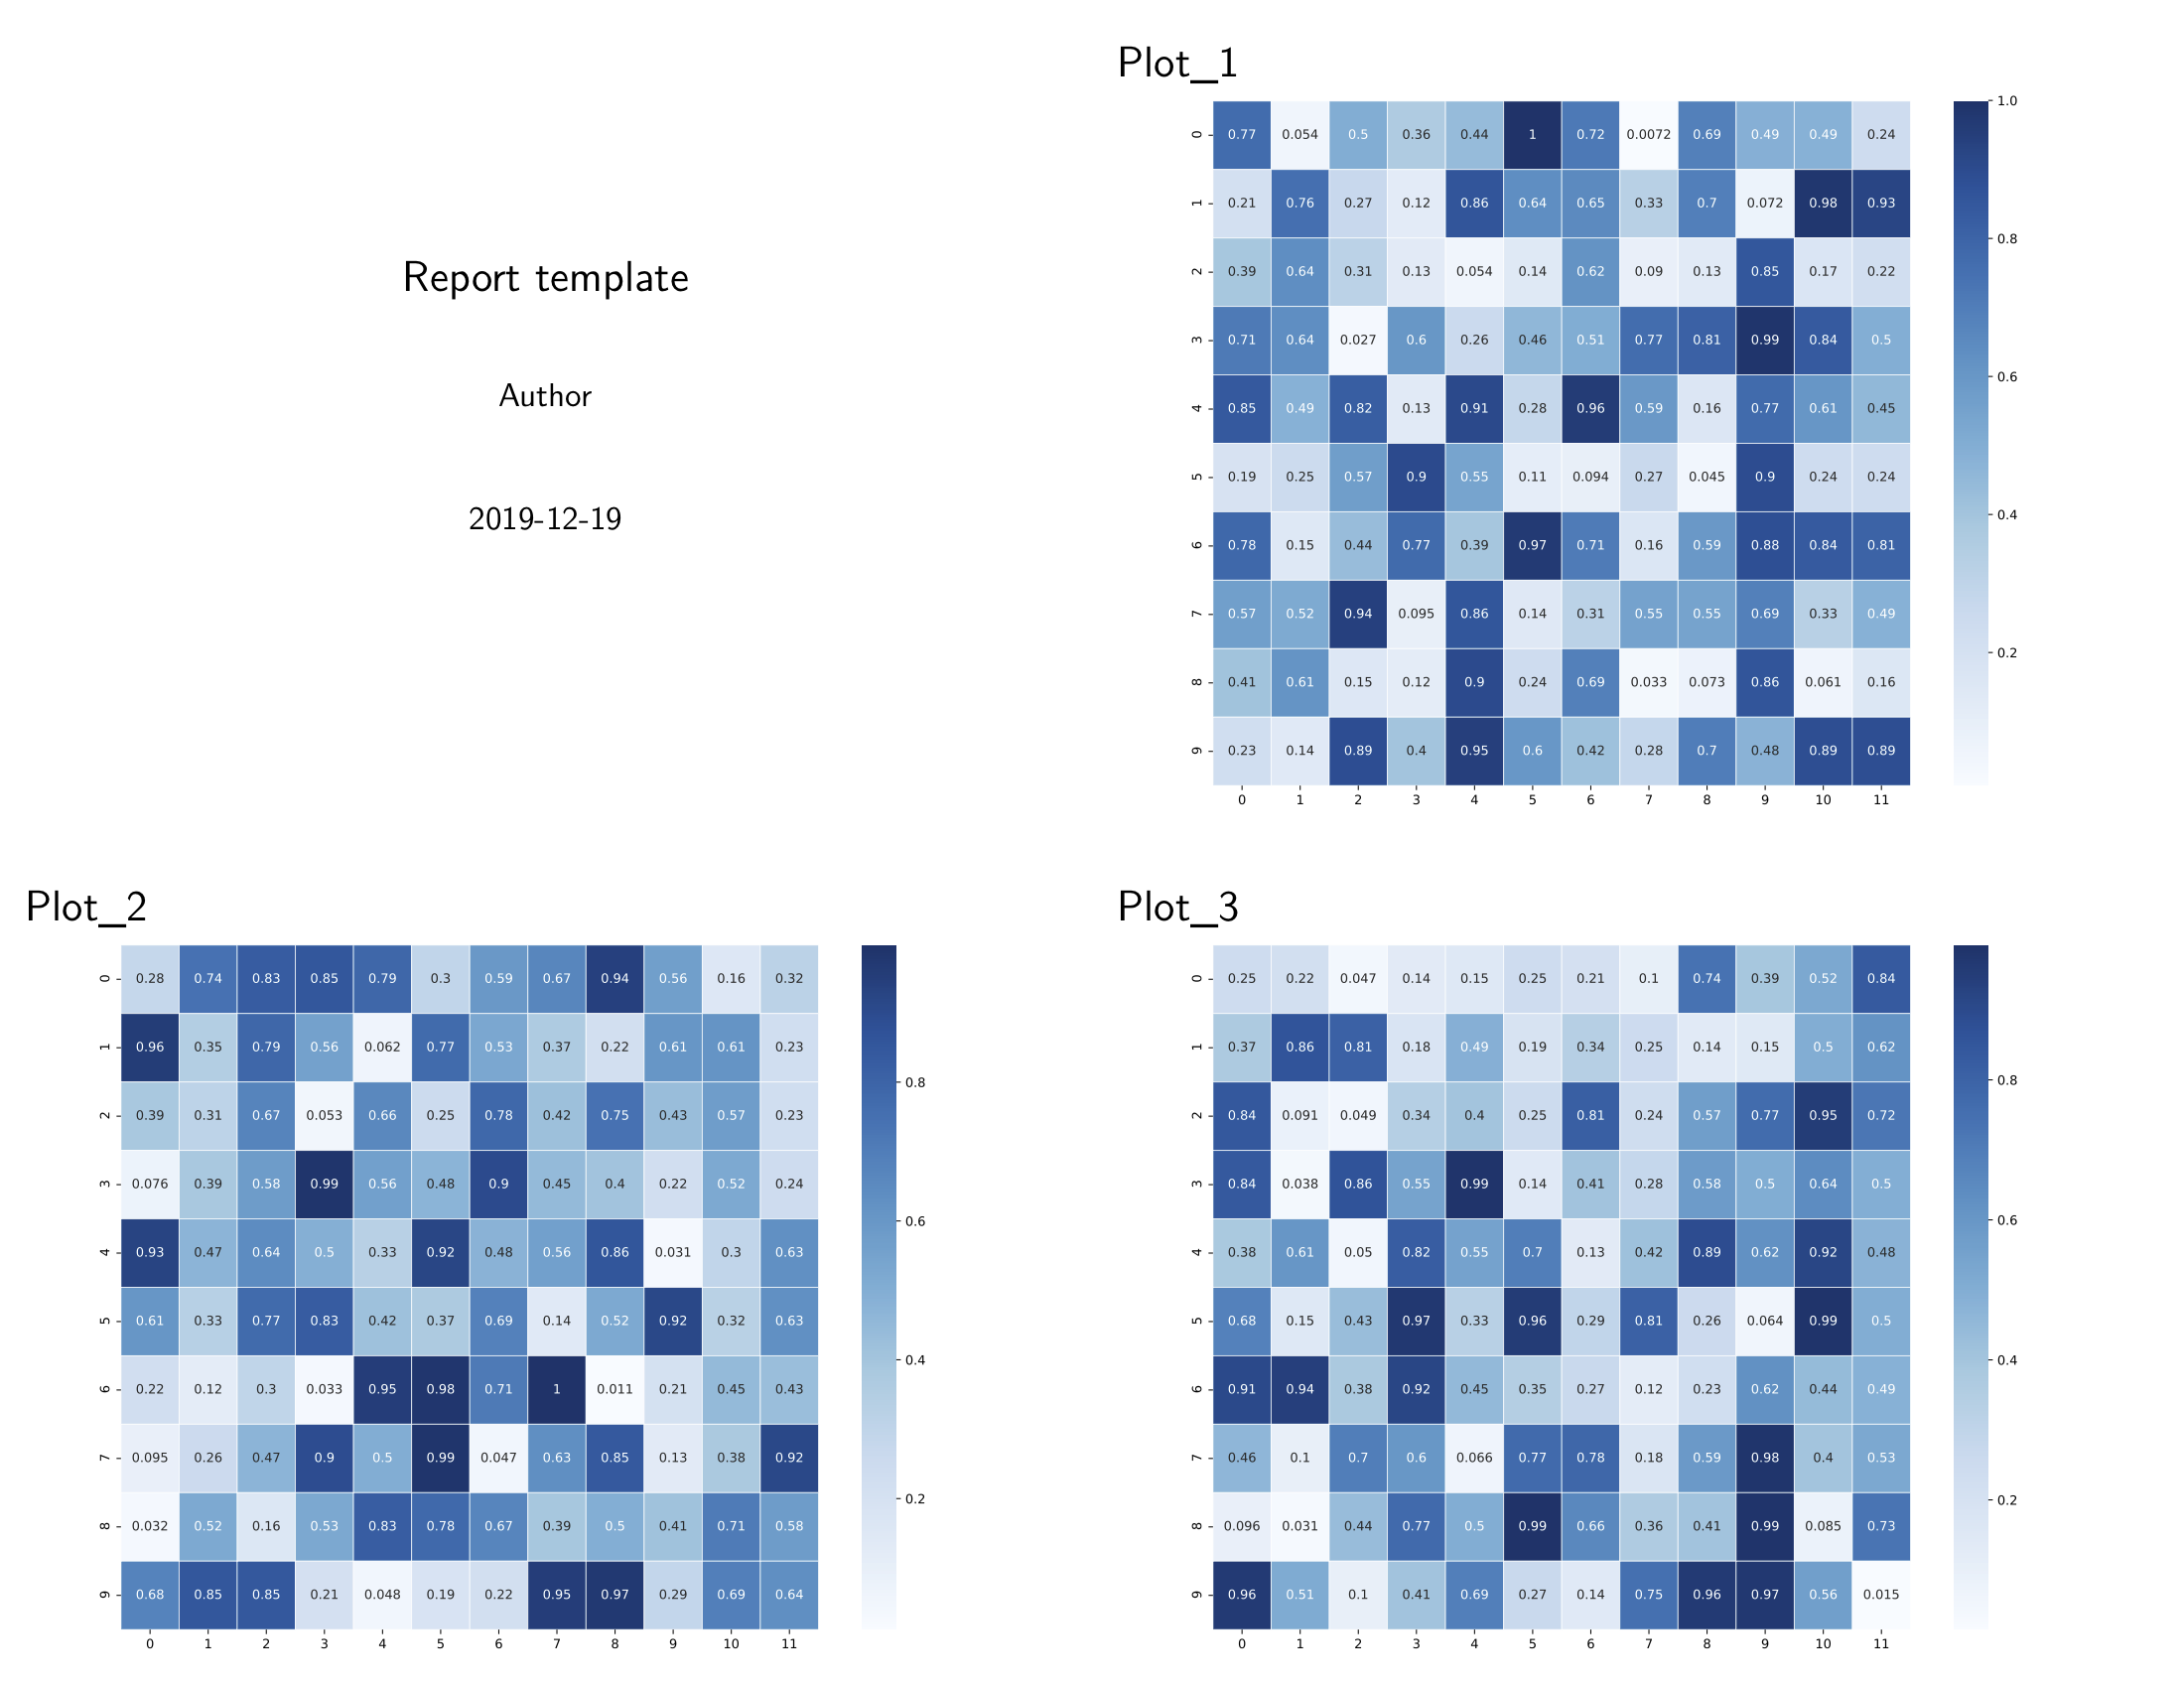
If you have too many variables to report, which make write a template a big project, or simply don't want to write an md template, No problem! hkjournalist can generate a report template with each variable on one slide page automatically. With slight modification or directly using it as a template, you can get your real report.
Example
import numpy as np
import matplotlib.pyplot as plt
import seaborn as sns
from hkjournalist import Journalist

config = {}

for i in range(1, 4):
    uniform_data = np.random.rand(10, 12)
    plt.figure(figsize=(10, 8))
    ax = sns.heatmap(uniform_data, cmap='Blues', annot=True, linewidth=.5)
    plt.tight_layout()
    config[f'Plot_{i}'] = ax

reporter = Journalist(fig_height='80%')
reporter.hear(config)
reporter.generate_template('auto_generate_template.md')
reporter.report(output_file='auto_report.pdf', beamer=True, overwrite=True)
Output (raw file ):
Yes, now, from version 0.0.5, it can use template contains chinese characters 🎉.
Just pass argument zh=True when creating a Journalist(), or set its zh property at any time before generating reports.
reporter = Journalist(template_file='./reports/template.md', zh=True)If you want to use your customized template with chinese characters, don't forget to add one line at first of the YAML metadata block in your Markdown template:
---
documentclass: ctexbeamer
...
---
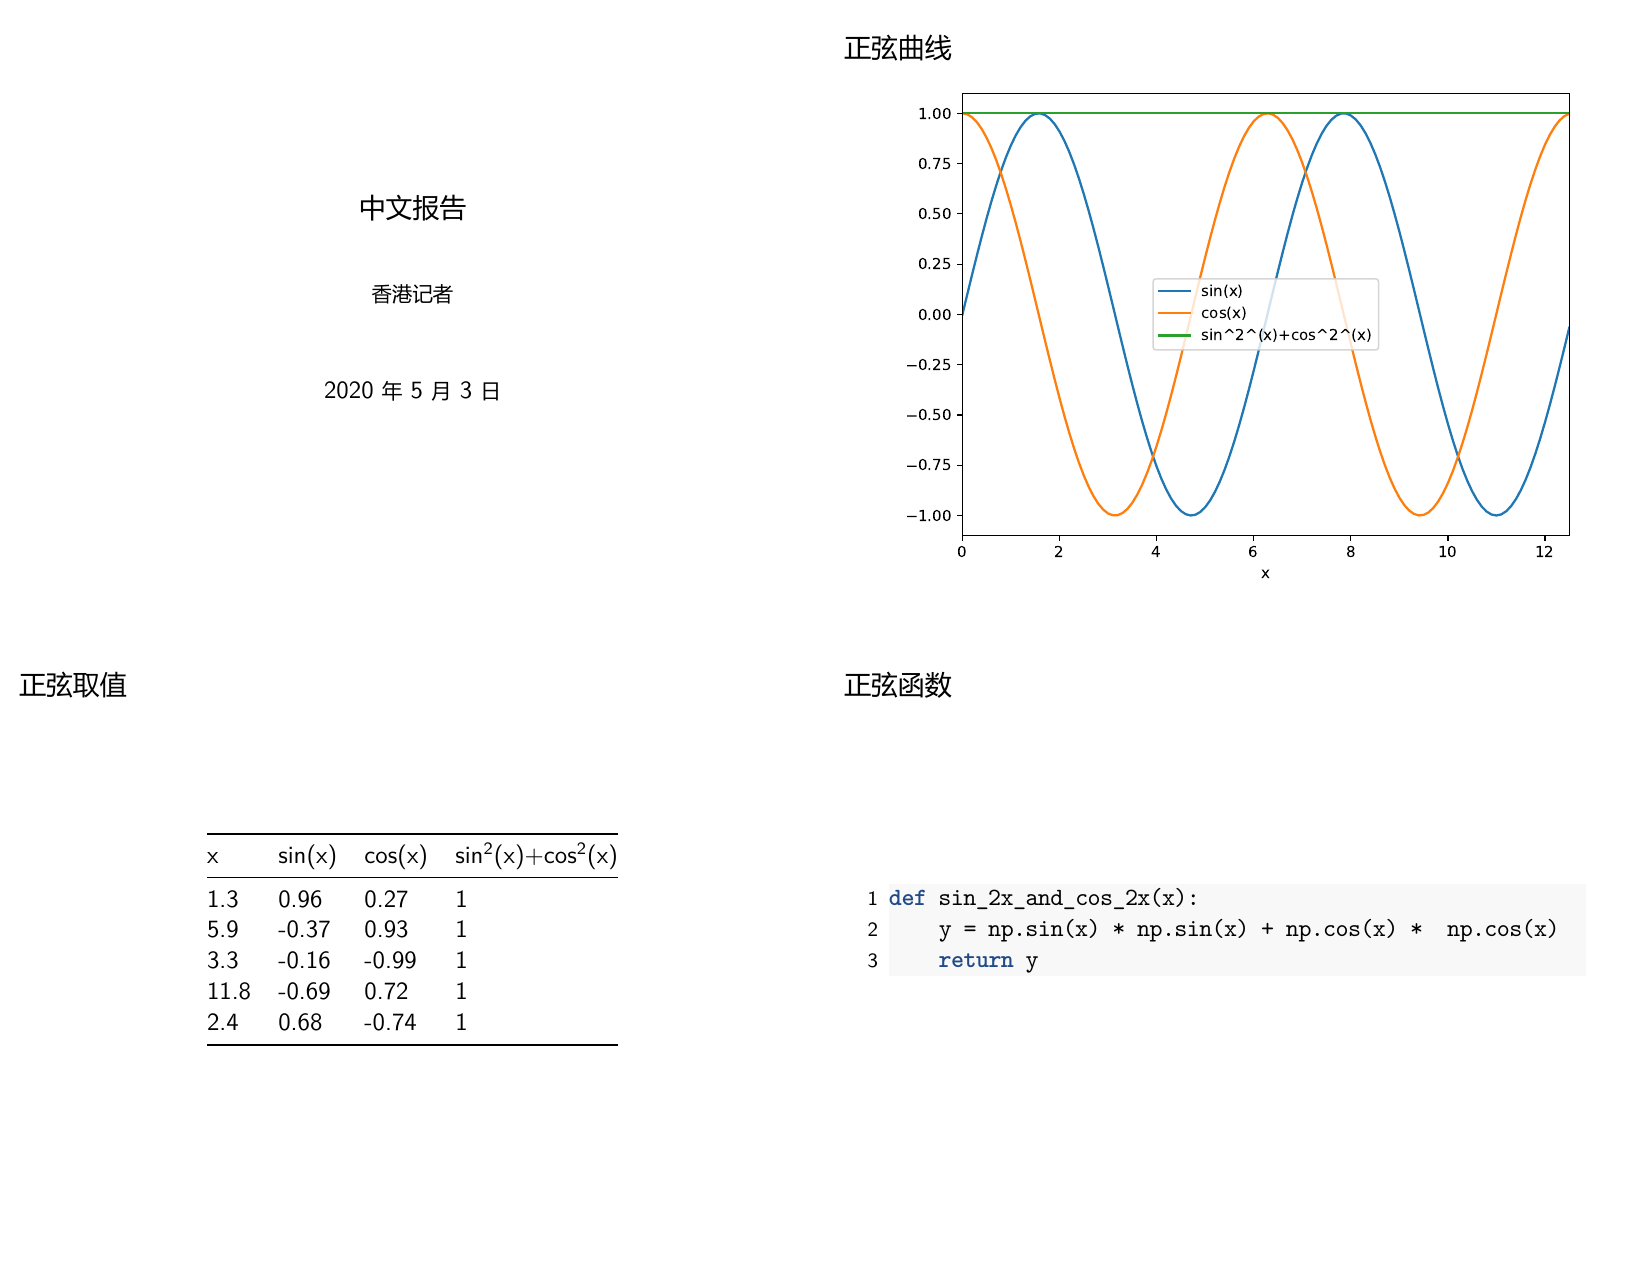
Here is a simple example similar to Quick start, Except for its template containing chinese characters. A perfect chinese slides file can be generated by the program as:
Note: make sure xelatex is installed properly.
More details can be found in API Documentation and this tutorial.
All variables pass to Journalist via hear will display as strings just like what their __str__ method does.
Except for 4 types with special support:
pandas.DataFrame: -> a 3-line table (TeXdefault style)matplotlib.axes.SubplotBase(known as base figure objectaxinmatplotlib): -> a figure print on report (with high quality and small size aspdf)function: -> its full definitionlist(str): ->len(list)followed by a sentance with all words concatenated.
Besides, list(str) and pandas.DataFrame may be too long to display, which are allowed to span multiple pages in final slides.
- [Documentation(https://hk-journalist.readthedocs.io/)
- More complex usages available in examples
- How to write a sophisticated slides template using
md? See pandoc tutorials
- Before pass
plt.Axesobject (figure object used inmatplotlib) todict, useplt.tight_layout()statement to adjust its size. - Use double curly braces
{{}}to escape{}in the template. - Turn off parameter
overwriteinJournalist.report(), you will get a file name with a timestamp in it. All these reports generated by such a method serve as snapshots. - To produce plain PDF article document instead of beamer slides, turn off
beamerinreport().
pandoc: https://pandoc.org/installing.htmltexlive/mactex(for MacOS): https://www.tug.org/texlive/ http://www.tug.org/mactex/
And if you use some IDEs like PyCharm, you need to add their path (use which tex and which pandoc in bash environment to find them) to environment variables $PATH in IDE run options. (e.g. in Pycharm,run-> edit configuration -> environment variables)
For Jupyter Notebook users, the final output file may not be opened on Chrome (see this question). So, for convenience, you can download Firefox to write notebooks and view pdf reports right after generating.


