GURAFU (グラフ) is a plotting lib for Common Lisp. (though it’s still work in progress…)
GURAFU learnt a lot from CLIM (McCLIM) and SCIGRAPH, though, I hop GURAFU would not be too complex.
You should clone the following repos to your lisp load
path (for example: ~/quicklisp/local-projects):
- cl-bdf: used in opticl backend for BDF font support
NOTE: Right now the documentation is poor. Hidden bugs are possible… But these should be at least functionable.
I will have to slow down the developing speed…
Clean the code, write some docs. But every time
when I have to refer to Mathematica’s Plot, or
Python’s matplotlib, I shall consider adding
similar functionality into GURAFU.
The GURAFU plot is like to be presented like below:
- background rectangle: color sepcified with
:background-colorparameter - plot-panes: using
add-plot-datamacro oradd-plot-panemethod to add aplot-paneto plot, which will be draw first if last added - decorator: using
add-plot-decoratormacro to add widgets to plot, samely which will be draw first if last added - frame around ticks:
- ticks number could be set seperately using
:x-ticksand:y-ticks - tick value are presented in precision at
:tick-precise - the tick label is set seperately using
:x-labeland:y-label
- ticks number could be set seperately using
You could just try:
(in-package :gurafu)

(with-present-to-file
    (plot plot :margin 10 :x-min -10.0 :x-max 10.0 :y-min -1 :y-max 1)
    (out-path :width 400 :height 400)
  (add-plot-data plot
      (line-plot-pane sin :color +yellow+)
    (loop for x from -10.0 upto 10.0 by 0.1
          collect (list x (sin x))))
  (add-plot-data plot
      (line-plot-pane cos :color +green+)
    (loop for x from -10.0 upto 10.0 by 0.1
          collect (list x (cos x)))))

out-path
You could see the result as below:

It is possible to draw log log plot like below:
(in-package :gurafu)

(with-present-to-file
    (plot plot :margin 10
               :scale :log-log
               :x-min 1 :x-max 10
               :y-min 1 :y-max 1000)
    (out-path)
  (add-plot-data plot
    (line-plot-pane square :color +大红+)
    (loop for x from 1 upto 10 by 0.1
          collect (list x (* x x))))
  (add-plot-data plot
    (line-plot-pane cubic :color +鹅黄+)
    (loop for x from 1 upto 10 by 0.1
          collect (list x (* x x x)))))

out-path
Also, you may try some more plot pane types:
histogram-pane:(in-package :gurafu) (with-present-to-file (plot plot :margin 10 :y-min 0 :y-max 40 :x-min -300 :x-max 300) (out-path :width 400 :height 400) (add-plot-data plot (histogram-pane sin :color +莲红+) (with-open-file (dat dat-path) (loop for line = (read-line dat nil nil) while line collect (parse-integer line))))) out-path
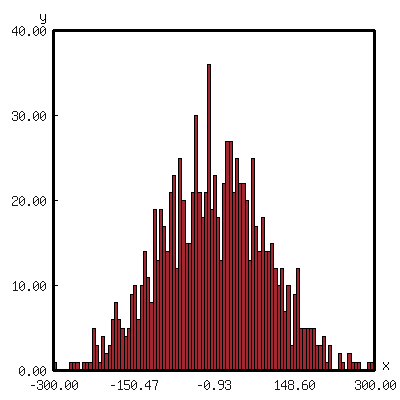
Note: the
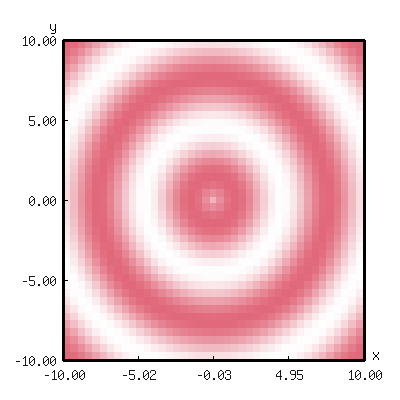
demo-dat/hist.txtis generated by following Mathematica code:Round[100*#] & /@ RandomVariate[NormalDistribution[], 1000].2d-grid-pane:(in-package :gurafu) (with-present-to-file (plot plot :margin 20 :x-min -10 :x-max 10 :y-min -10 :y-max 10) (out-path :width 400 :height 400) (add-plot-data plot (2d-grid-pane grid :color (make-linear-color-mapper +white+ +银红+)) (loop for y from -10 upto 10 by 0.5 collect (loop for x from -10 upto 10 by 0.5 collect (sin (sqrt (+ (* x x) (* y y))))))) (set-xy-bounding-box plot -10.0 10.0 -10.0 10.0)) out-path
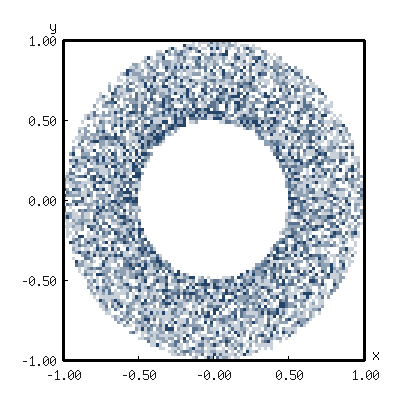
2d-histogram-pane(in-package :gurafu) (with-present-to-file (plot plot :margin 20 :x-min -1 :x-max 1 :y-min -1 :y-max 1) (out-path :width 400 :height 400) (add-plot-data plot (2d-histogram-pane arc :color (make-linear-color-mapper +white+ +翠蓝+)) (loop for i below 10000 for r = (+ 0.5 (random 0.5)) for theta = (* 2 pi (1- (random 2.0))) collect (list (* r (cos theta)) (* r (sin theta))))) (set-xy-bounding-box plot -1.0 1.0 -1.0 1.0)) out-path
NOTE: the color map function is quite plain, I need to make this more easier to use…
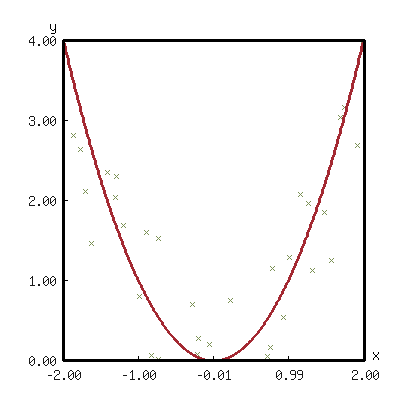
scatter-pane(in-package :gurafu) (with-present-to-file (plot plot :margin 20 :x-min -2 :x-max 2 :y-min 0 :y-max 4) (out-path :width 400 :height 400) (add-plot-data plot (scatter-pane pesudo-data :point-style :cross :point-size 4 :color +鹅黄+) (loop for x from -2 upto 2 by 0.1 for delta-x = (- 0.2 (random 0.4)) for delta-y = (- 0.8 (random 1.6)) collect (list (+ x delta-x) (+ (* x x) delta-y)))) (add-plot-data plot (line-plot-pane fit :color +大红+) (loop for x from -2 upto 2 by 0.01 collect (list x (* x x))))) out-path


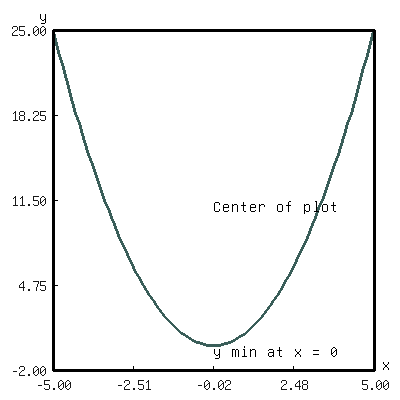
labelfor add a text at plot(in-package :gurafu) (with-present-to-file (plot plot :margin 10 :y-min -2 :y-max 25 :x-min -5 :x-max 5) (out-path) (add-plot-data plot (line-plot-pane square :color +大红官绿+) (loop for x from -5 to 5 by 0.1 collect (list x (* x x)))) (add-plot-decorator (plot min-point label 0 0) :label "y min at x = 0") (add-plot-decorator (plot plot-center label :uv 0.5 0.5) :label "Center of plot")) out-path
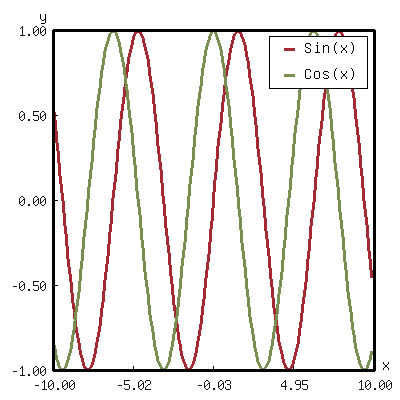
legendfor plot legends(in-package :gurafu) (with-present-to-file (plot plot :margin 10 :x-min -10 :x-max 10 :y-min -1 :y-max 1) (out-path :width 400 :height 400) (add-plot-data plot (line-plot-pane sin :color +大红+) (loop for x from -10.0 upto 10.0 by 0.1 collect (list x (sin x)))) (add-plot-data plot (line-plot-pane cos :color +鹅黄+) (loop for x from -10.0 upto 10.0 by 0.1 collect (list x (cos x)))) (add-plot-legend (plot :position :top-right :padding 0.02) ("Sin(x)" :color +大红+) ("Cos(x)" :color +鹅黄+))) out-path


Here are (is) something I use for my homework report, but please note that this these maybe written for a every early stage GURAFU, therefore some code and api may change.
- Random Function Test Report
histogram-pane,scatter-pane,2d-grid-pane,line-plot-paneare used, see appendix B.5 for the plot code using GURAFU.
Here are some little developing memos about GURAFU:
- GURAFU should be device independent. It should
support different backends.
Although currently backend output only
opticlis done… opticlbackend use BDF font (UNIFONT) fordraw-char!- better color map function
- more graph styles
- make GURAFU more easy to use
- get it a good documentation
- GURAFU class slot variables should be prefixed with
%, for example%backend,%width,%height; - GURAFU low-level operation methods should be postfixed
with
!, for exampledraw-text!,draw-line!; - GURAFU constants should be wrapped with
+, for example+white+,+black+; - GURAFU global variables should be wrapped with
*, for example*foreground-color*,*background-color*;
- decorator widgets on plot
labels, color map,legends, … rewrite protocol with closure to simplify code- auto detect plot
xy-bounding-boxsize - rewrite the plot-pane, I should add a abstract map-over-data
mechanics to make the developing experience same for all
most any plot data.
the propose will be like this:
- a
for-every-datalike method for sequencial data types (list,arrayand so on); - a
plot-dataclass to hold arbitrary plot data, together with some basic stastics and analyise methods
- a
- documentations
- demos: cltl2 demo
- api manual
- usage tutorial
- other backends
html, svg, …
- more
plot-pane(this should after I finish theplot-datarewrite)
This codes maybe outdated, so may not work. Or these codes need some patches to make it work, so may not recommanded.
I should update them later:
Right now it’s quite mass… though you could load
gurafu/core and then switch into gurafu/core package,
and try the following code:
(define-presentation labeled-point ()
  ((label :initform "" :initarg :label)
   (style :initform :dot :initarg :point-style))
  (:draw
   (%uv-left %uv-top style label)
   (draw-point self 0 0 :point-style style :pen-width 5)
   (draw-text  self 0 16 label :font-size 16 :text-align :center)))

(defun present-labled-point (label x y style)
  (present (make-instance 'labeled-point
                          :label label :left x :top y
                          :point-style style)))

(let* ((*default-backend* (make-backend :opticl :width 200 :height 200))
       (patterns '(("DOT" :dot)
                   ("CIRCLE" :circle)
                   ("PLUS" :plus)
                   ("BOX"  :box)
                   ("CROSS" :cross)
                   ("TRIANGLE" :triangle))))
  (loop for col below 2 do
    (loop for row below 3 do
      (destructuring-bind (label style)
          (pop patterns)
        (present-labled-point
         label (* 60 (1+ col)) (* 50 (1+ row)) style))))
  (output! *default-backend* "/path/to/demo-img/first-usable-demo.png"))
You could see the result as below:

I add some Chinese traditional colors in 《天宫开物》 (according to 《染作江南春水色》), you could see as below:
(define-presentation color-box-present (base-presentation
                                        margined-mixin)
  ((%color :initform *foreground-color*
           :initarg :color)
   (%label-color :initform *foreground-color*
                 :initarg :label-color)
   (%label :initform ""
           :initarg :label))
  (:draw (%color %label %label-color)
         (draw-rect self 0.0 1.0 1.0 0.0
                    :color %color
                    :fill? t
                    :fill-color %color)
         (draw-text self 0.5 0.5 %label
                    :color %label-color
                    :text-align :centered
                    :line-width (stream-box-width self)))
  (:documentation
   "Present a color box. "))

(defun map-present-list (list map-fn &optional (layout :horizontal))
  (if (listp list)
      (let ((layout (ecase layout
                      (:horizontal (make-instance 'horizontal-layout-presentation))
                      (:vertical   (make-instance 'vertical-layout-presentation))))
            (child-layout (if (eq layout :horizontal) :vertical :horizontal)))
        (loop with weight = (/ 1.0 (length list))
              for elem in list
              do (add-component layout
                                (gensym "LIST")
                                (map-present-list elem map-fn child-layout)
                                weight)
              finally (return layout)))
      (funcall map-fn list)))

(with-present-to-file
    (plot base-presentation)
    (out-path :width 800 :height 800)
  (setf plot (map-present-list
              '((+大红+ +莲红+ +桃红+ +银红+)
                (+水红+ +木红+ +鹅黄+ +紫+)
                (+天青+ +葡萄青+ +蛋青+ +翠蓝+)
                (+天蓝+ +月白+ +草白+ +毛青+)
                (+大红官绿+ +豆绿+ +油绿+ +藕色+)
                (+茶褐+ +包头青+))
              (lambda (color-name)
                (make-instance 'color-box-present
                               :label-color +white+
                               :margin 5
                               :label (format nil "~a" color-name)
                               :color (symbol-value color-name)))))
  (set-stream-bounding-box plot 0 800 800 0))

out-path