- jenkins_docker folder: deploy jenkins using docker
- monitoring_docker folder: deploy observable systems using docker
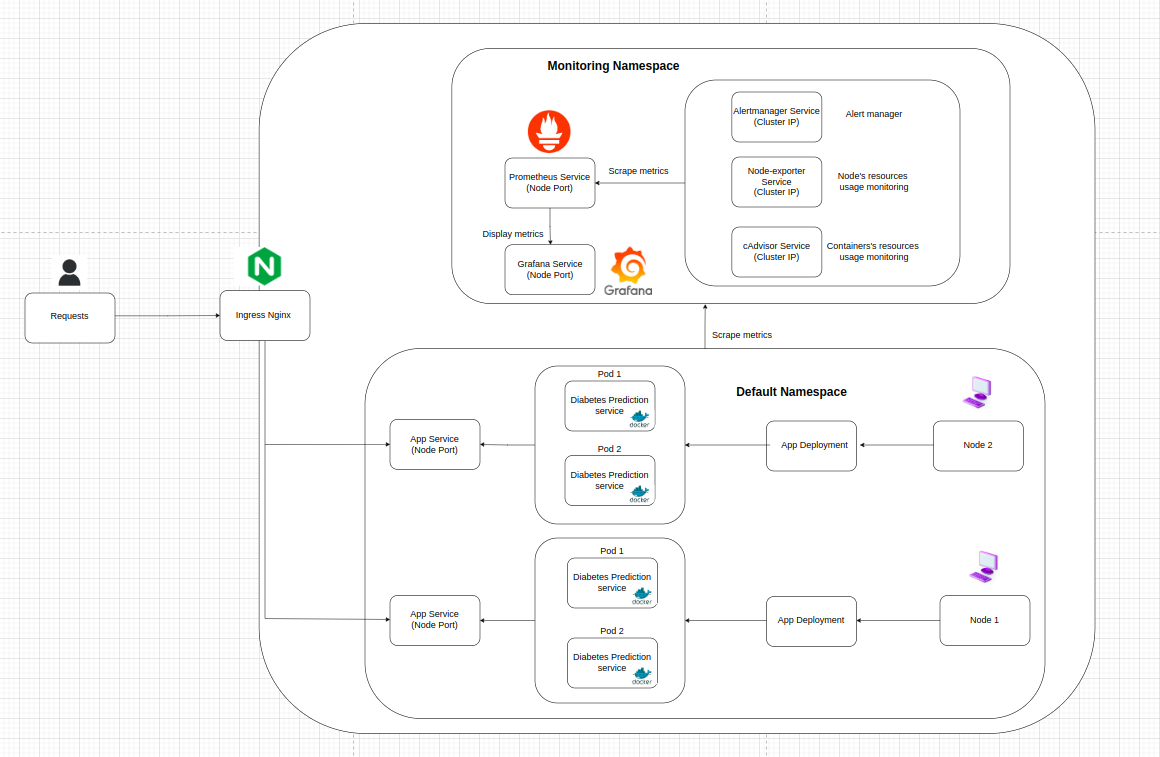
- monitoring_k8s folder: deploy observable systems using k8s
- monitoring: install necessary objects to deploy Prometheus + Grafana services
- service_monitor: set up object to scape custom metrics from diabetes service
- service_k8s folder: deploy service using k8s
- diabetes_prediction_chart folder: using istio ingress gateway + virtual service to access to diabetes service in the cluster
- nginx-ingress folder: using to istall nginx
- service_ingress folder: using nginx ingress to access to diabetes service in the cluster
- service_wo_ingress foler: using loadbalancer to access to diabetes service in the cluster
- Tested on Python 3.7 (recommended to use a virtual environment such as Conda)
- Install requirements:
pip install -r requirement.txt - EDA + Modeling + Training code: notebooks/Diabetes_prediction.ipynb
- Data: data/diabetes.csv
- Docker engine
- Docker images:
- dunghoang99/diabete-prediction-api:latest: build diabetes prediction service
- dunghoang99/diabete-api-metrics:v1.0.0: build iabetes prediction service combined with custom metrics using opentelemetry
- fullstackdatascience/jenkins:lts: build Jenkins service
- fullstackdatascience/jenkins-k8s/lts: build Jenkins service + Helm
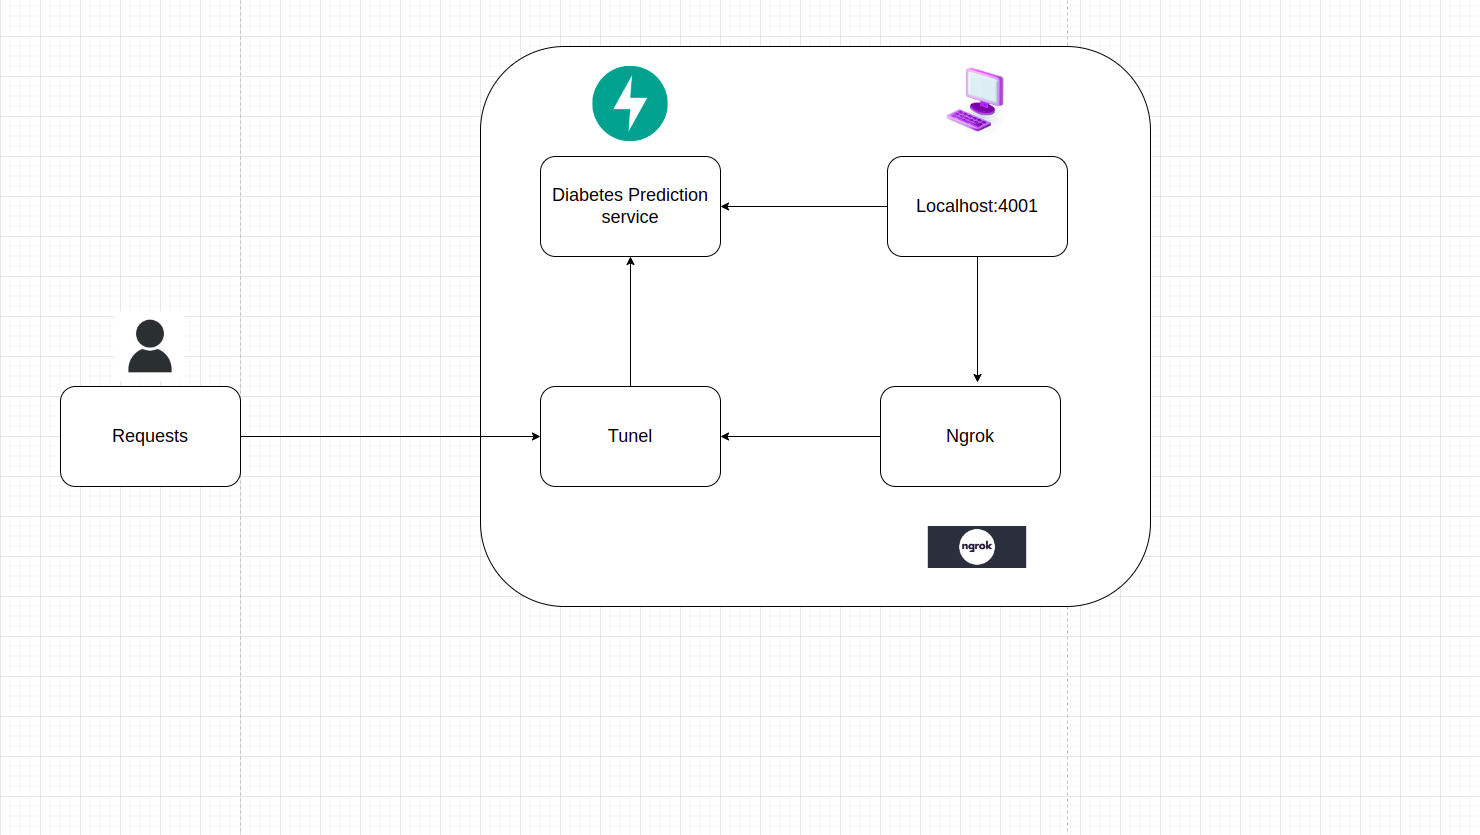
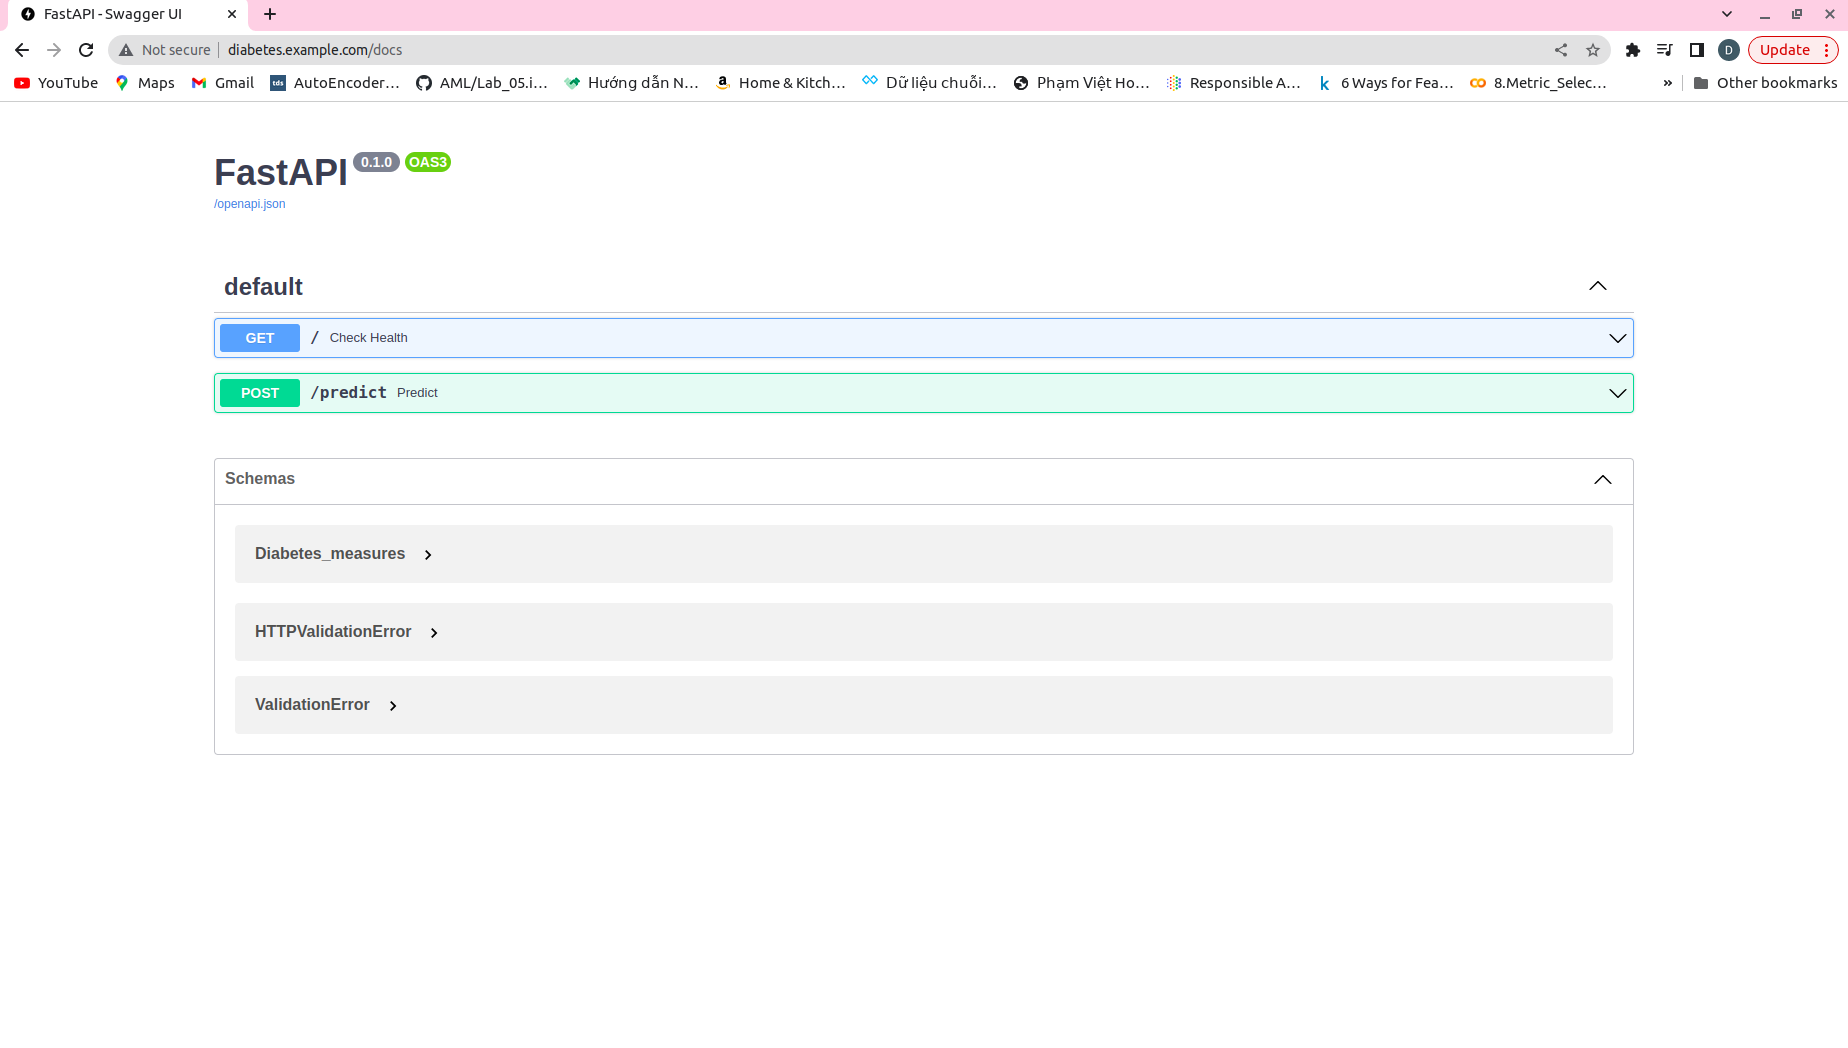
uvicorn main:app --host 0.0.0.0 --port 4001 --reloadordocker pull dunghoang99/diabete-prediction-api:latest && docker run -p 4001:4001 dunghoang99/diabete-prediction-api:latestngrok http 4001- After that, you can get this to address (in my case is https://6207-171-232-89-217.ngrok-free.app, this address will be generated random) to access the service

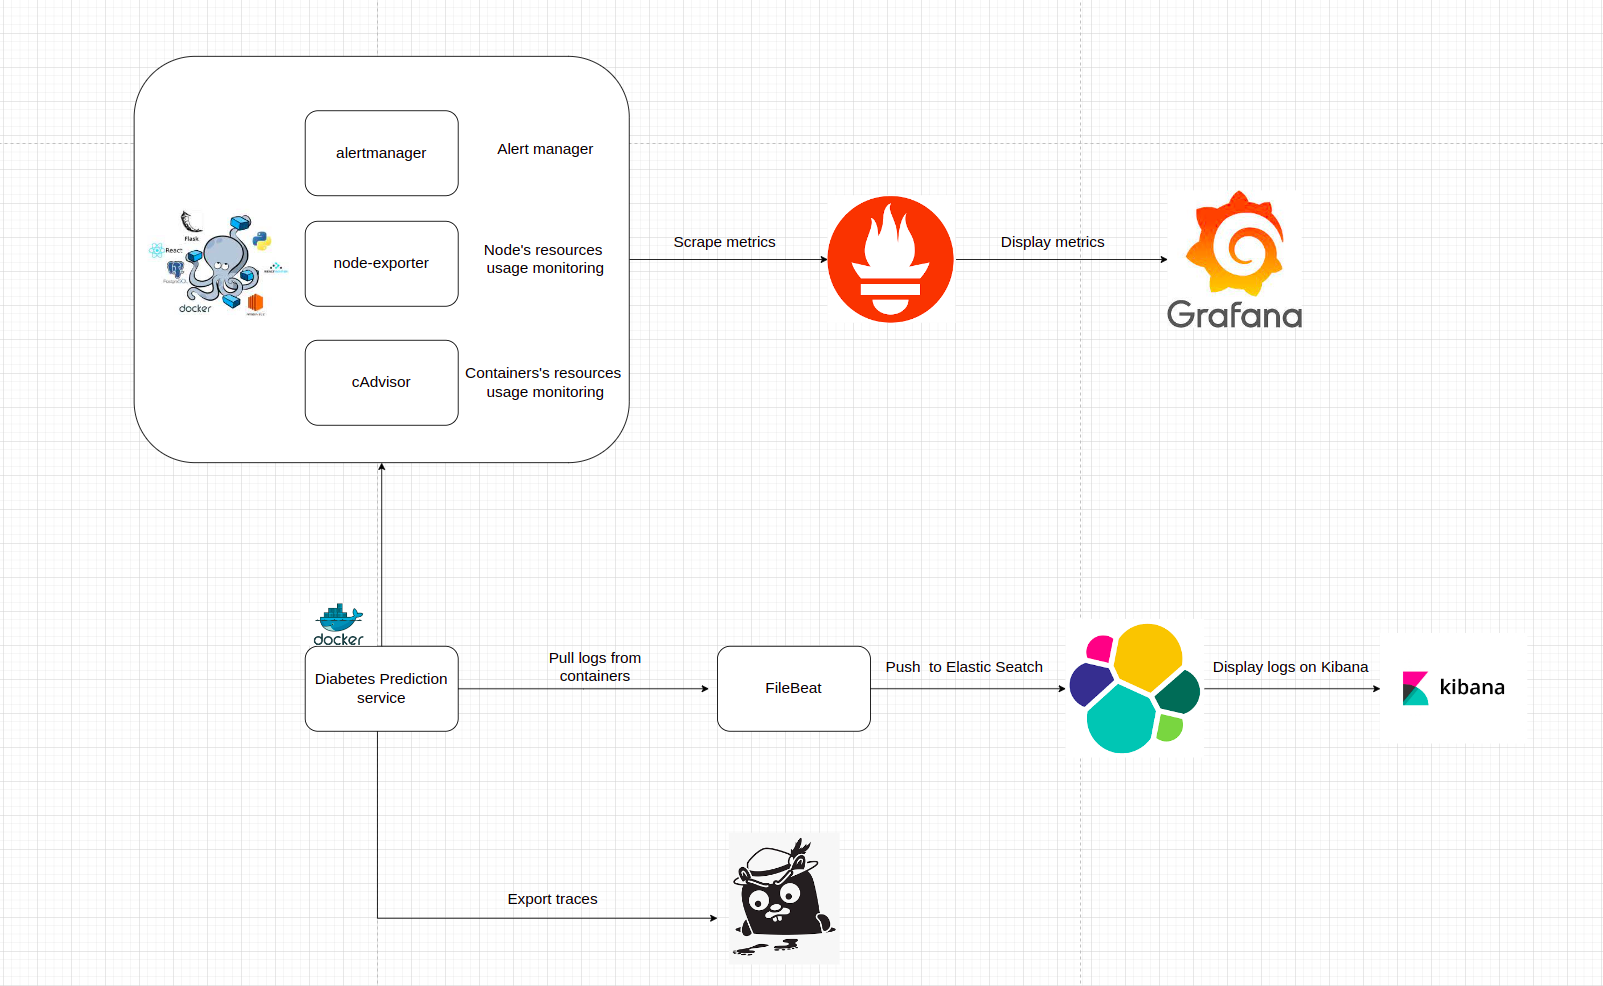
When we have a service, we need some observable systems to monitoring our service. In this repo, we suggest Elastic Search, Grafana, Prometheus and Jaeger.
cd monitoring_docker/elkdocker compose -f elk-docker-compose.yml -f extensions/filebeat/filebeat-compose.yml up -d- You can access kibana at port 5601 to search logs, which FileBeat pulls logs from containers and pushes to ElasticSearch. Username and password of Kibana can be found at
monitoring_docker/elk/.env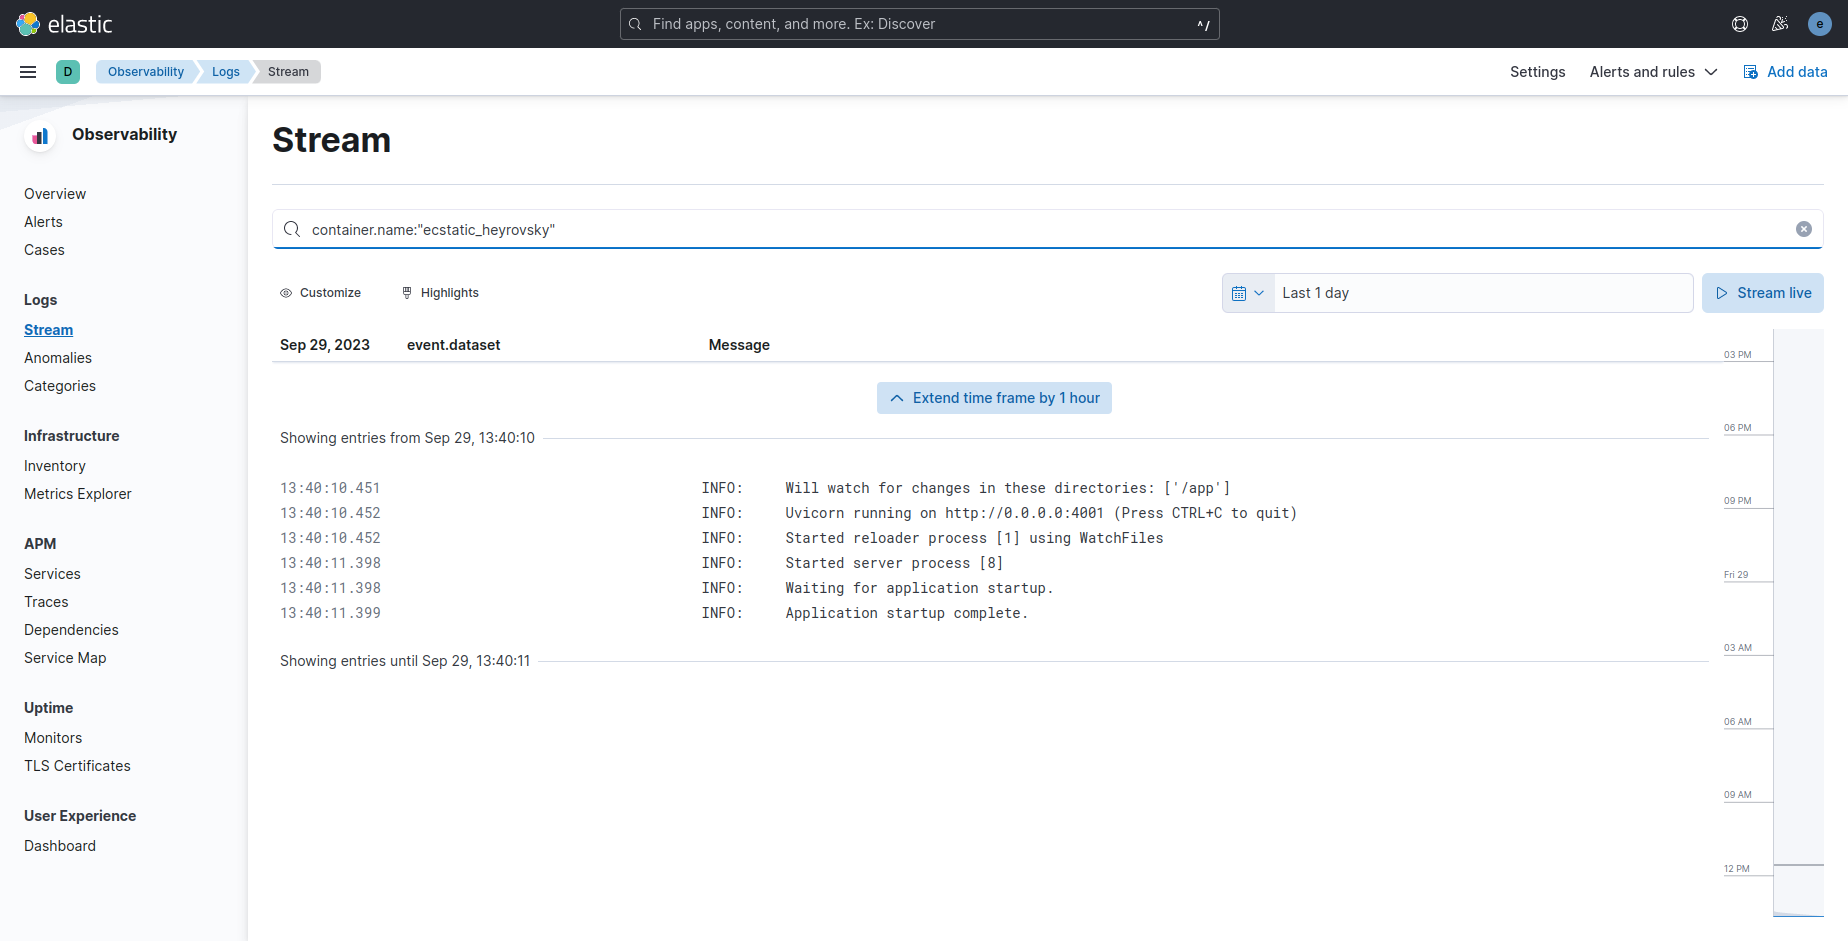
cd monitoring_dockerdocker compose -f prom-graf-docker-compose.yaml up -dpython monitoring_docker/instrument/metrics/metrics.pypython monitoring_docker/instrument/traces/trace_automatic.py- Access to Prometheus, Grafana, Jaeger and enjoy!!!
- Then, you can access Prometheus at port 9090, Grafana at 3001 and Jaeger at 16686. Username and password of Grafana is admin.
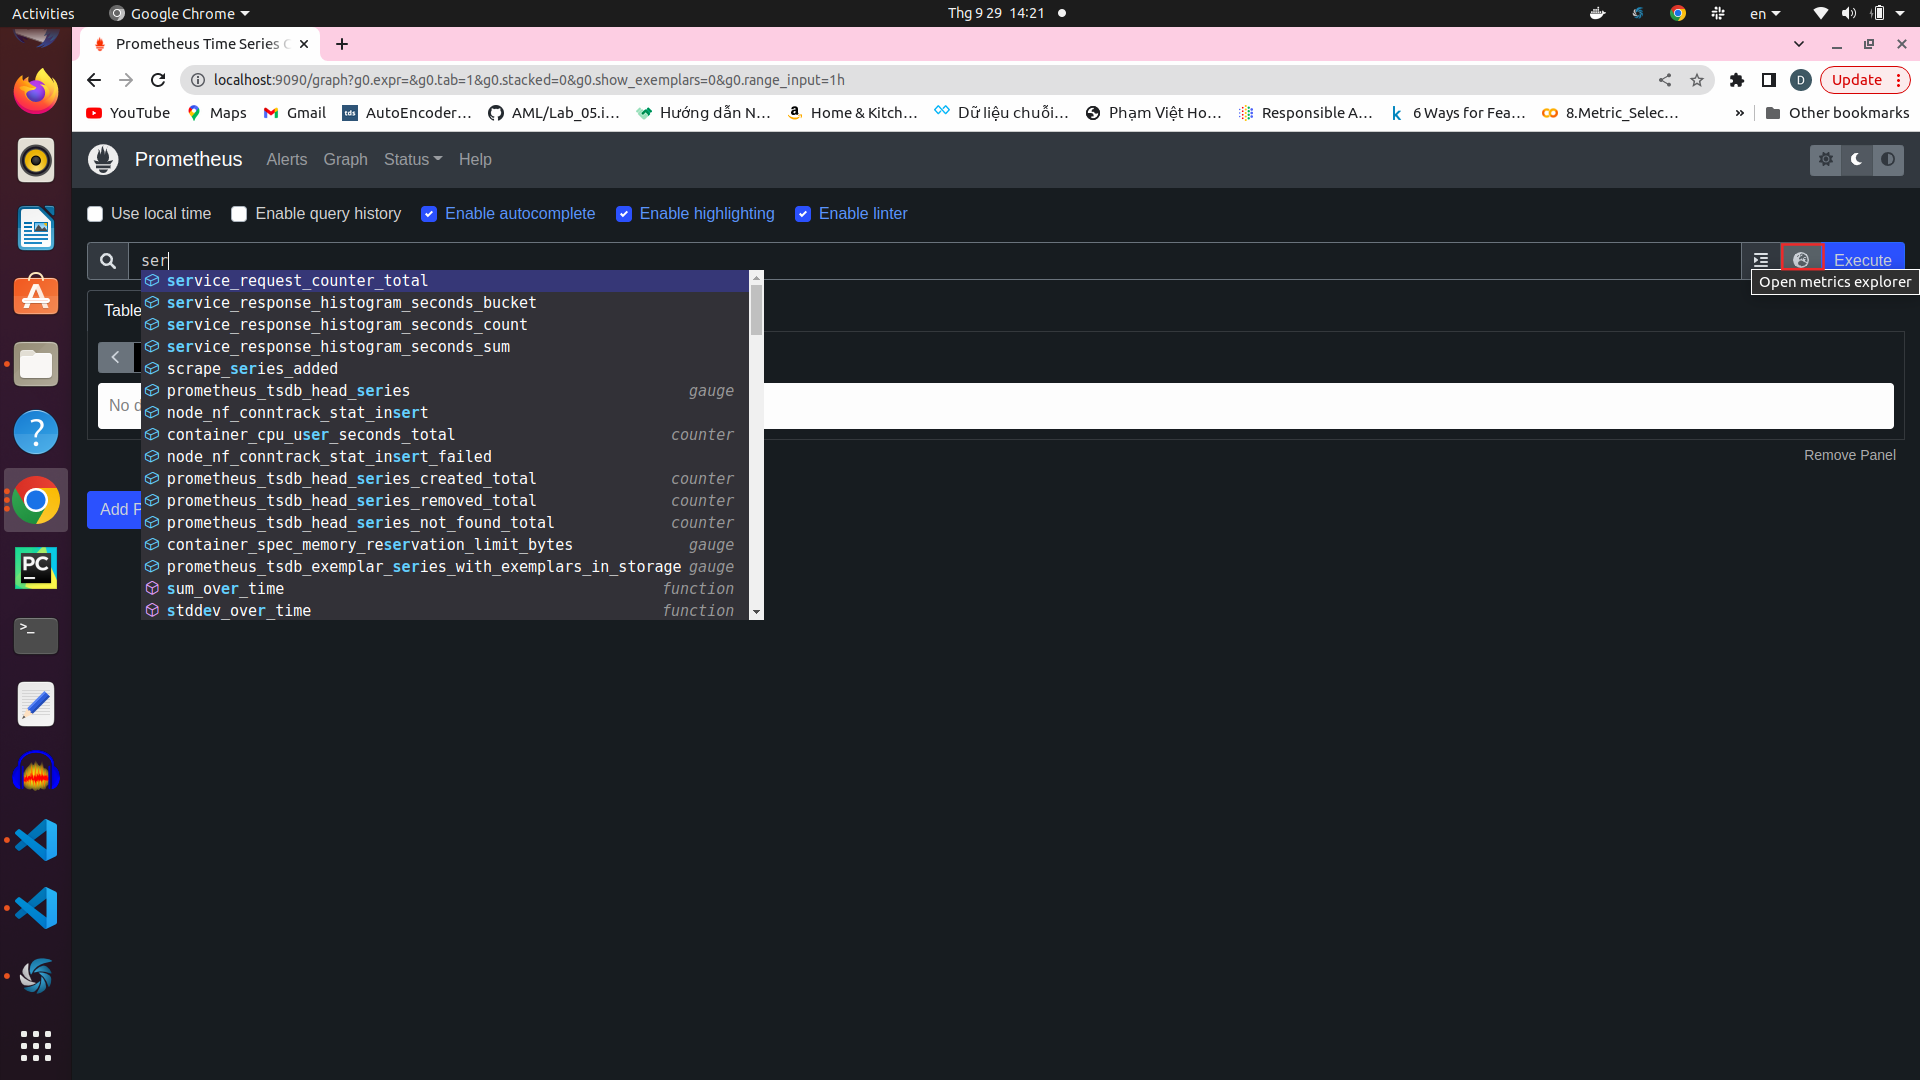
- In Prometheus UI, you can search any metrics what you want to monitor and click on the button that i highlighted border to list all metrics prometheus scraping
When you access to Grafana, you can create your own dashboard to monitoring or use a template on Grafana Labs
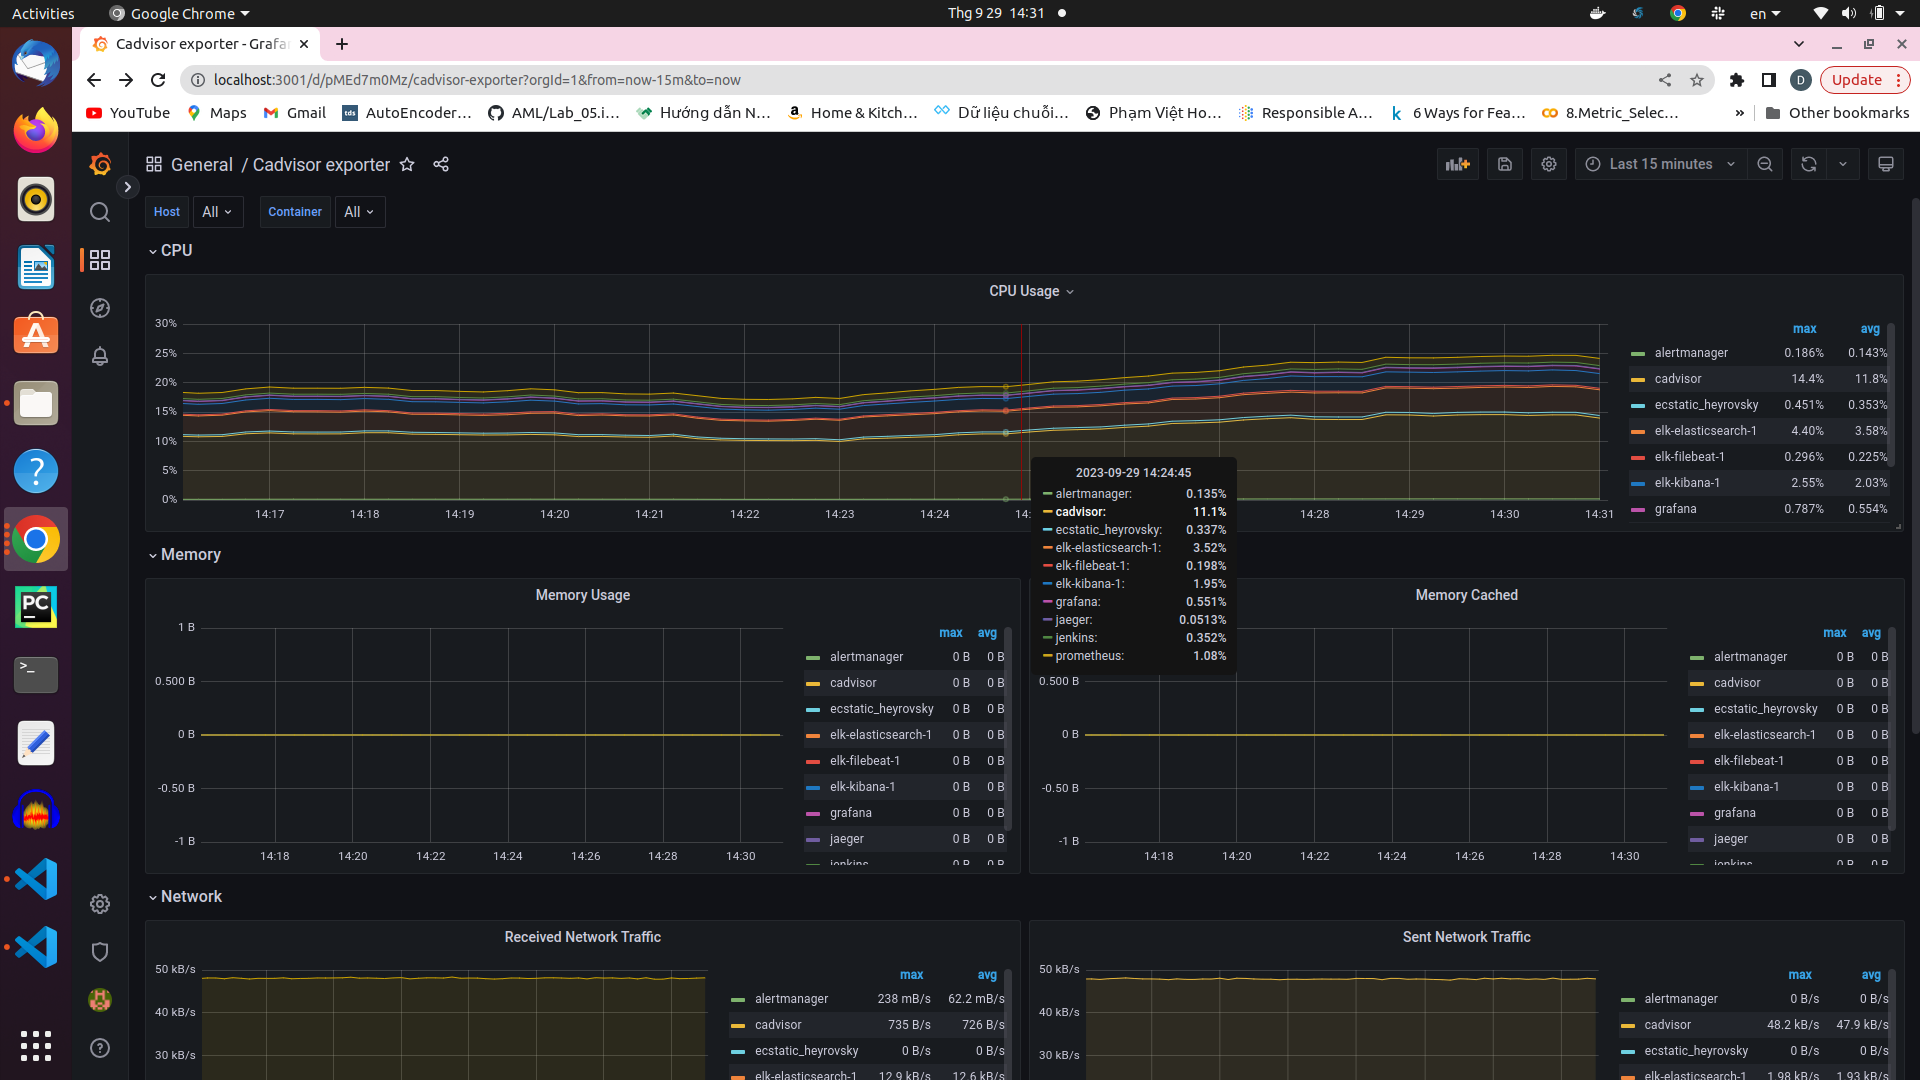 This is a dashboard for cadvisor that i pull from Grafana Labs, you can monitoring CPU Usage of each container as well as Memory Usage, Memory cached, etc ... All information was queried from Prometheus.
Besides, you can monitor node's resource usage and application on your own as i did below.
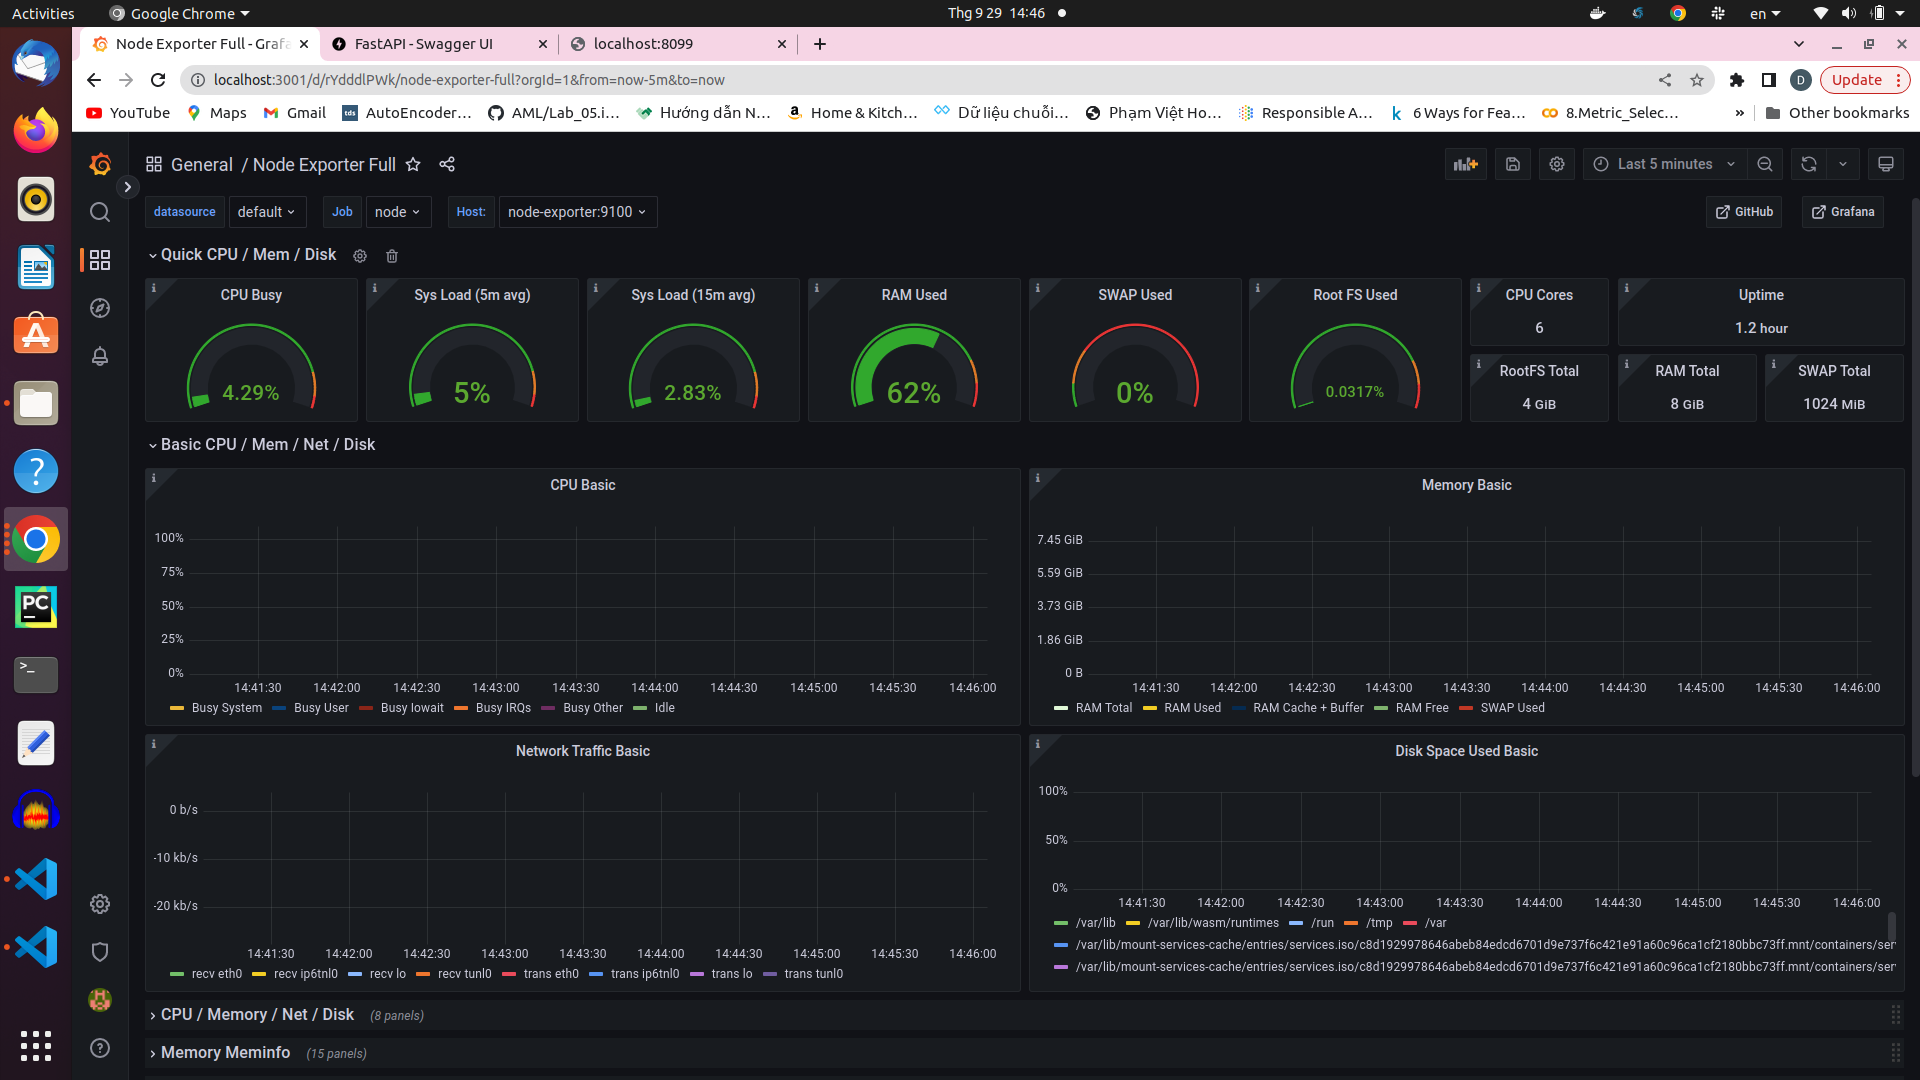
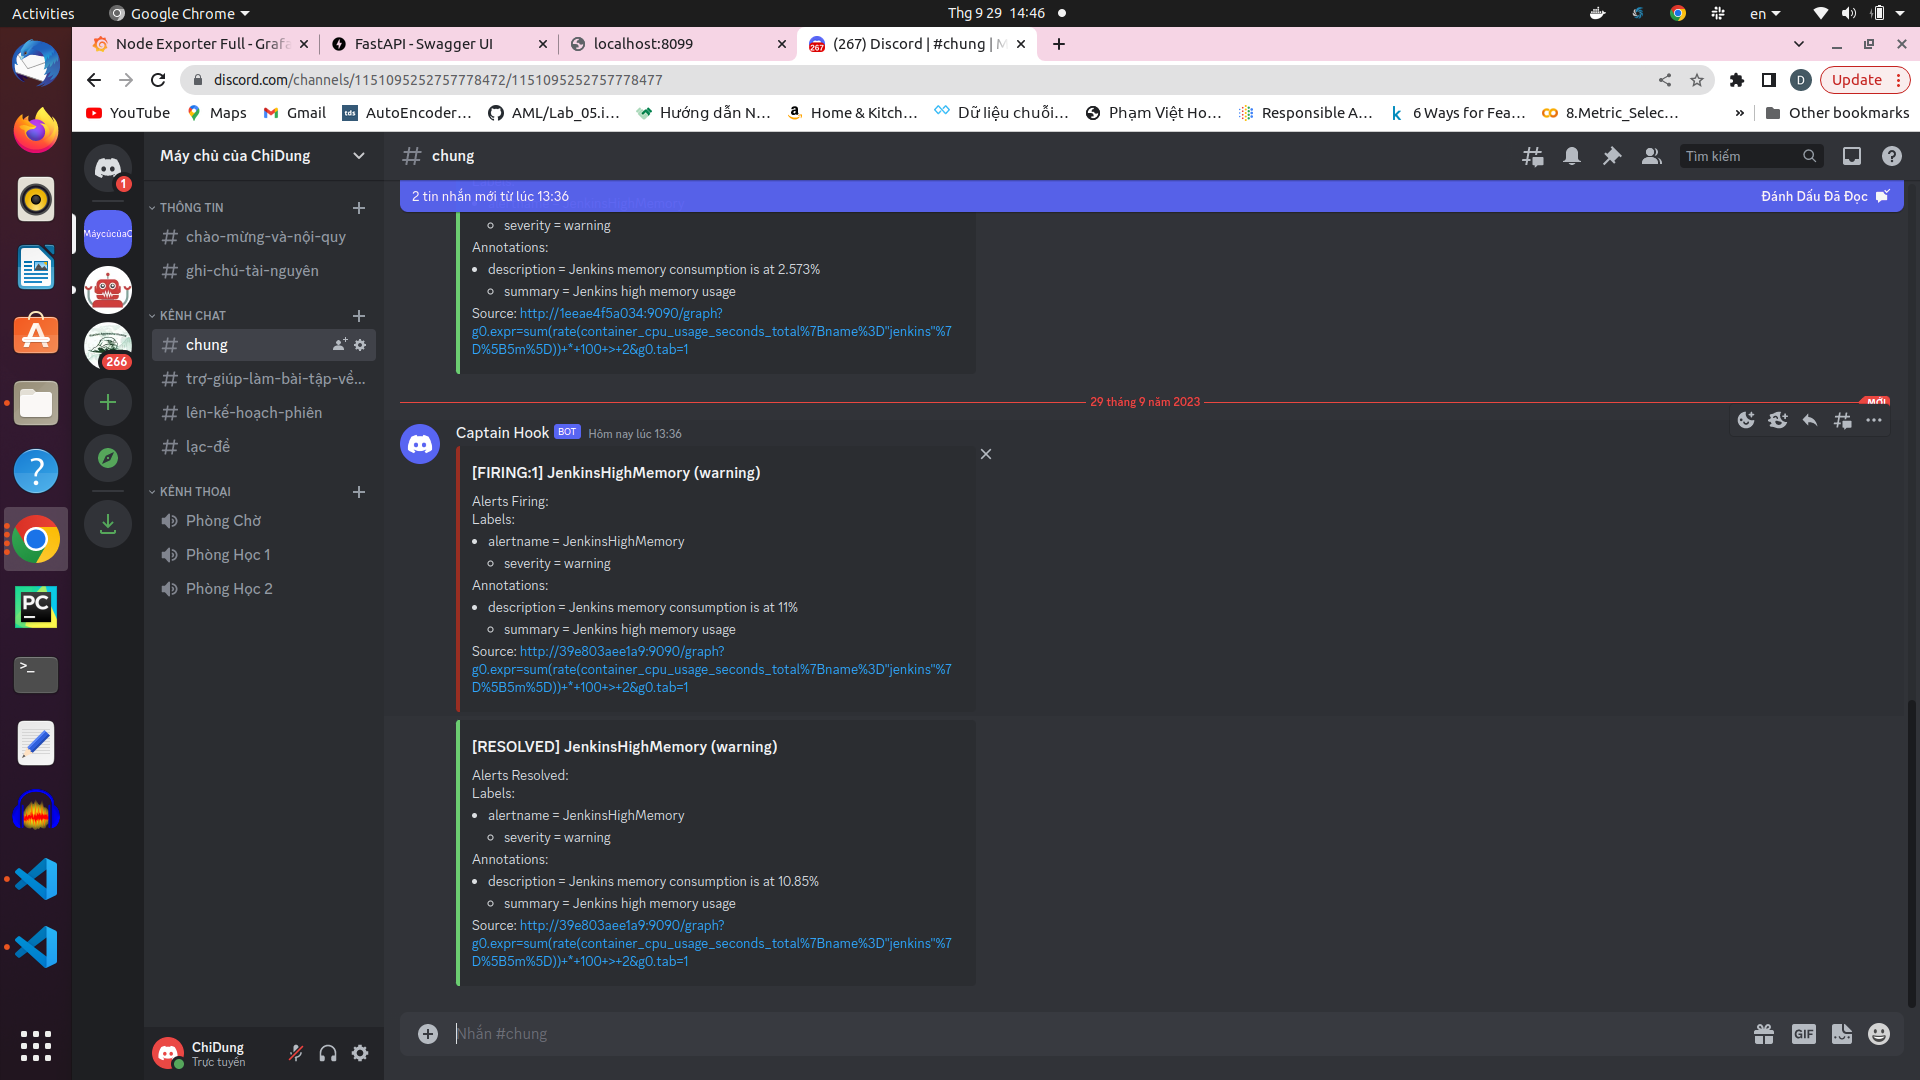
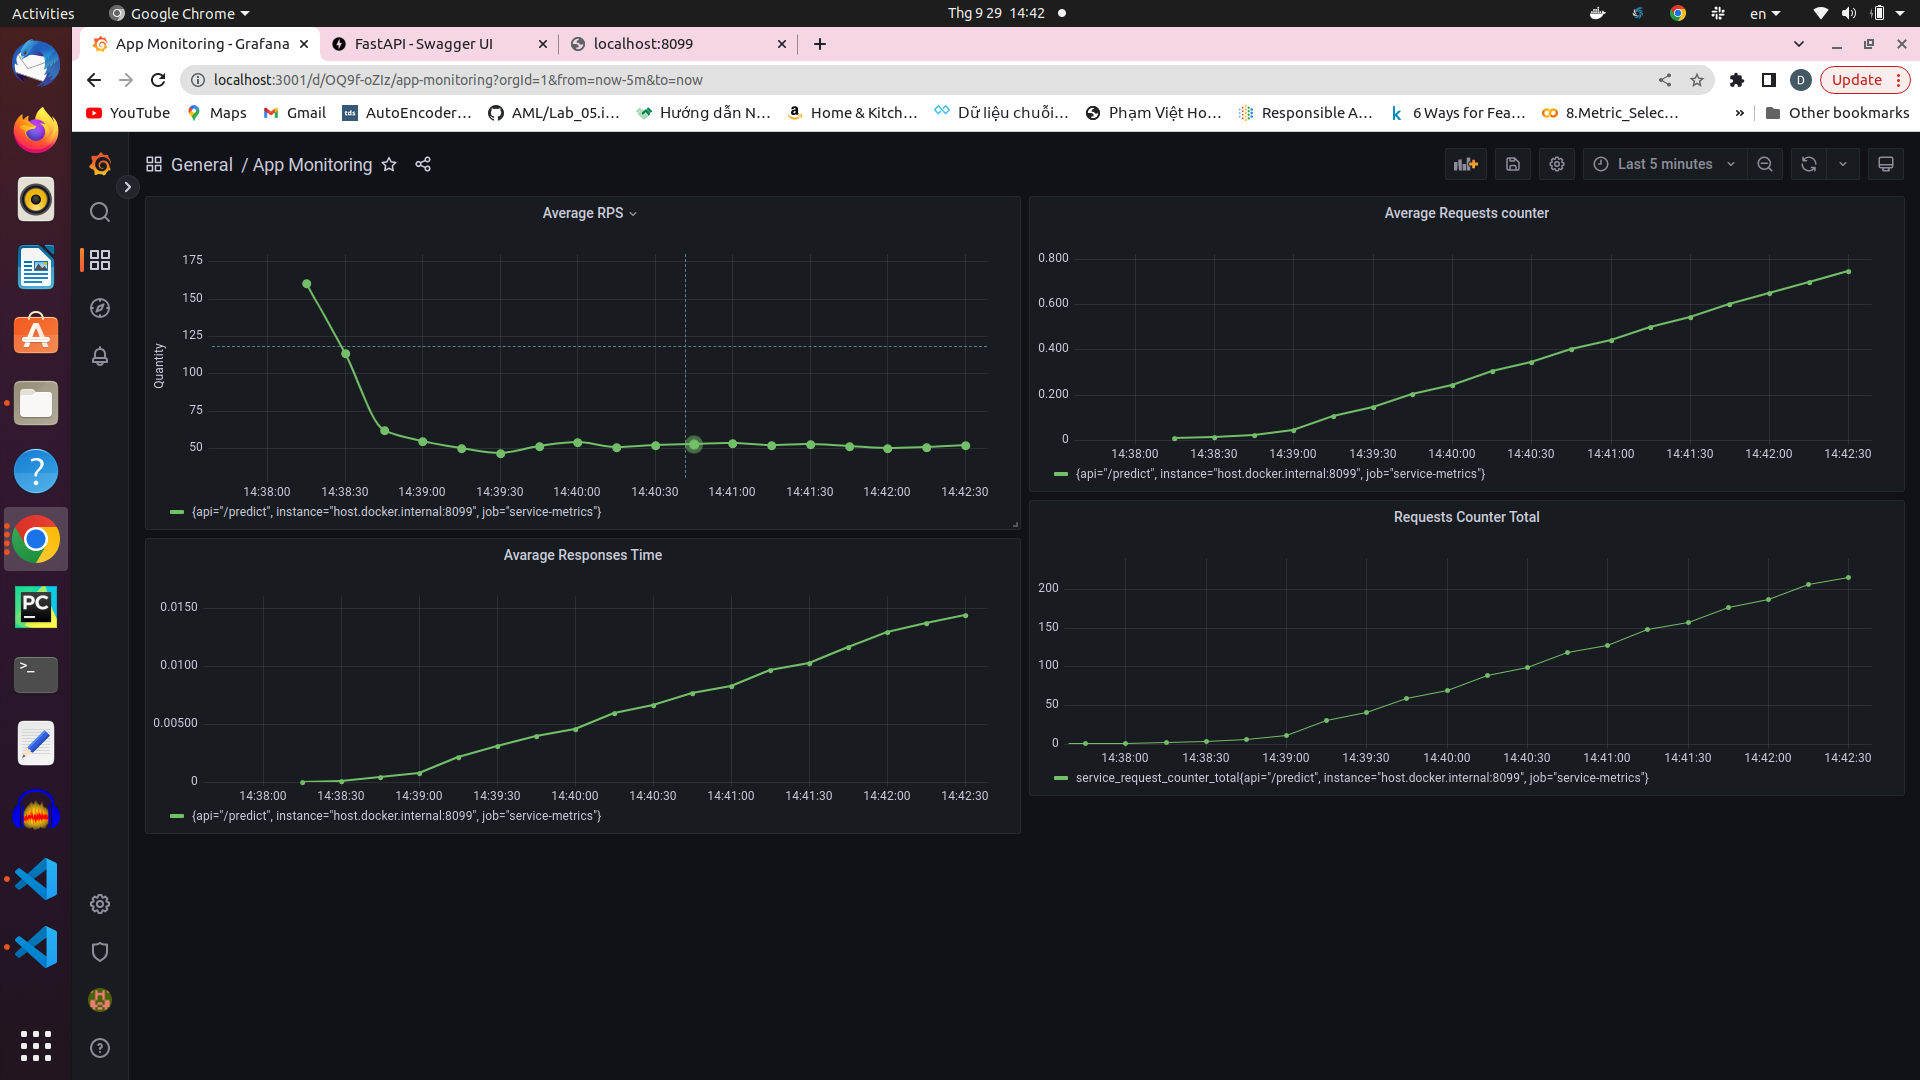 Throughout monitoring resources, you can set alerting rule for Alert-Manager to warning whenever resources usage is exceed some predefined alerting rule.
Alerting rule and webhook you can define in
 alertmanager/config.yml. In my repo, whenever avalable memory of node is smaller than 5% and cpu usage of jenkins container is greater than 2%, Alert-Manager will send warning to my discord.
Last but not least, sometimes you need to trace some block code processing time, Jaeger will help you do that.
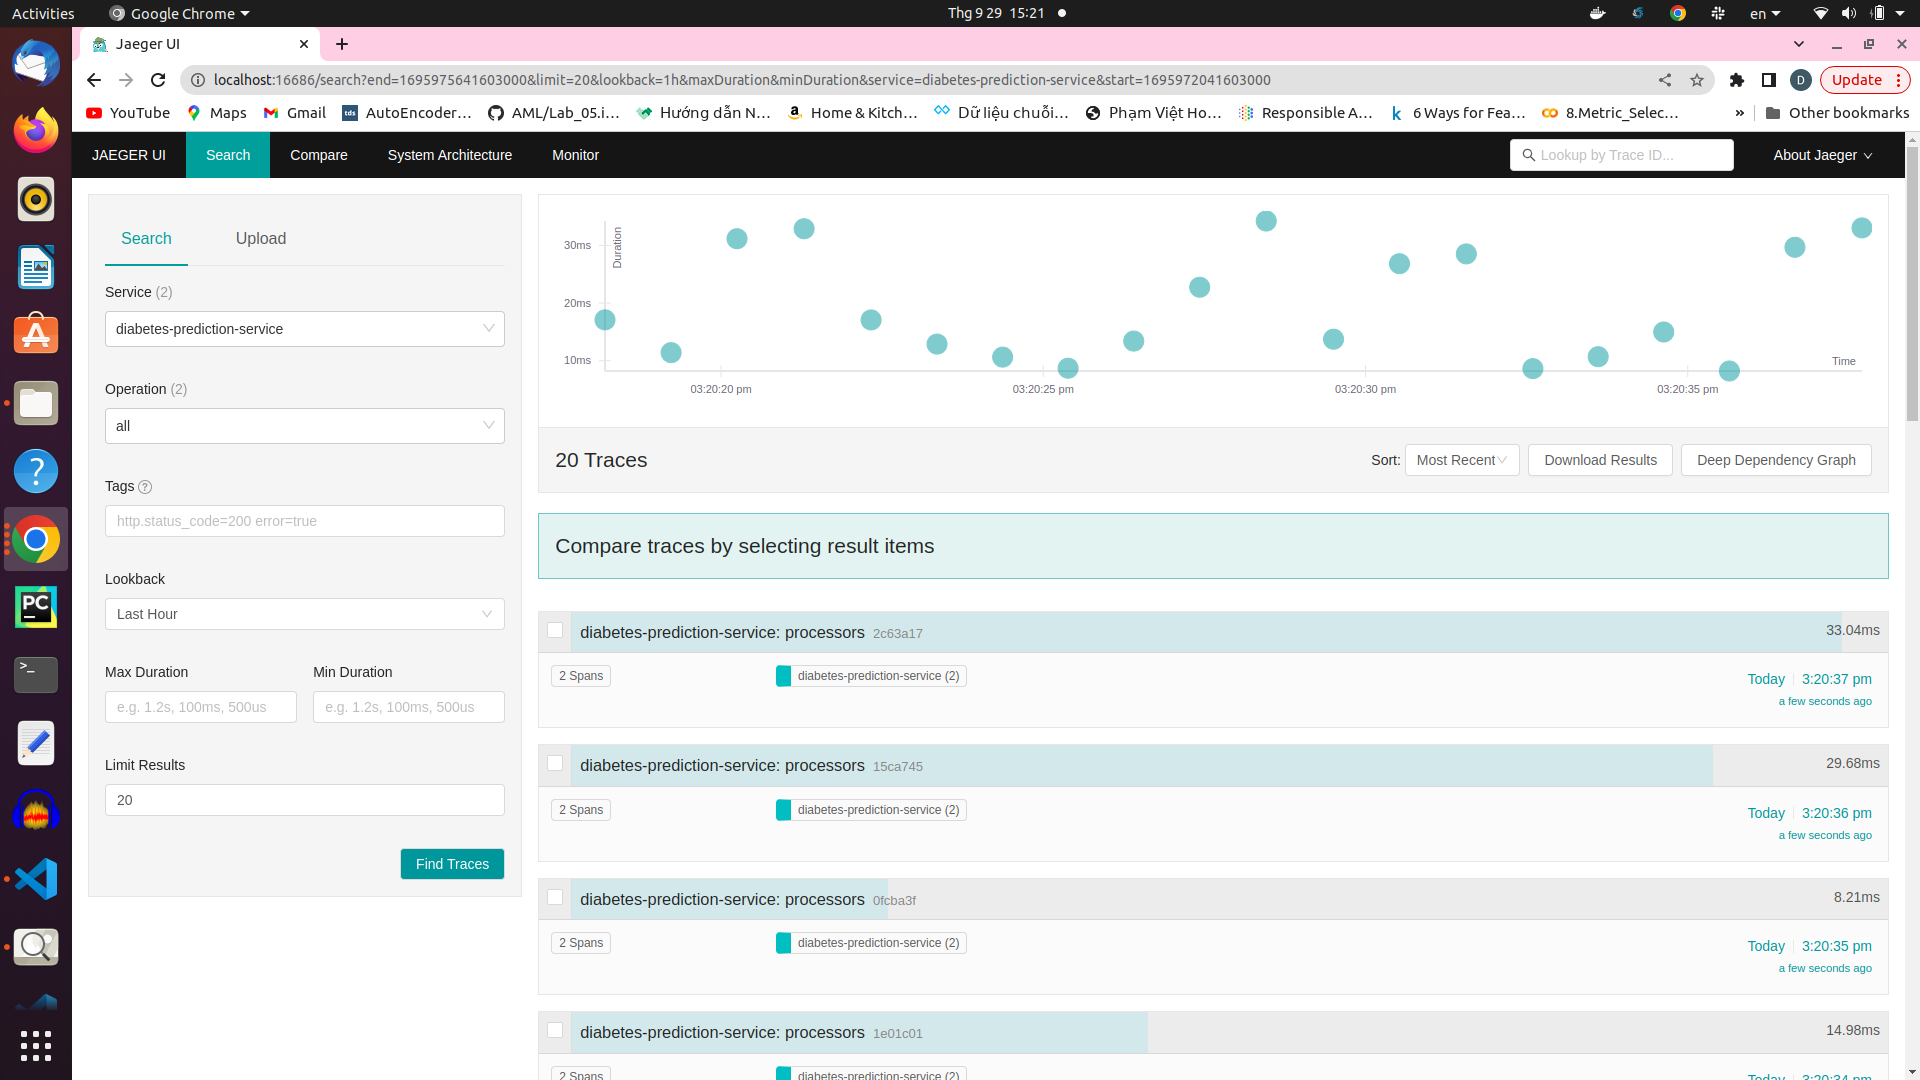 In Jaeger UI, all block code that you want to trace time will be displayed on right hand sides.
-
docker compose -f jenkins_docker/docker-compose.yml up -d -
Jenkins service was exposed at port 8081, we can access by this port
-
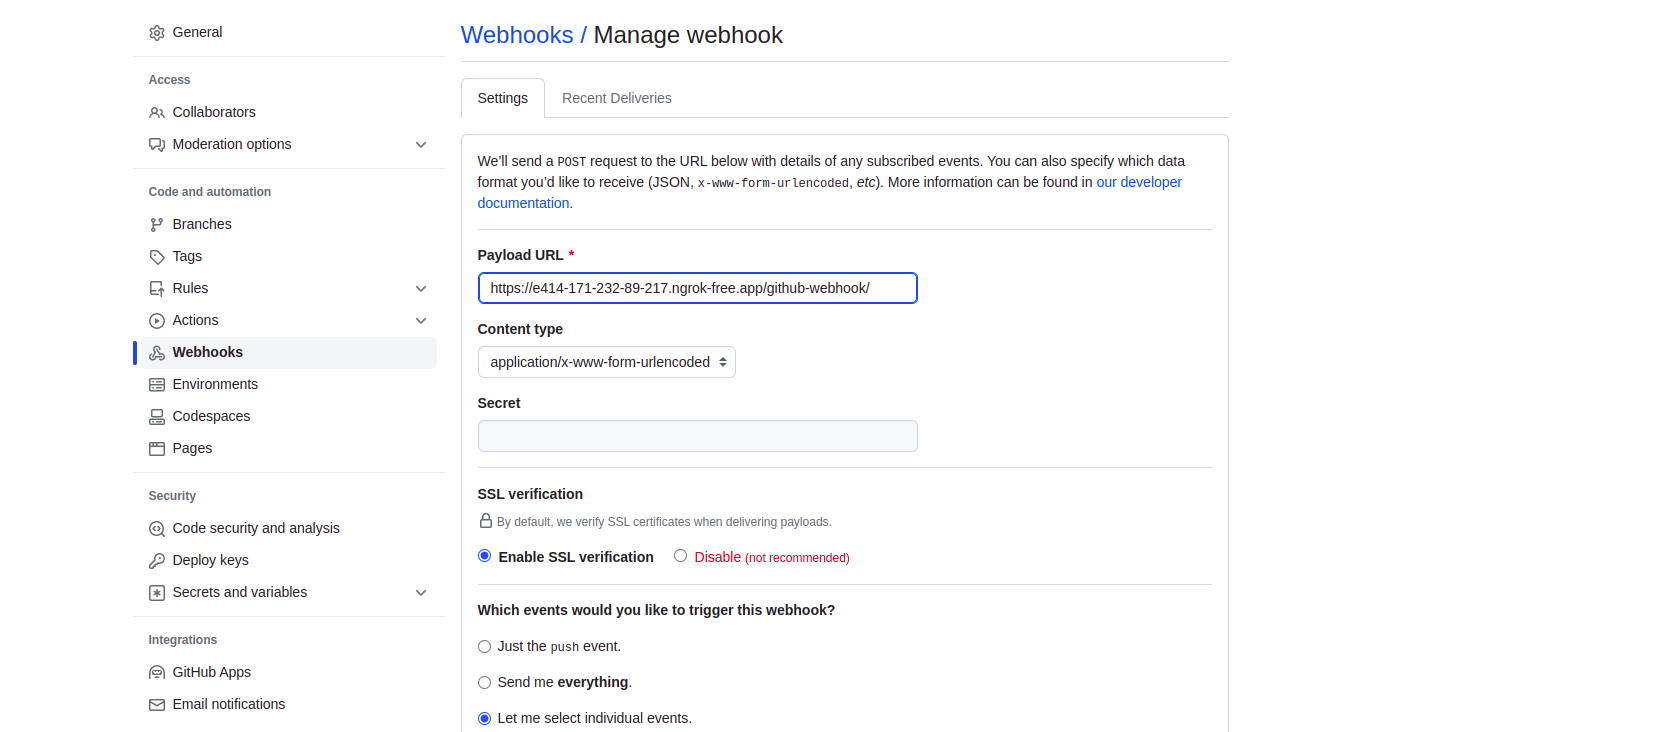
Connect to github repo using ngrok. if 200 OK, you have already connect jenkins to github.
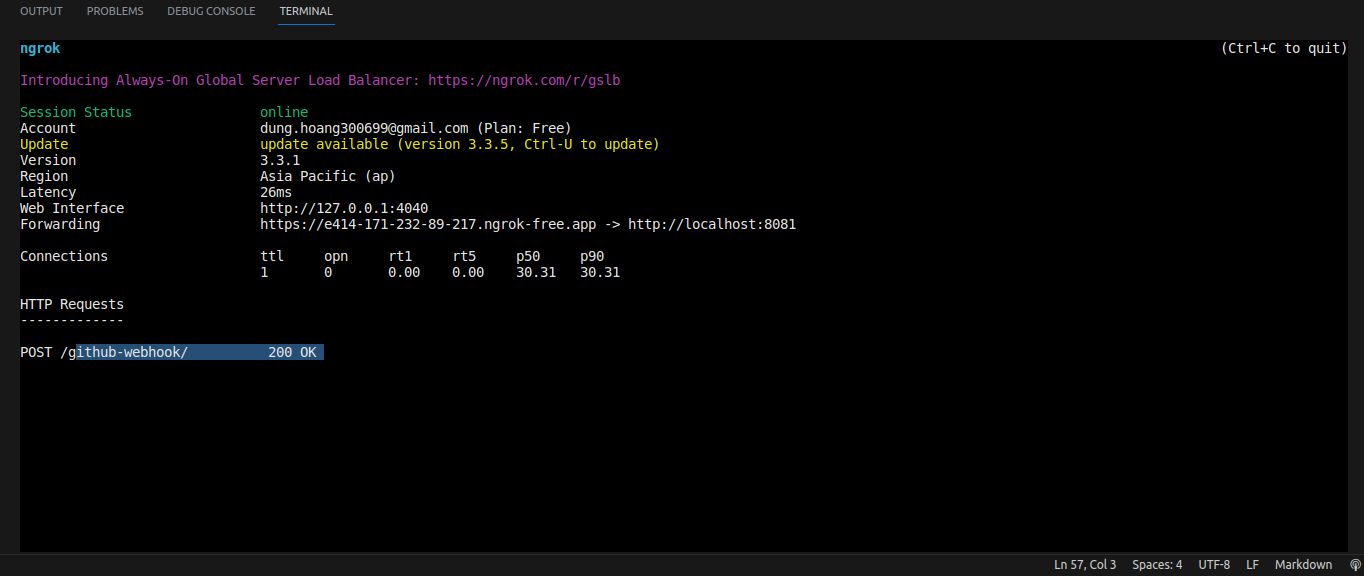
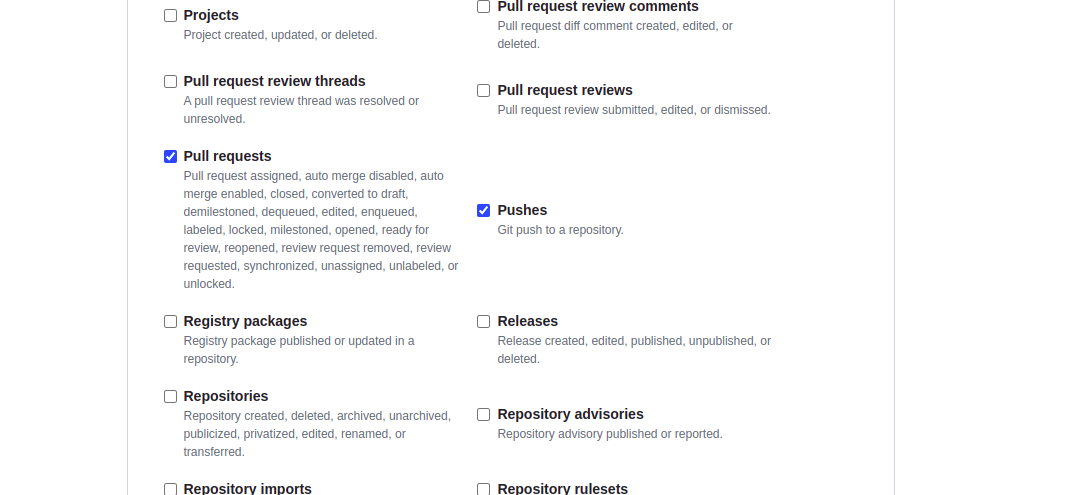
Additionally, in Let me select individual events in Setting/Webhooks/Manage webhook, tick Pull requests and Pushes to inform jenkins start to run whenever we push or pull code from github.
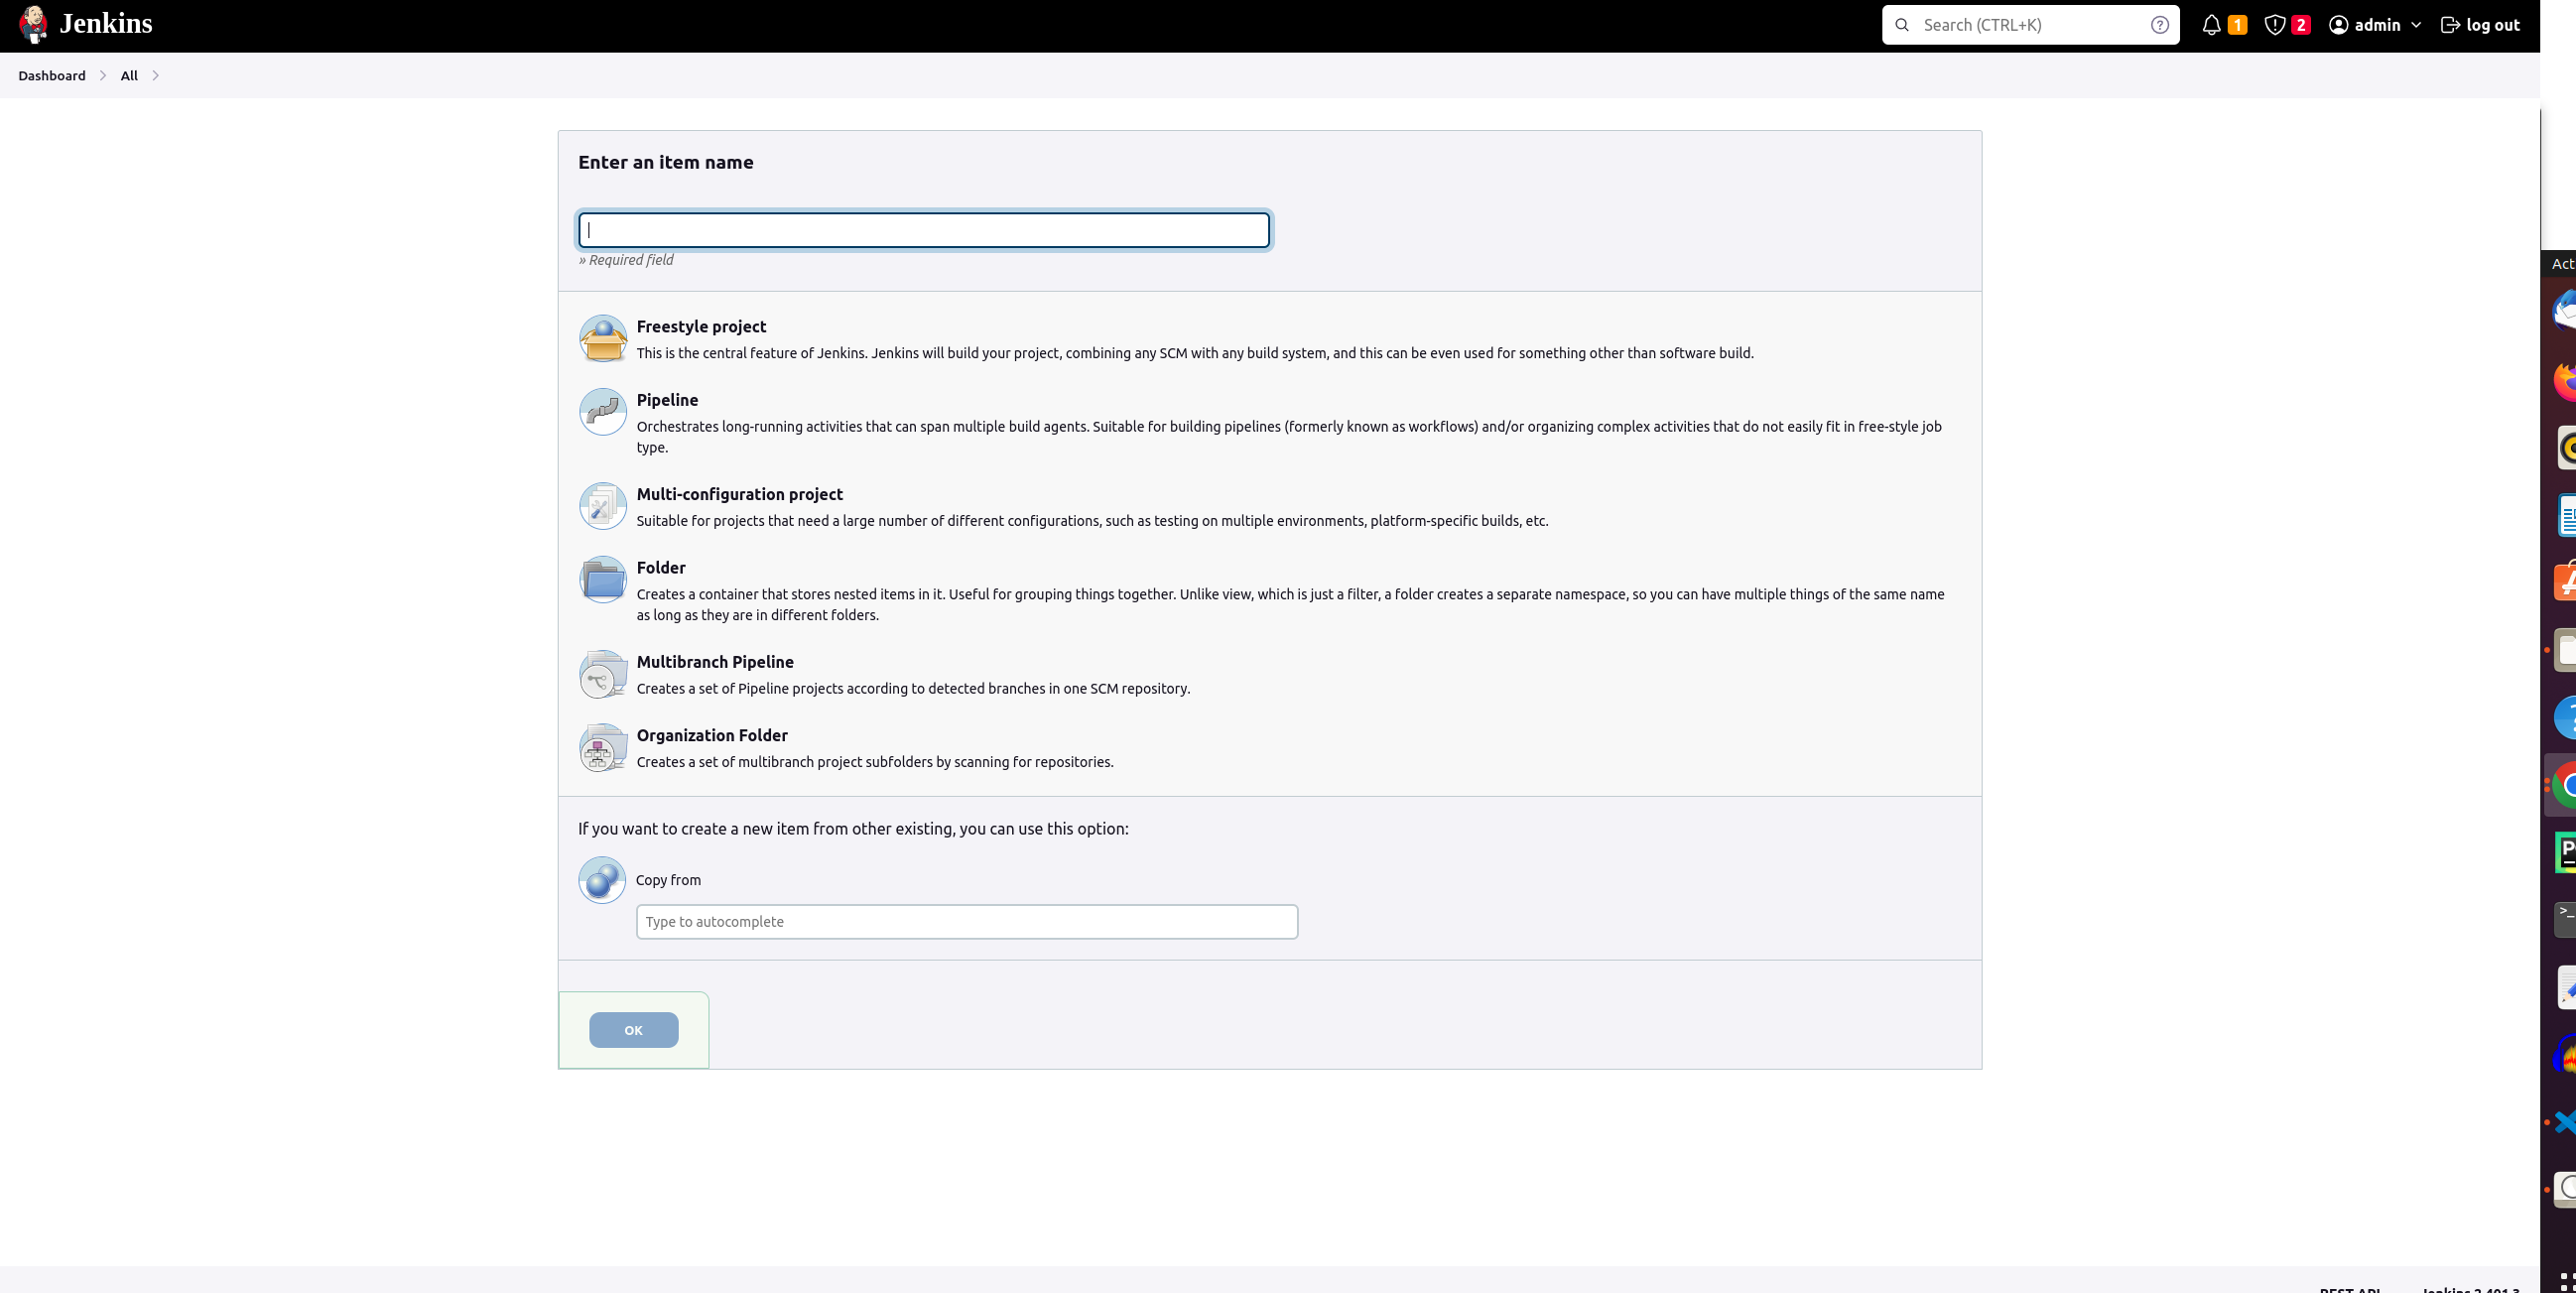
- Access to Jenkins, click New Item to create new Multibranch Pipeline
- In Configuration/Branch Sources, choose GitHub in Add source
- Then click Add, choose multibranch pipeline has created to configure github account
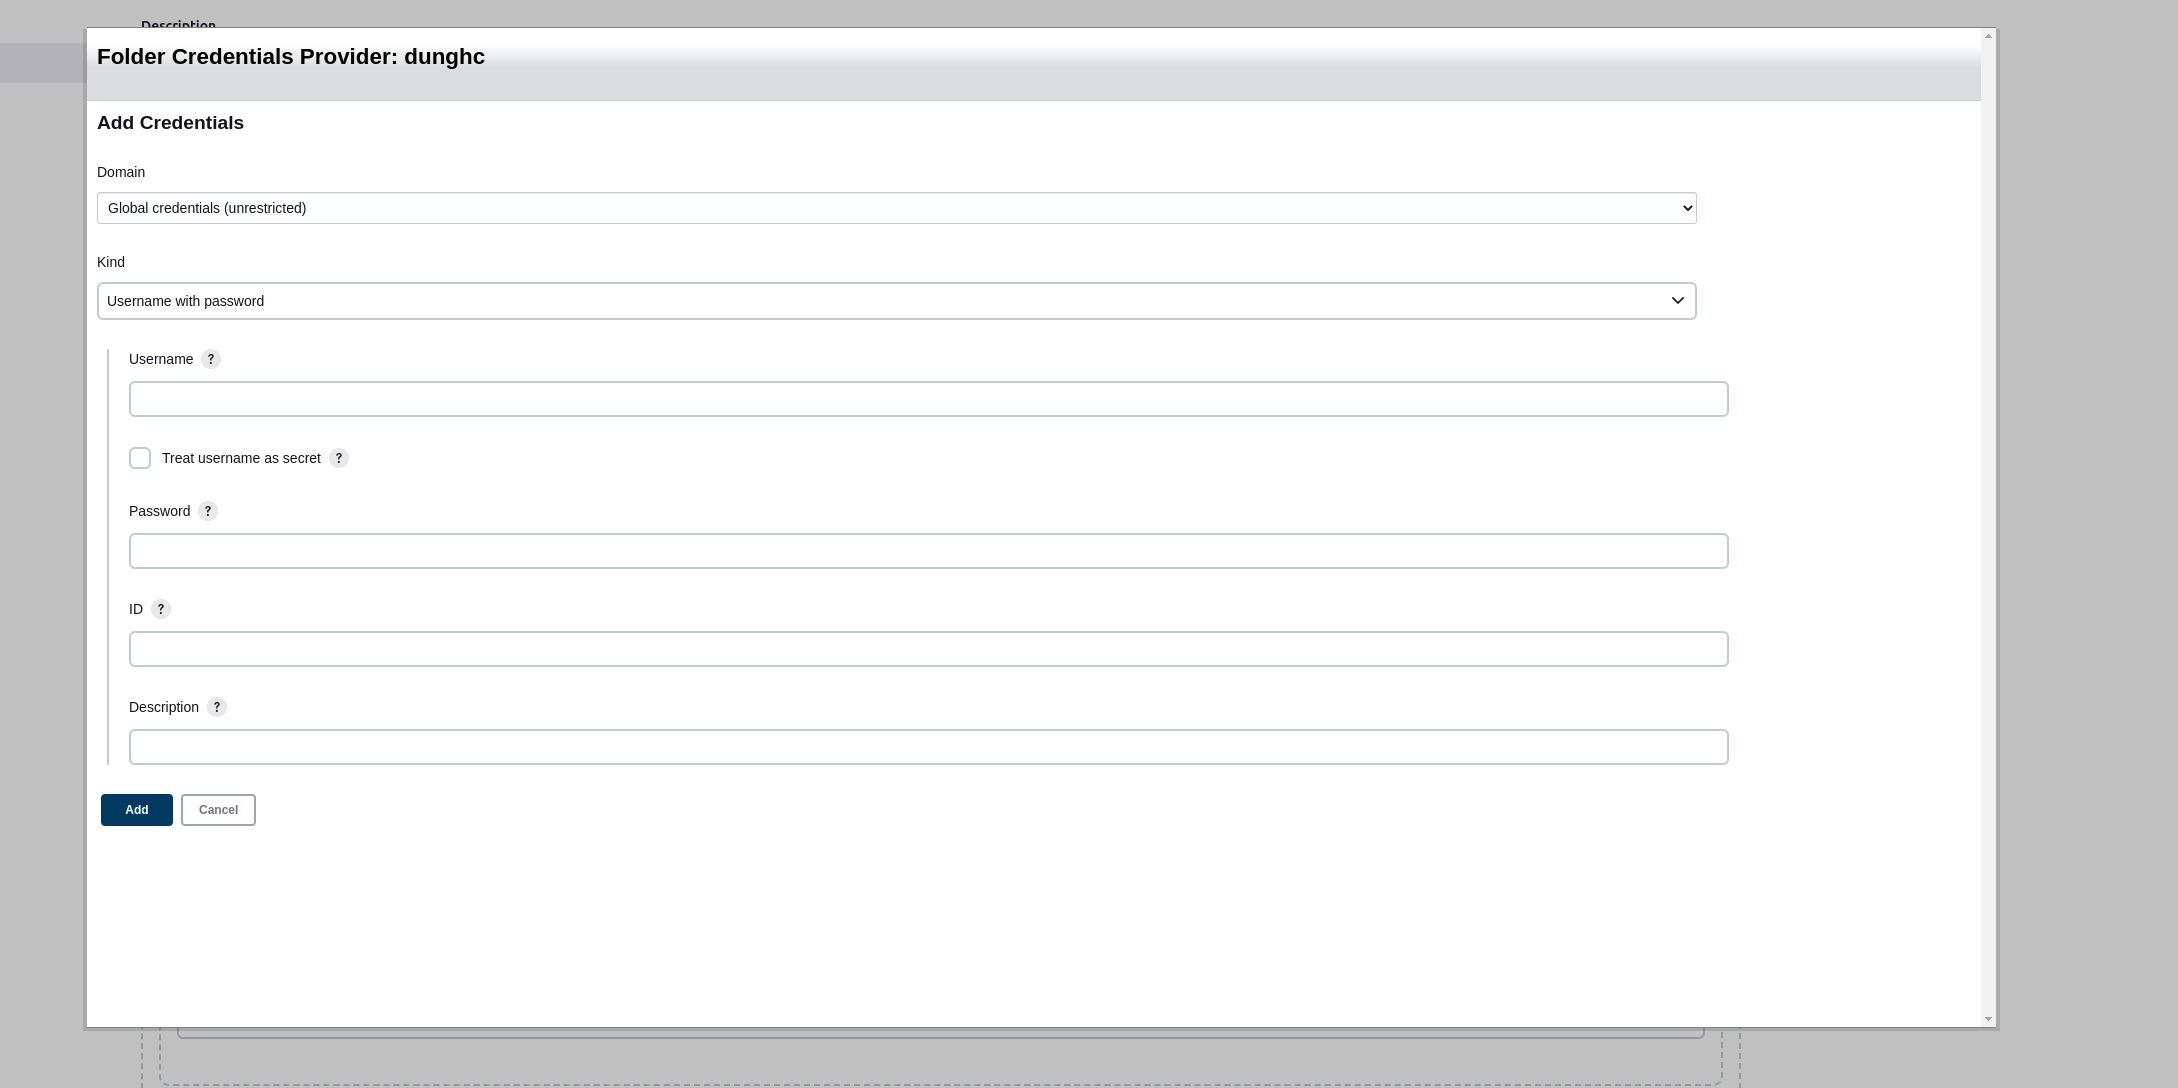
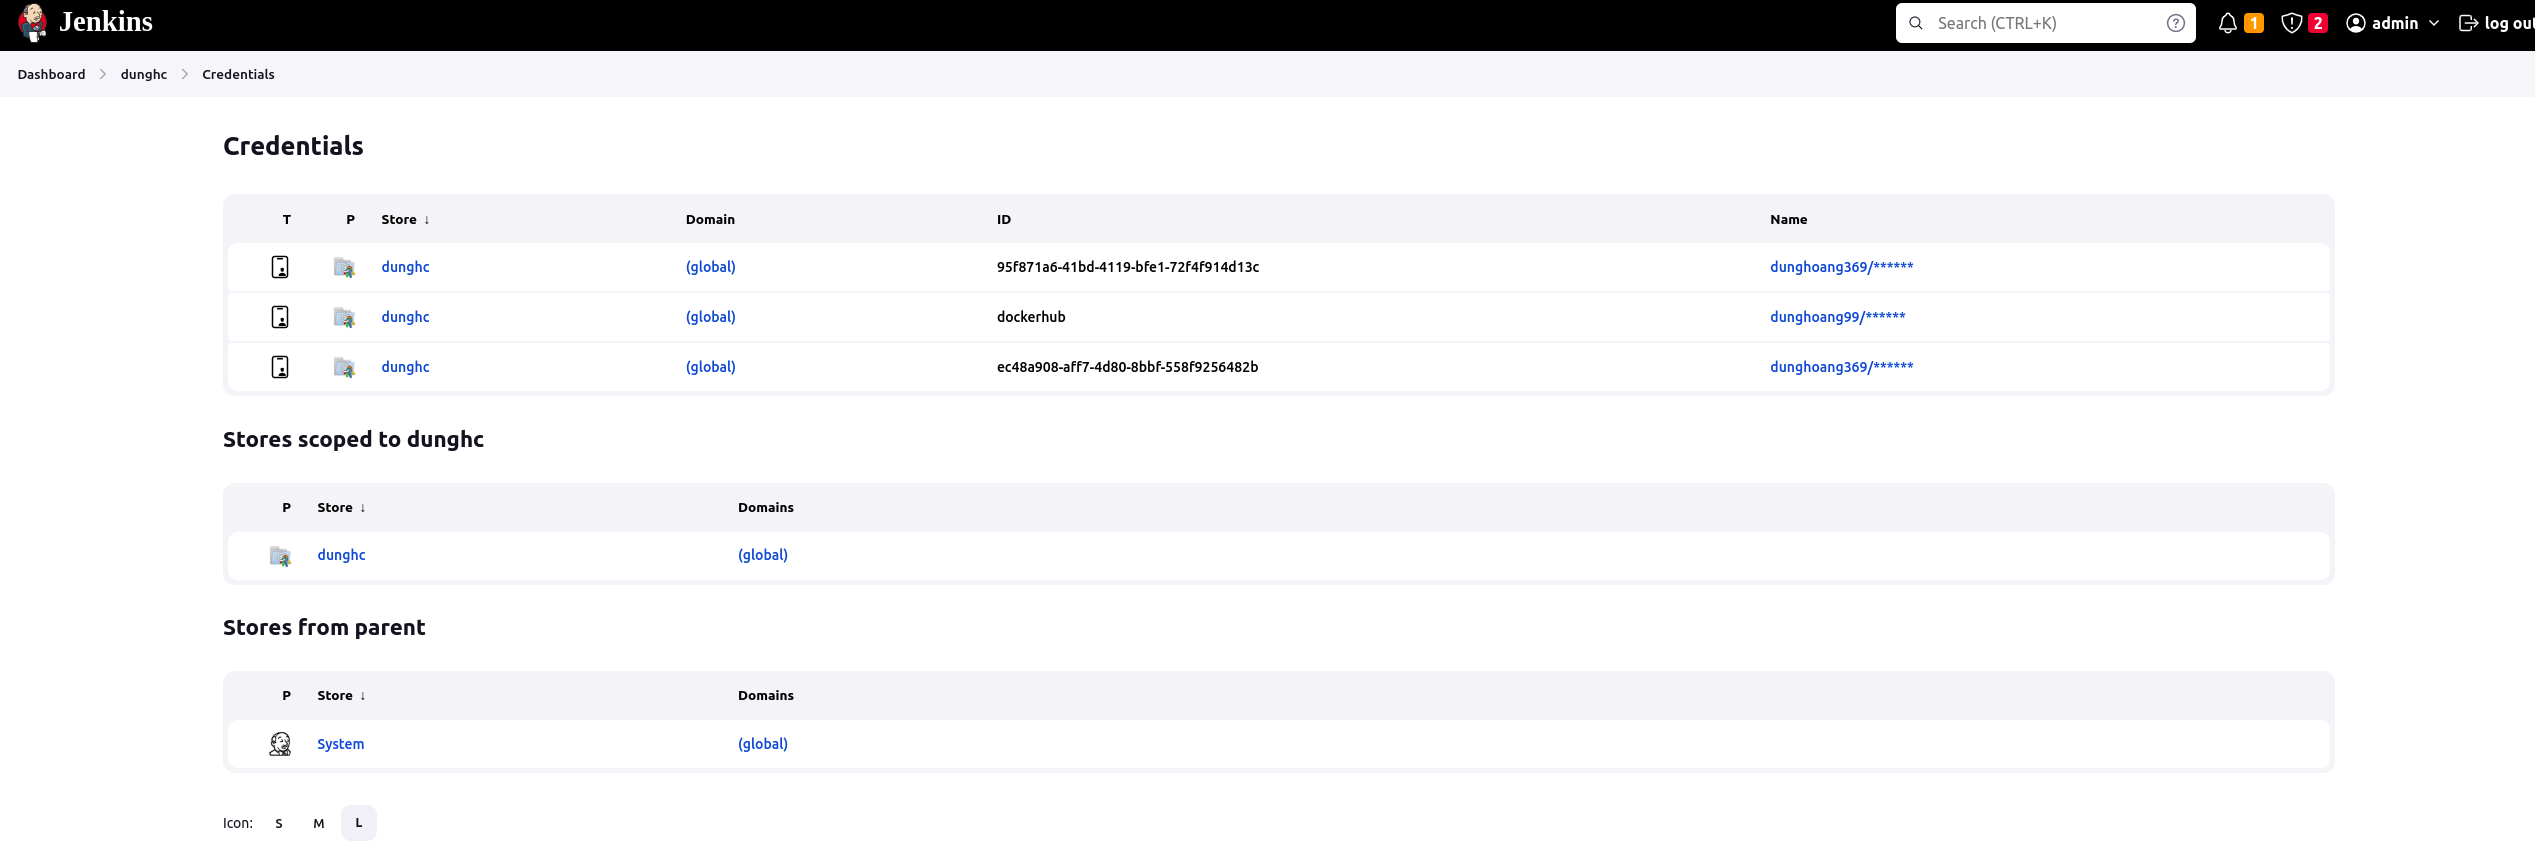
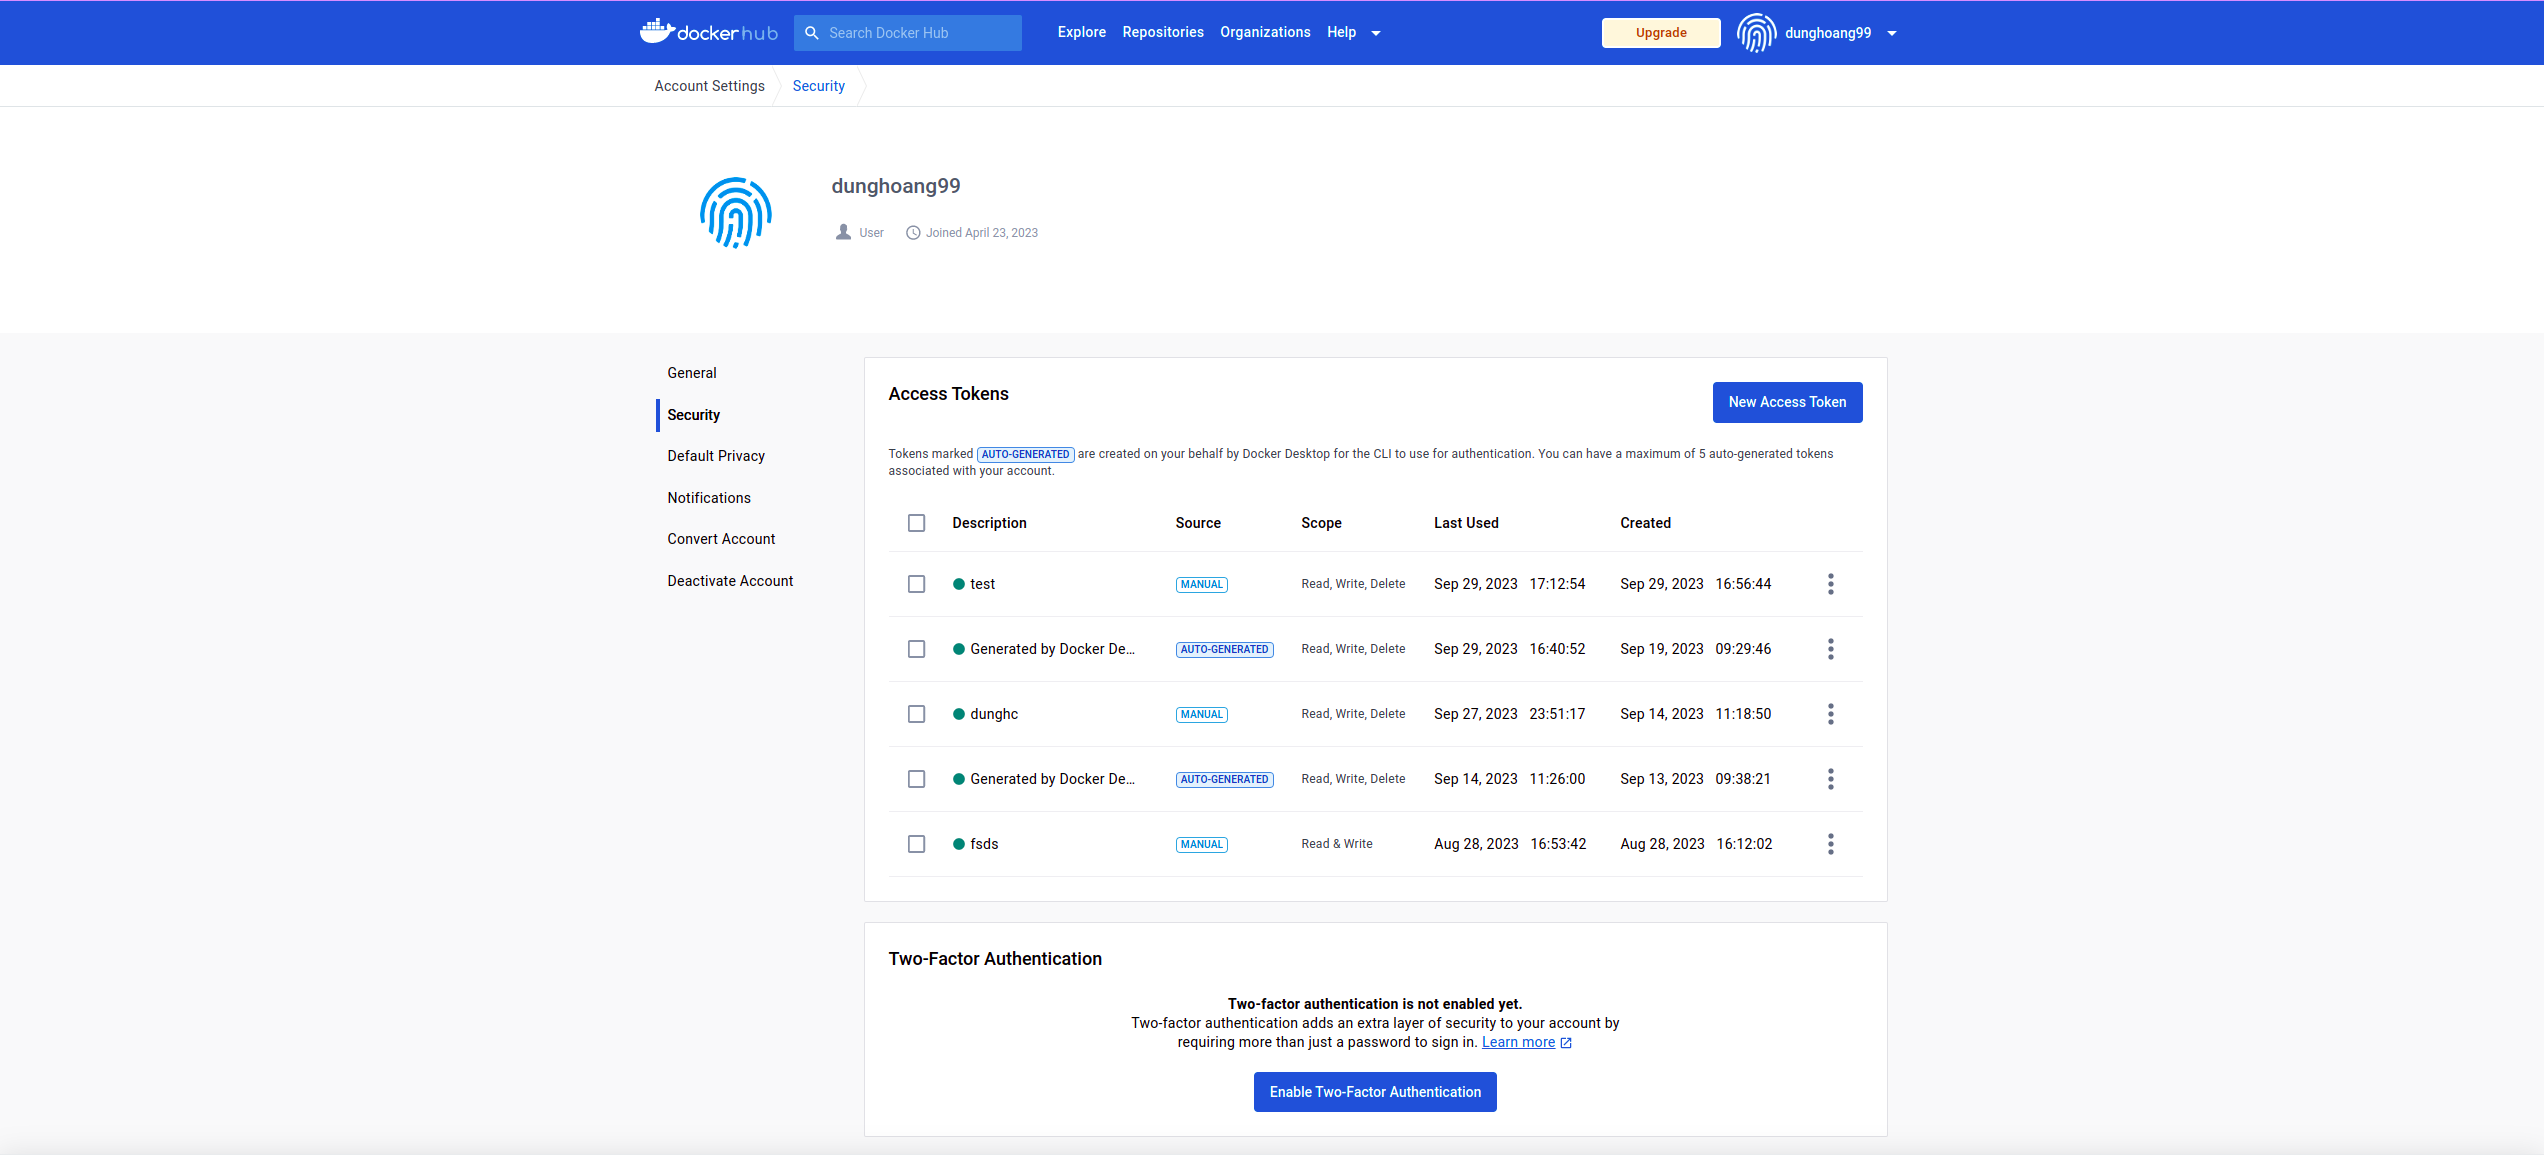
- After that, in Credentials, click global in Stores scoped, then click Add Credentials to add Docker Hub account.
Username is username of docker hub and password that we set in docker hub.
-
Whenever code is push to github or pull from github, Jenkins will take care all of this
-
Enjoy achivement!!!
- Before moving on to the next section, you need to have an active Google Cloud Platform account, install gcloud CLI according to this link https://cloud.google.com/sdk/docs/install#deb, authenticate with GCP by using this command
gcloud auth application-default loginand create service account file by using this file pdf_files/Prepare_ansible.pdf for later used by ansible
-
cd ansible/deploy_jenkins -
ansible-playbook create_compute_instance.yamlto create virtual machine instance using ansible. Configuration of machine was defined in file create_compute_instance.yaml -
ansible-playbook -i ../inventory deploy_jenkins.ymlto install jenkins. Note, ip addresses in inventory file need to be modified to suitable with external address of nodes at that time. -
From diabetes_prediction folder,
cd terraform -
terraform init -
terraform plan -
terraform apply. Note, GKE was created by terraform will be in autopilot mode. -
Jenkins configuration is silimar with section Jenkins above but need to change webhooks by
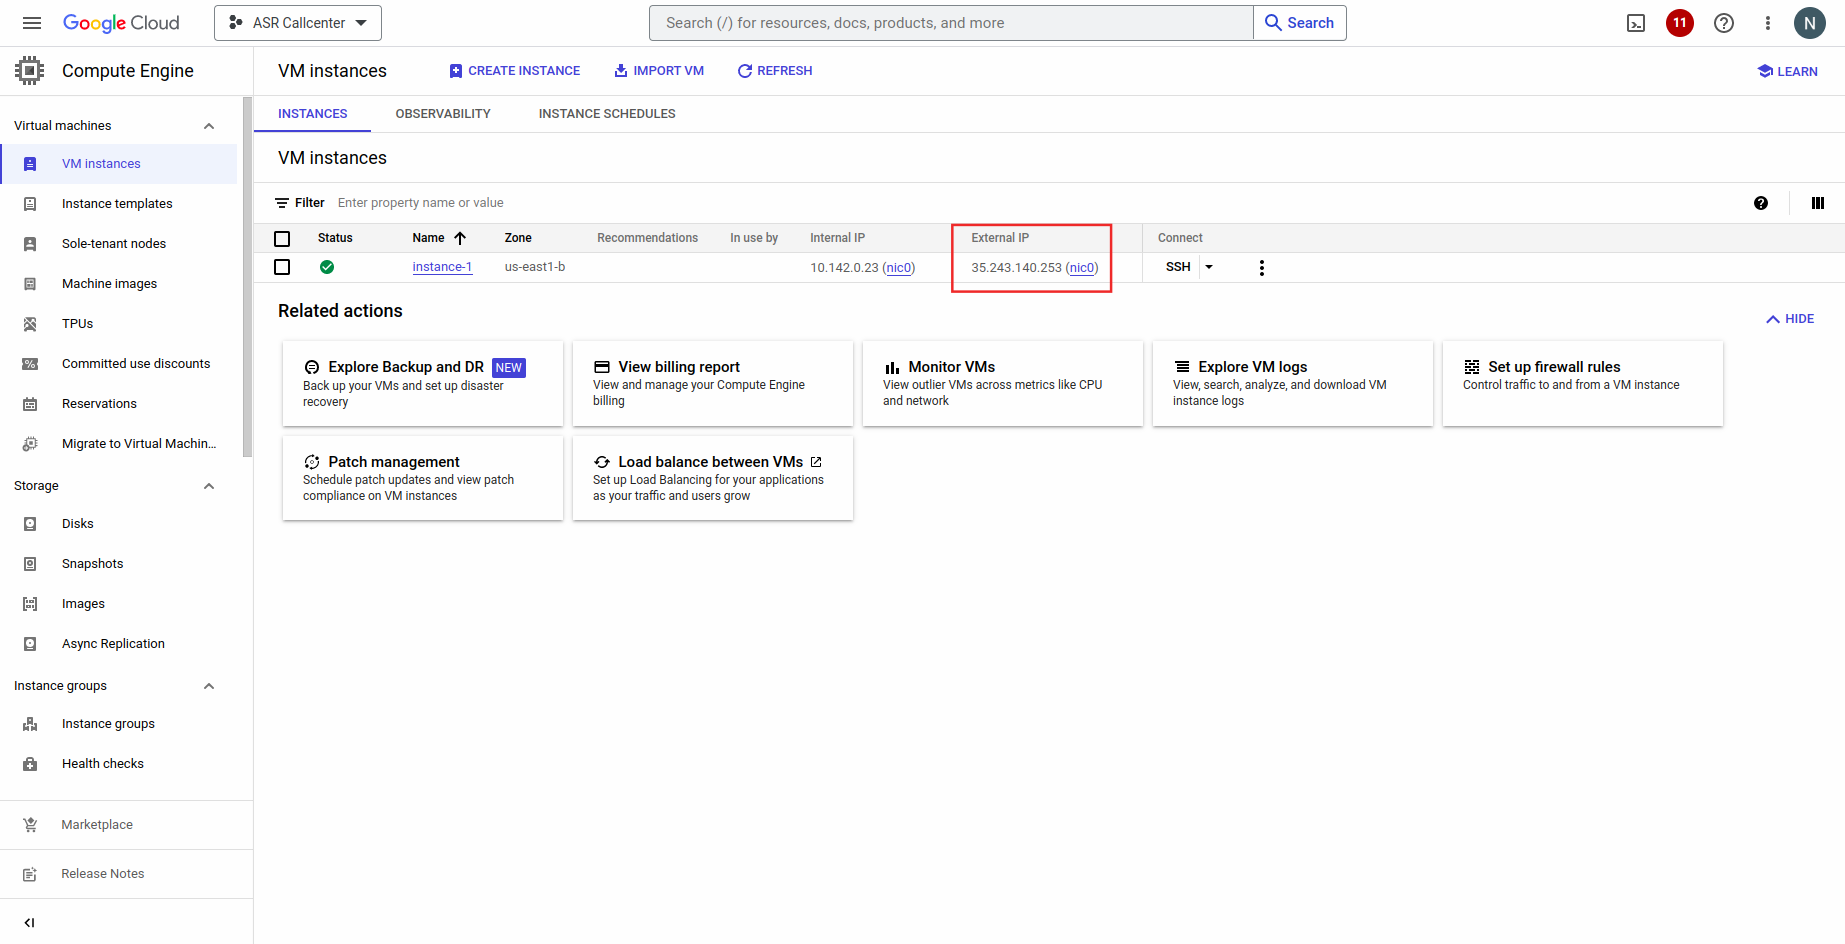
External IP Node:8081(you can get External IP Node from compute engine dasboard on GCP)
-
Additionally, we need to configure kubernetes in Jenkins as follow:
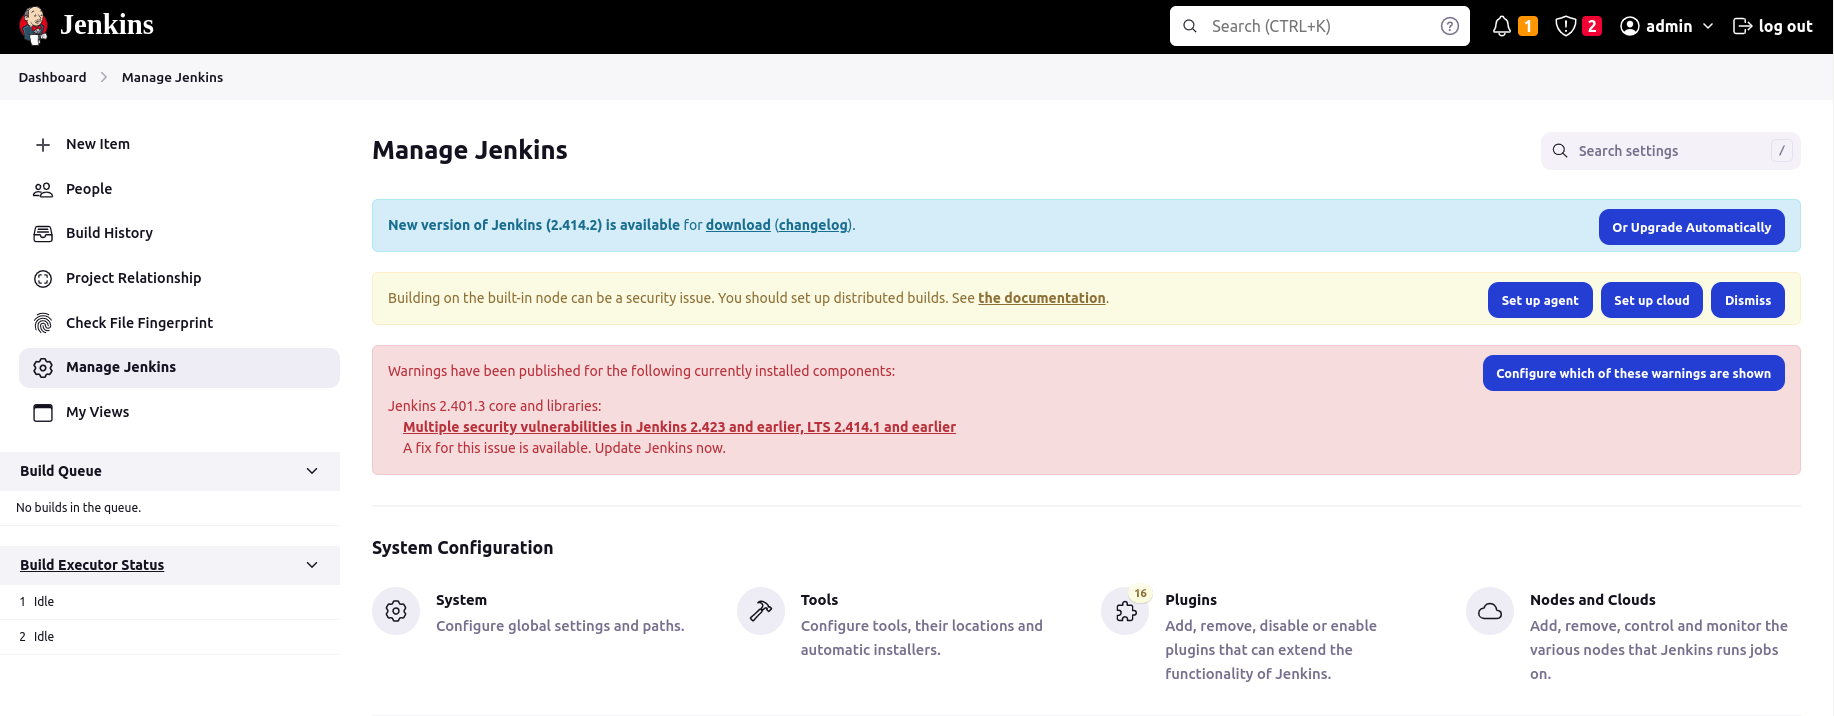
- In Manage Jenkins, click plugins
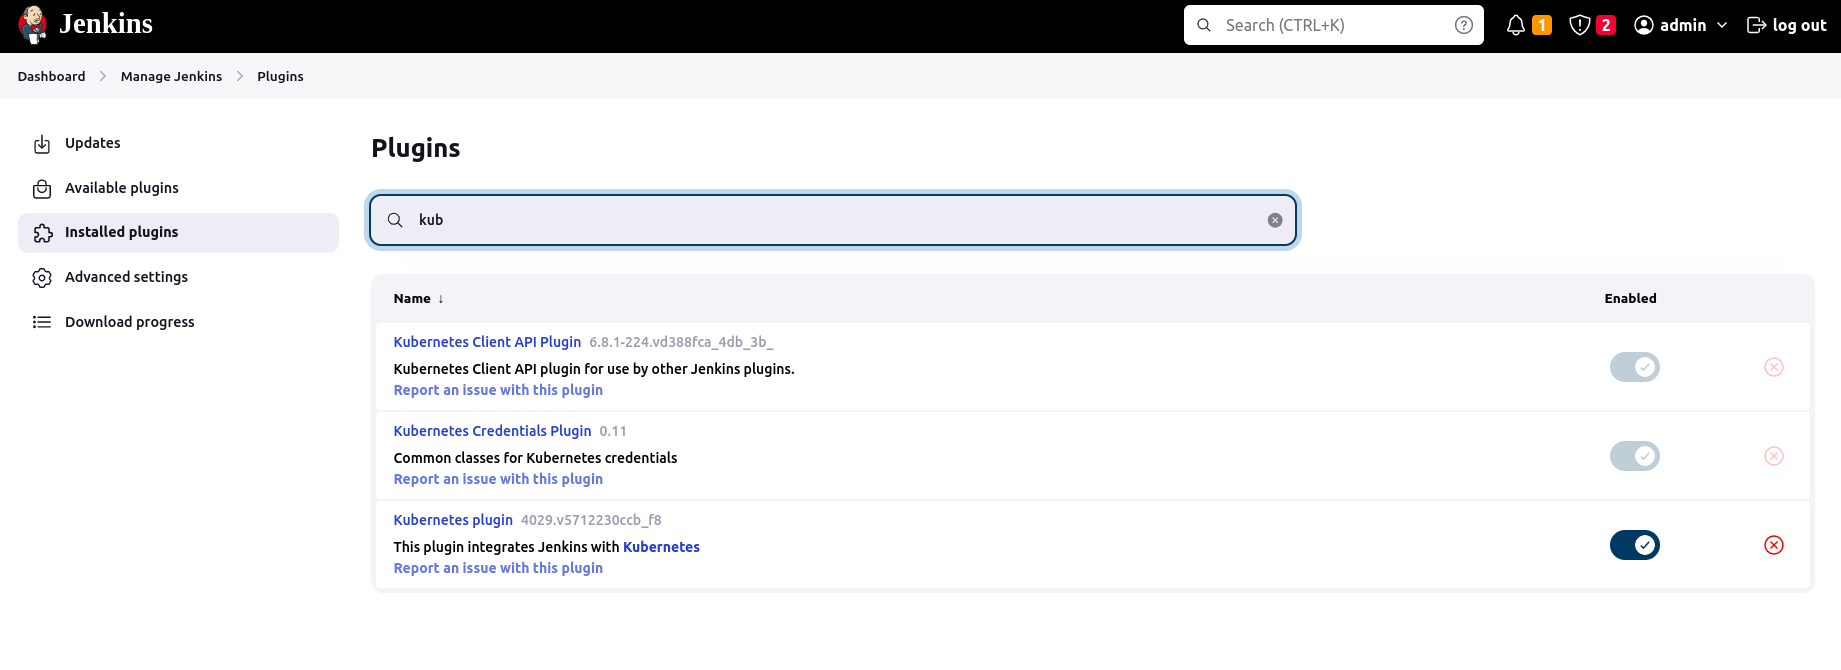
- Then click Available plugins, search kubernetes and choose plugin Kubernetes 4029.v5712230ccb_f8. After installing, you can check installed plugins in Installed plugins
- In Manage Jenkins, click Nodes and Clouds
- Then, click Clouds
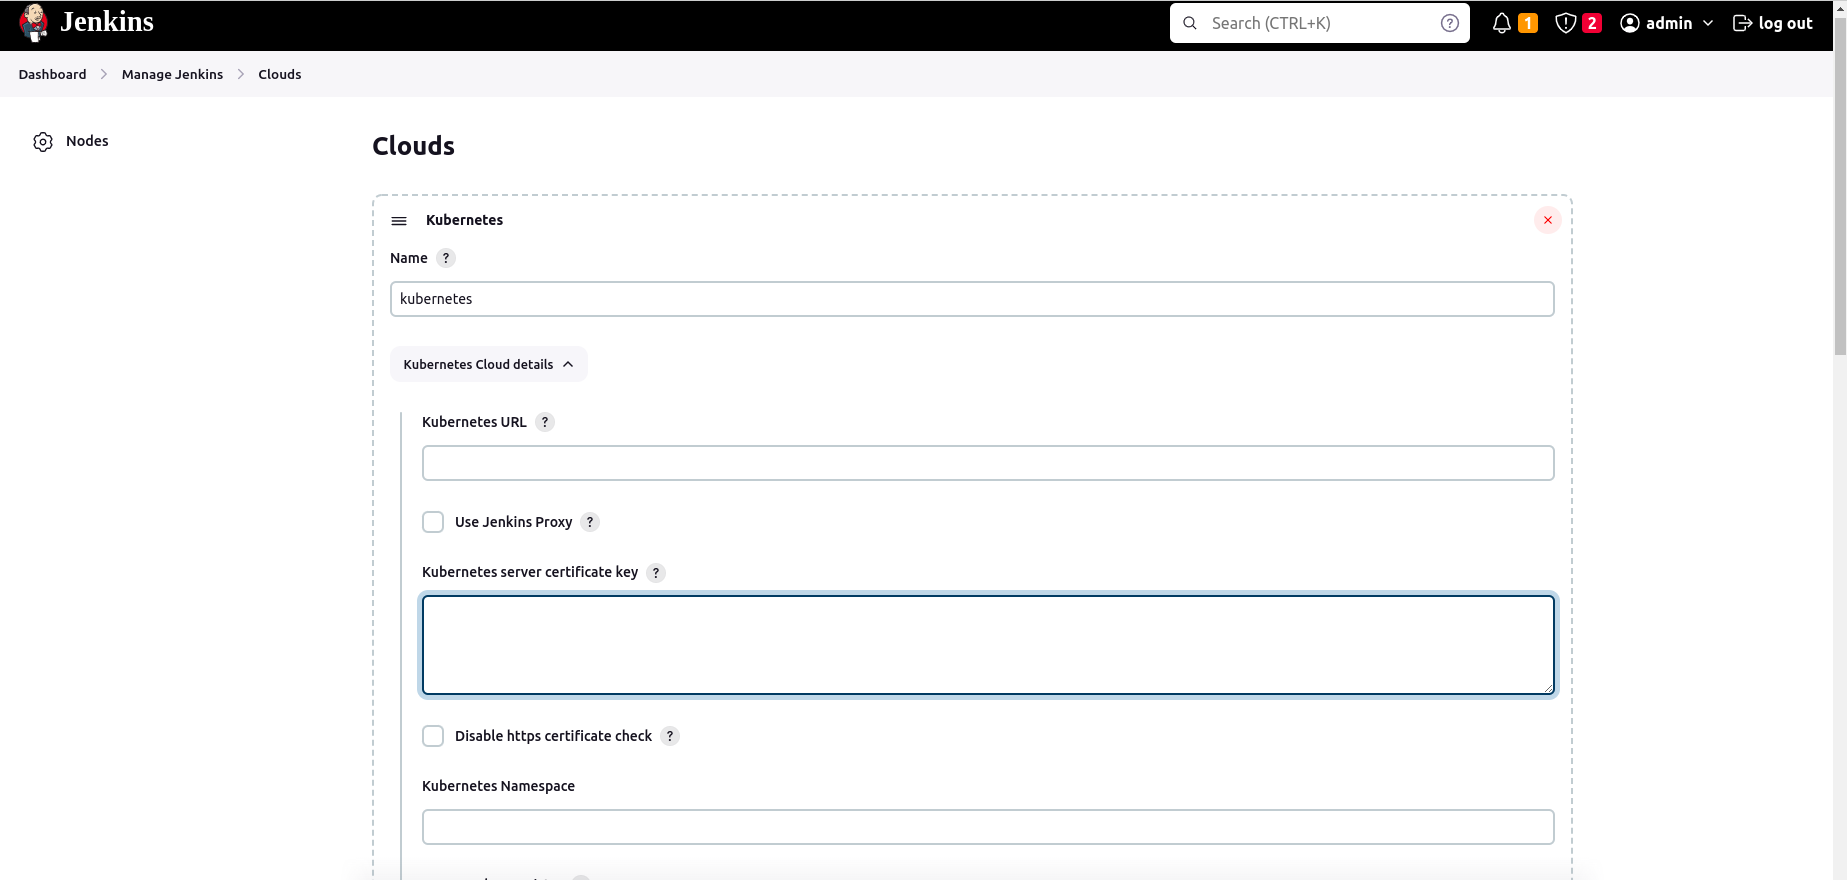
- After that, click Add a new cloud, choose Kubernetes and we have this window
-
In Kubernetes Cloud details, you need to fill in Kubernetes URL, Kubernetes server certificate key and Jenkins URL
- Kubernetes URL, Kubernetes server certificate key can be found in
~/minikf-kubeconfig
- Jenkins URL is your external ip of node is running, in my case is
http://34.148.249.129:8081
- Kubernetes URL, Kubernetes server certificate key can be found in
-
Finally, provide some permissions for Jenkins to apply
-
  kubectl create clusterrolebinding cluster-admin-binding \
  --clusterrole=cluster-admin --user=system:anonymous

  kubectl create clusterrolebinding cluster-admin-default-binding --clusterrole=cluster-admin --user=system:serviceaccount:default:default
-
-
After all, CICD pipeline is set up and it will run whenever you push, pull code
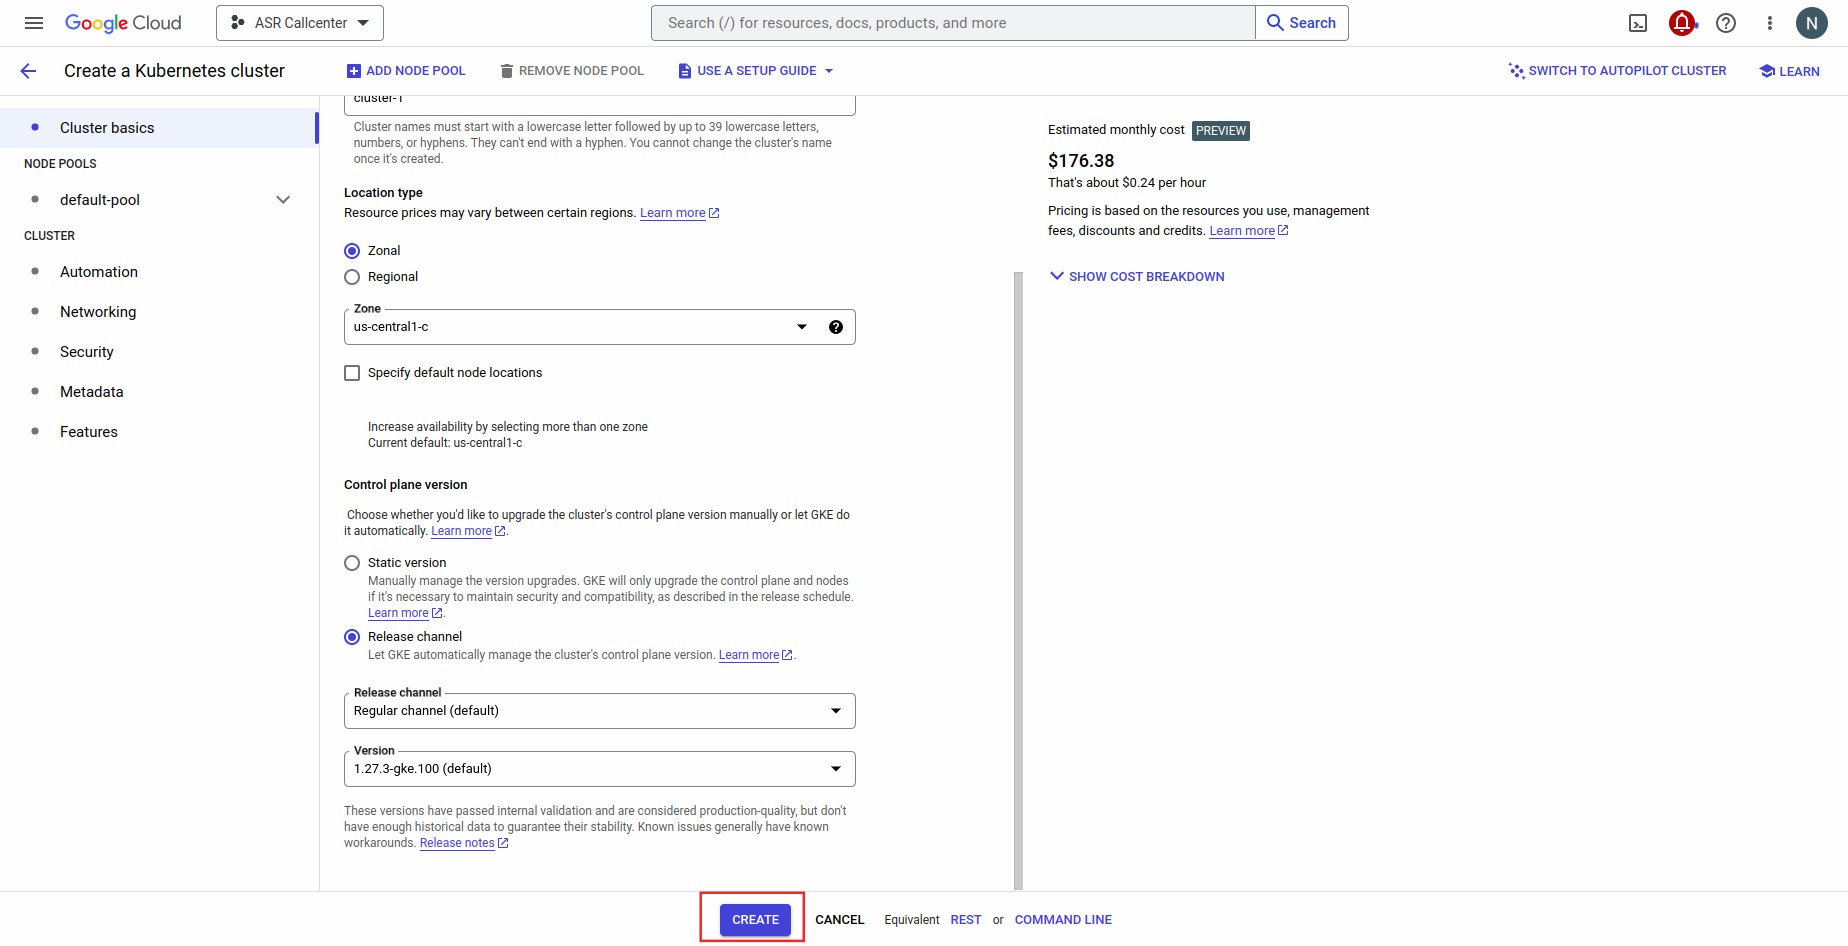
- To implement this section, you need to switch from autopilot to standard mode when you create GKE
- Then click create to create GKE
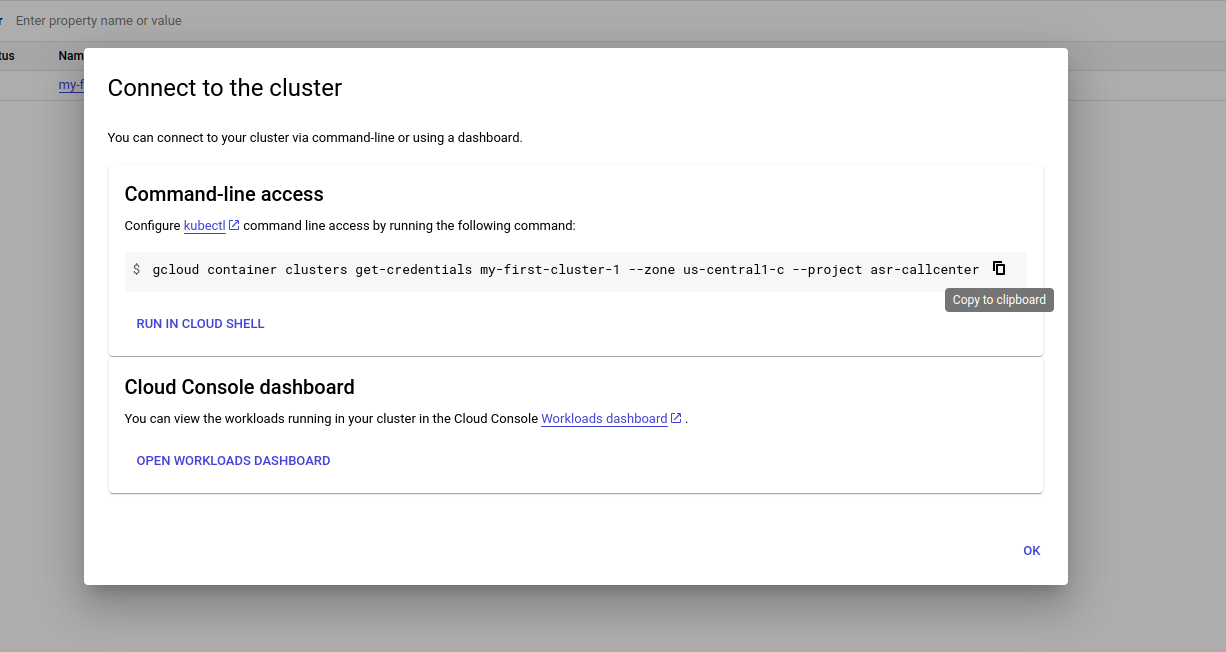
- Wait until GKE is created, click Connect
- After that, we have this pop up window, click Copy to clipboard
- Paste and run this command at your local terminal to connect to cluster
-
kubectx gke_asr-callcenter_us-central1-c_my-first-cluster-1to switch cluster -
Install Nginx Controller as follow:
-
  kubectl create ns nginx-ingress # Create a new namespace
  kubens nginx-ingress # Switch to the new namespace
  helm upgrade --install nginx-ingress-controller ./service_k8s/nginx-ingress
-
-
Then install prometheus and grafana:
-
  kubectl create -f ./monitoring_k8s/monitoring/prometheus/kubernetes/1.23/manifests/setup/
  kubectl create -f ./monitoring_k8s/monitoring/prometheus/kubernetes/1.23/manifests/
kubectl apply -n monitoring -f ./monitoring_k8s/service_monitor/prometheus.yaml
-
-
kubens default -
kubectl apply -f ./monitoring_k8s/service_monitor/servicemonitor.yaml -
helm upgrade --install diabetes-api ./service_k8s/service_ingress
sudo vim /etc/hoststo modify nginx ingress address to access to service, in my case is 35.238.122.90 diabetes.example.com
kubectl -n monitoring port-forward prometheus-applications-0 9090, then you can access prometheus service at port 9090 on localhost.
