Trace the 3D short fibes which were filled in the polymer matrix
Author: Dr. Benke Li (李本科)
Author's ORCID: https://orcid.org/0000-0002-8830-0563
Author's ResearchGate: https://www.researchgate.net/profile/Benke-Li
Please cite this paper if you use this package:
Benke Li, Wei You, Sijun Liu, Li Peng, Xianbo Huang, and Wei Yu. "Role of confinement in the shear banding and shear jamming in noncolloidal fiber suspensions." Soft Matter 2023, 19 (46), 8965-8977.
@Article{10.1039/D3SM00943B, author ="Li, Benke and You, Wei and Liu, Sijun and Peng, Li and Huang, Xianbo and Yu, Wei", title ="Role of confinement in the shear banding and shear jamming in noncolloidal fiber suspensions", journal ="Soft Matter", year ="2023", volume ="19", issue ="46", pages ="8965-8977", publisher ="The Royal Society of Chemistry", doi ="10.1039/D3SM00943B", url ="http://dx.doi.org/10.1039/D3SM00943B"}
flowchart TD
D([Original Data]) -- correlation operation --> O([orientation field]) -->T
D --> B(binarized mask) --> S(skeleton) --> T(traced fibers)
Tracing high-concentrated fibers in the 3D CT images is not an easy task; this repository provides an efficient way to trace fibers based on the orientation fields obtained by convolve operations.
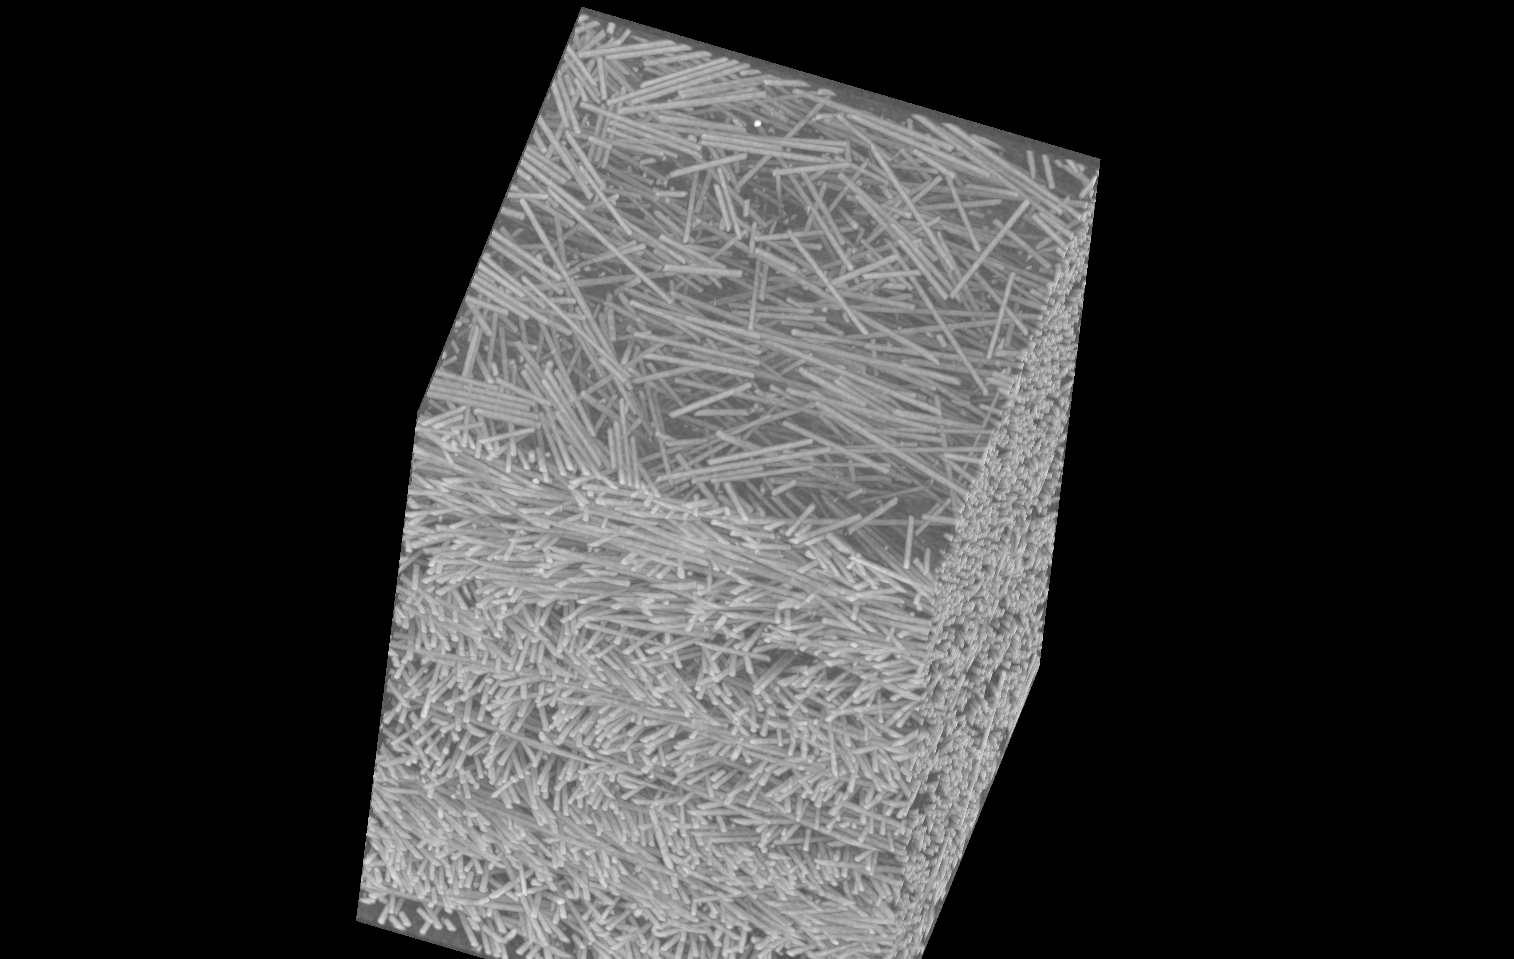
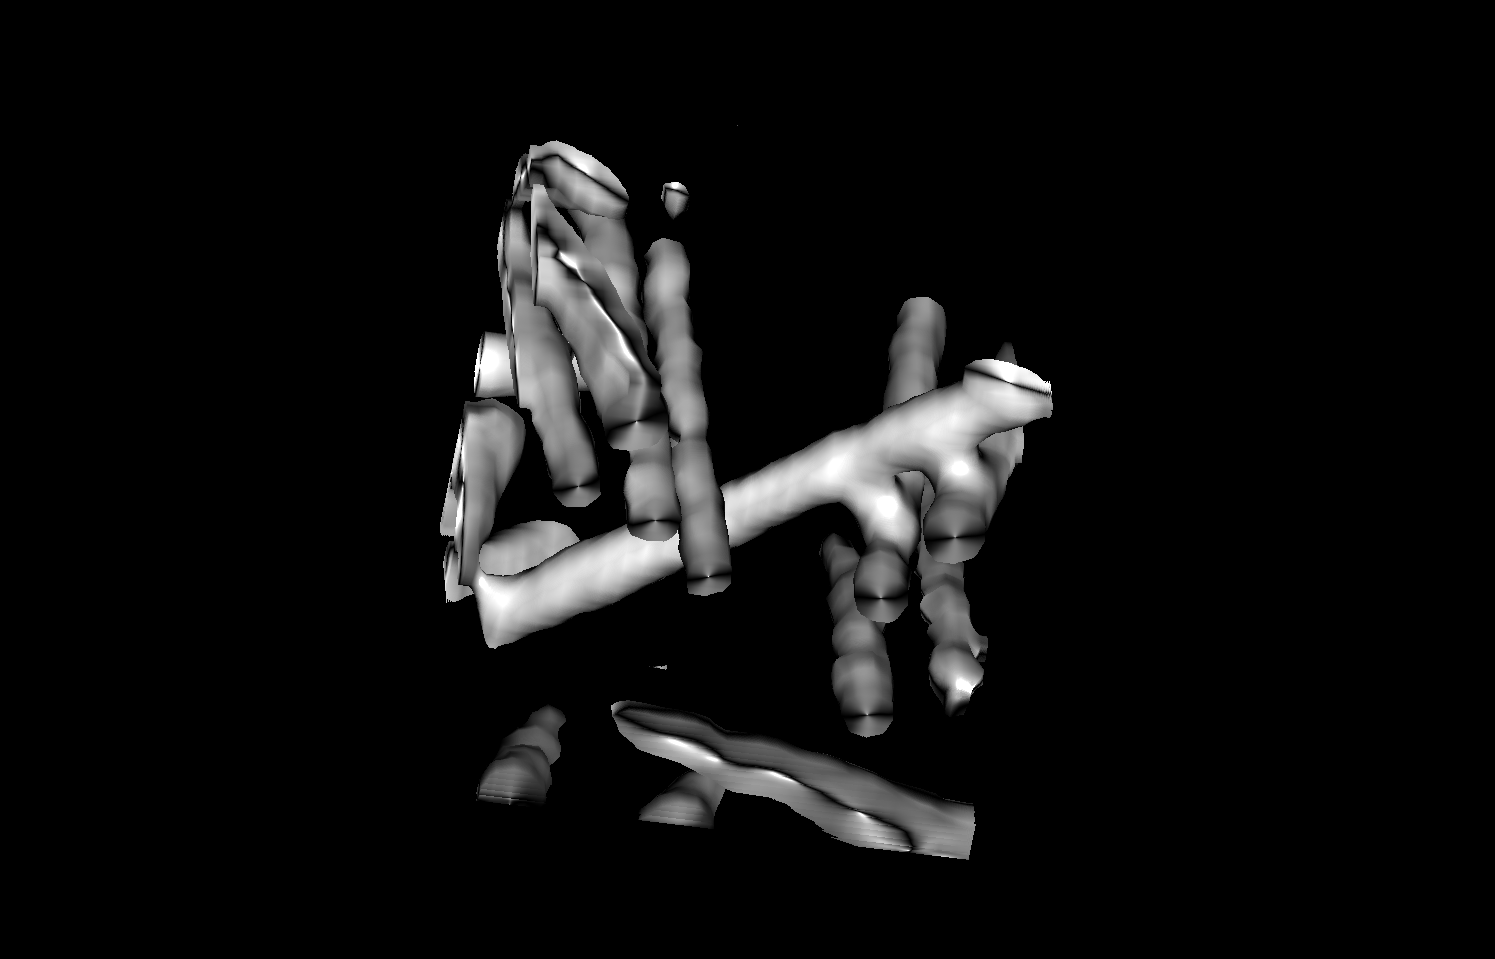
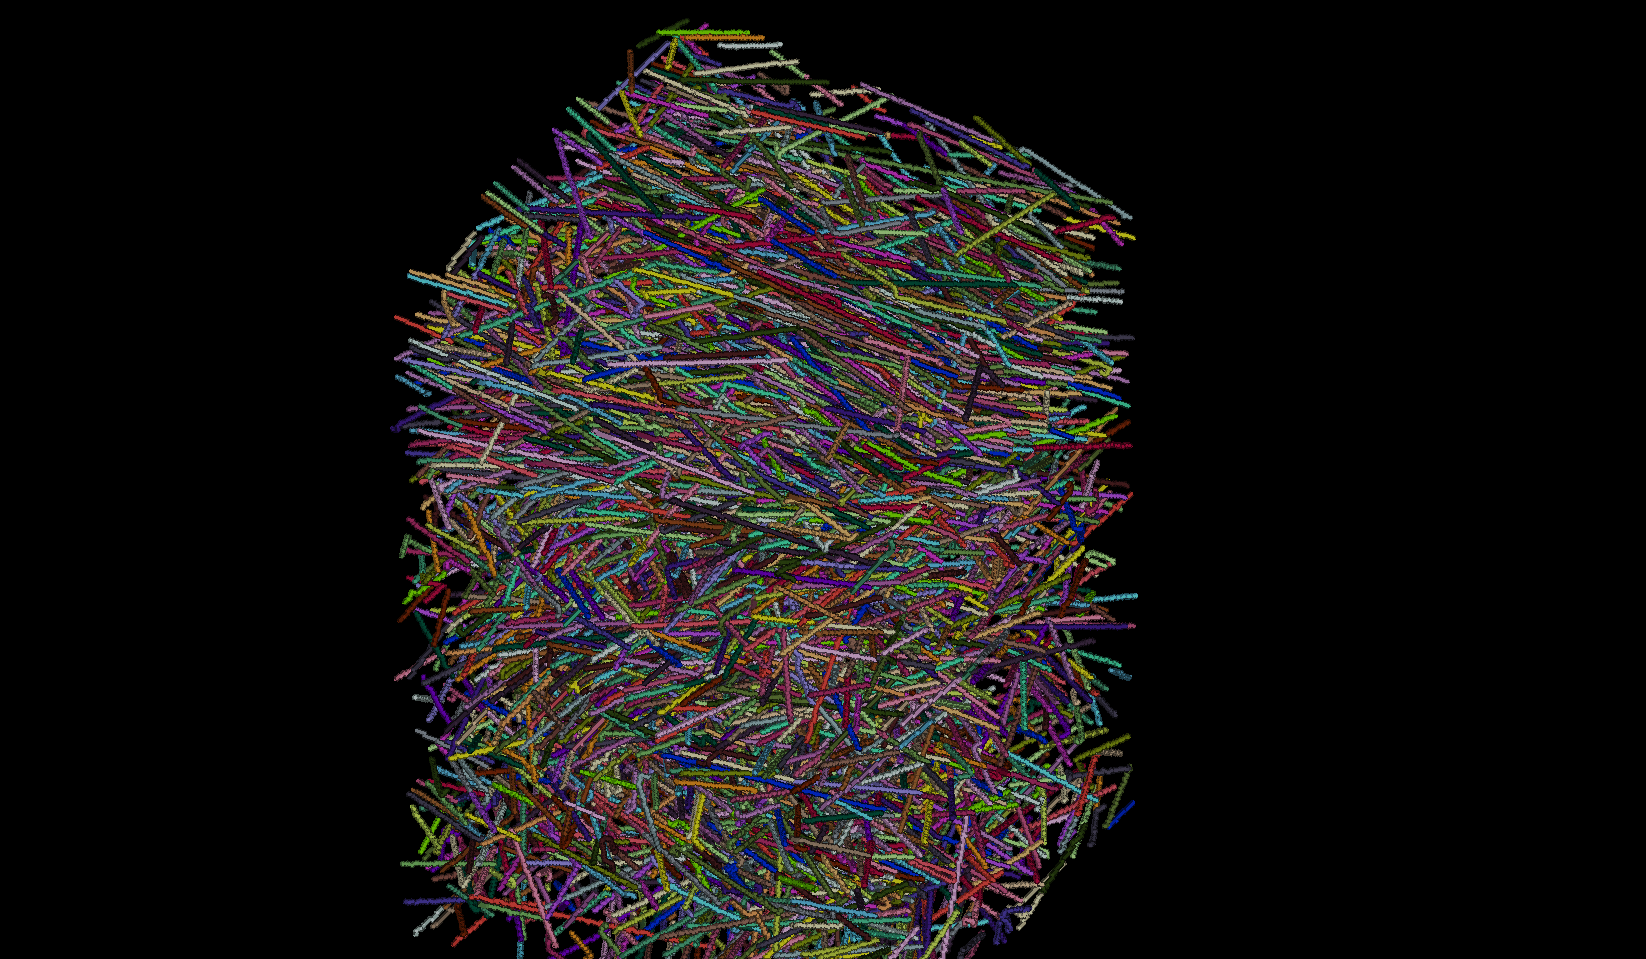
Due to the high concentration (see original data) of the filled fibers, the fibers tend to interact with each other, and they seemed to be "connected" in the 3D CT images (see local view). So, the fibers should be traced so that to seperate them from each other during image segmentation operations, so as to obtain correct orientation tensors of the fibers. We utilized the orientation field of the 3D CT data (see file step1-cal_orientation_field.ipynb for algorithm details) to trace the fibers successfully (see file step2-individual_fiber_segmentation.ipynb for tracing details). And the tracing results is shown in traced fibers.
numpy, scipy, scikit-image, pandas, matplotlib, napari, imageio
- Make sure
python3and dependencies were installed. The denpendencies could be install by the command:python3 -m pip3 install numpy scipy scikit-image pandas matplotlib napari imageio - Download this package, or by command:
git clone https://github.com/libenke/CT_FiberSegmentation - The 3D CT data should be stored as ".tiff" files for each slices in one folder, each folder for each volume data.
- Fill the data folder path in the assignment statement
data_dirs = ["demo_data",]both in the filesstep1-cal_orientation_field.pyandstep2-individual_fiber_segmentation.py. - Run in the terminal:
python -m step1-cal_orientation_field.py python -m step2-individual_fiber_segmentation.py - The results were stored as numpy files
.npyand HDF5 files.h5in the data folders.


