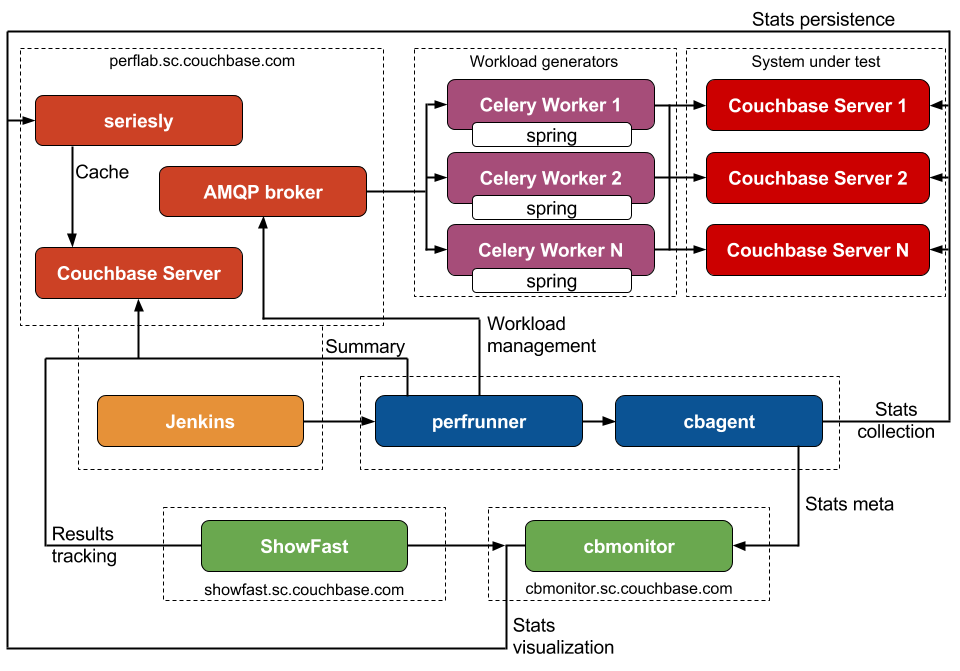
Related projects:
- Python 2.7 (including headers)
- virtualenv
- libcouchbase-devel (or equivalent)
- dtach (for remote workers only)
- AMQP broker (RabbitMQ is recommended)
Python dependencies are listed in requirements.txt.
python -m perfrunner.utils.install -c ${cluster} -v ${version} -t ${toy}
python -m perfrunner.utils.cluster -c ${cluster} -t ${test_config}
For instance:
python -m perfrunner.utils.install -c clusters/vesta.spec -v 2.0.0-1976

python -m perfrunner.utils.install -c clusters/vesta.spec -v 2.1.1-PRF03 -t couchstore

python -m perfrunner.utils.cluster -c clusters/vesta.spec -t tests/comp_bucket_20M.test
python -m perfrunner -c ${cluster} -t ${test_config}
For instance:
python -m perfrunner -c clusters/vesta.spec -t tests/comp_bucket_20M.test
Overriding test config options (comma-separated section.option.value trios):
python -m perfrunner -c clusters/vesta.spec -t tests/comp_bucket_20M.test \
    load.size.512,cluster.initial_nodes.3 4
python -m perfrunner.tests.functional -c ${cluster} -t ${test_config}
For instance:
python -m perfrunner.tests.functional -c clusters/atlas.spec -t tests/functional.test
After nose installation:
nosetests -v unittests.py
cbmonitor provides handy APIs for experiments when we need to track metric while varying one or more input parameters. For instance, we want to analyze how GET latency depends on number of front-end memcached threads.
First of all, we create experiment config like this one:
{
    "name": "95th percentile GET latency (ms), variable memcached threads",
    "defaults": {
        "memcached threads": 4
    }
}
Query for memcached threads variable must be defined in experiment helper:
'memcached threads': 'self.tc.cluster.num_cpus'
There must be corrensponding test config which measures GET latency. Most importantly test case should post experimental results:
if hasattr(self, 'experiment'):
    self.experiment.post_results(latency_get)
Finally we can execute scripts/workload_exp.sh which has -e flag.
Now we can check cbmonitor UI and analyze results.
