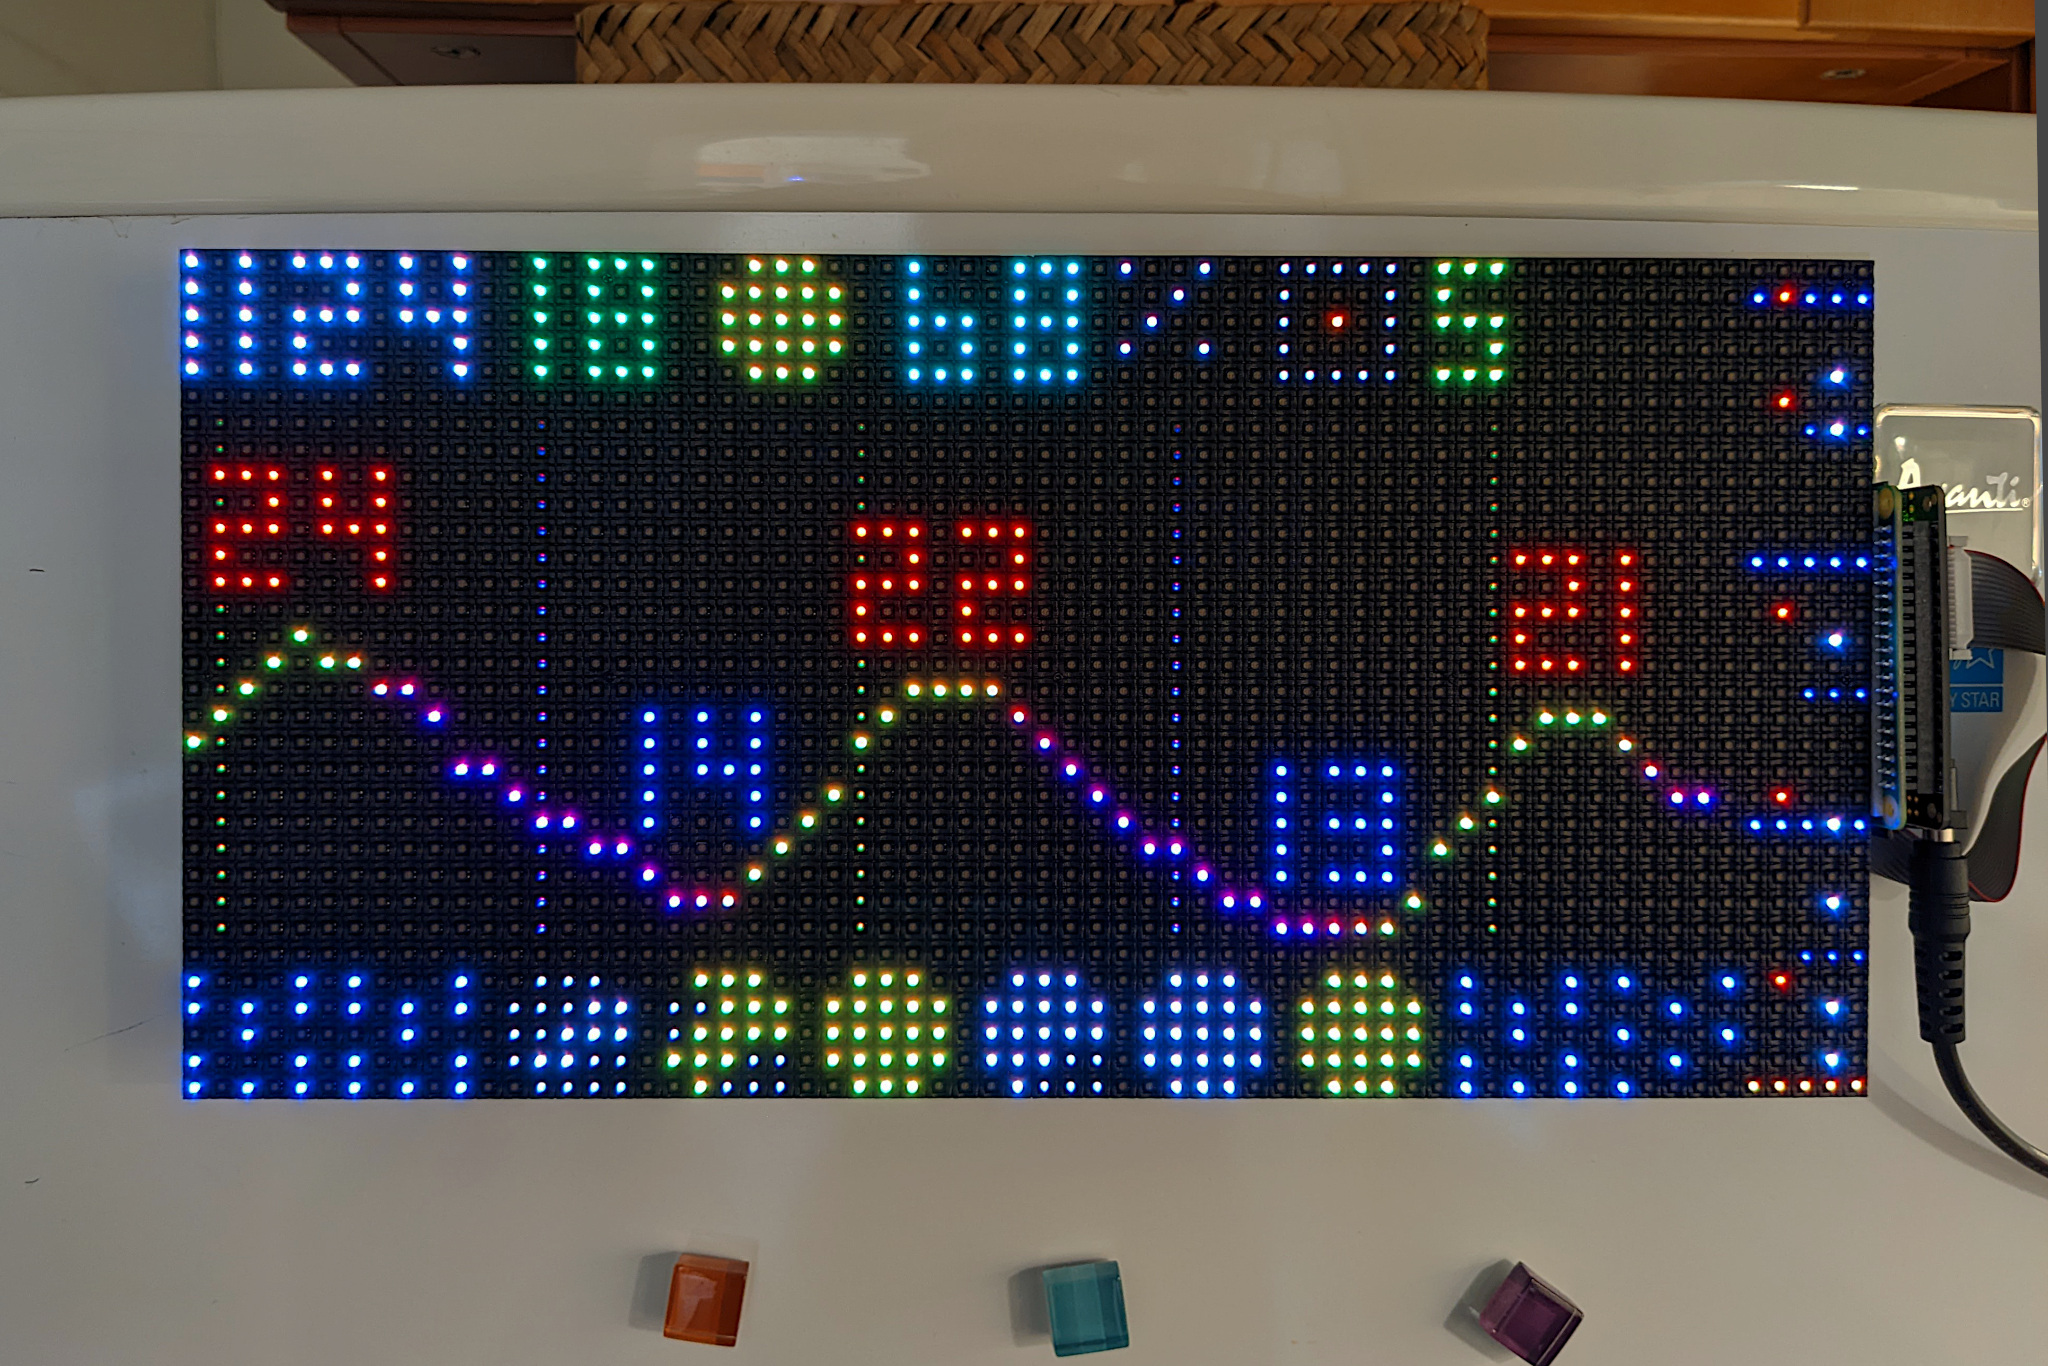
Display information you may want to know when leaving the house on a fancy fridge magnet, a.k.a. an LED matrix. Powered by weather.gov and MTA realtime data APIs.
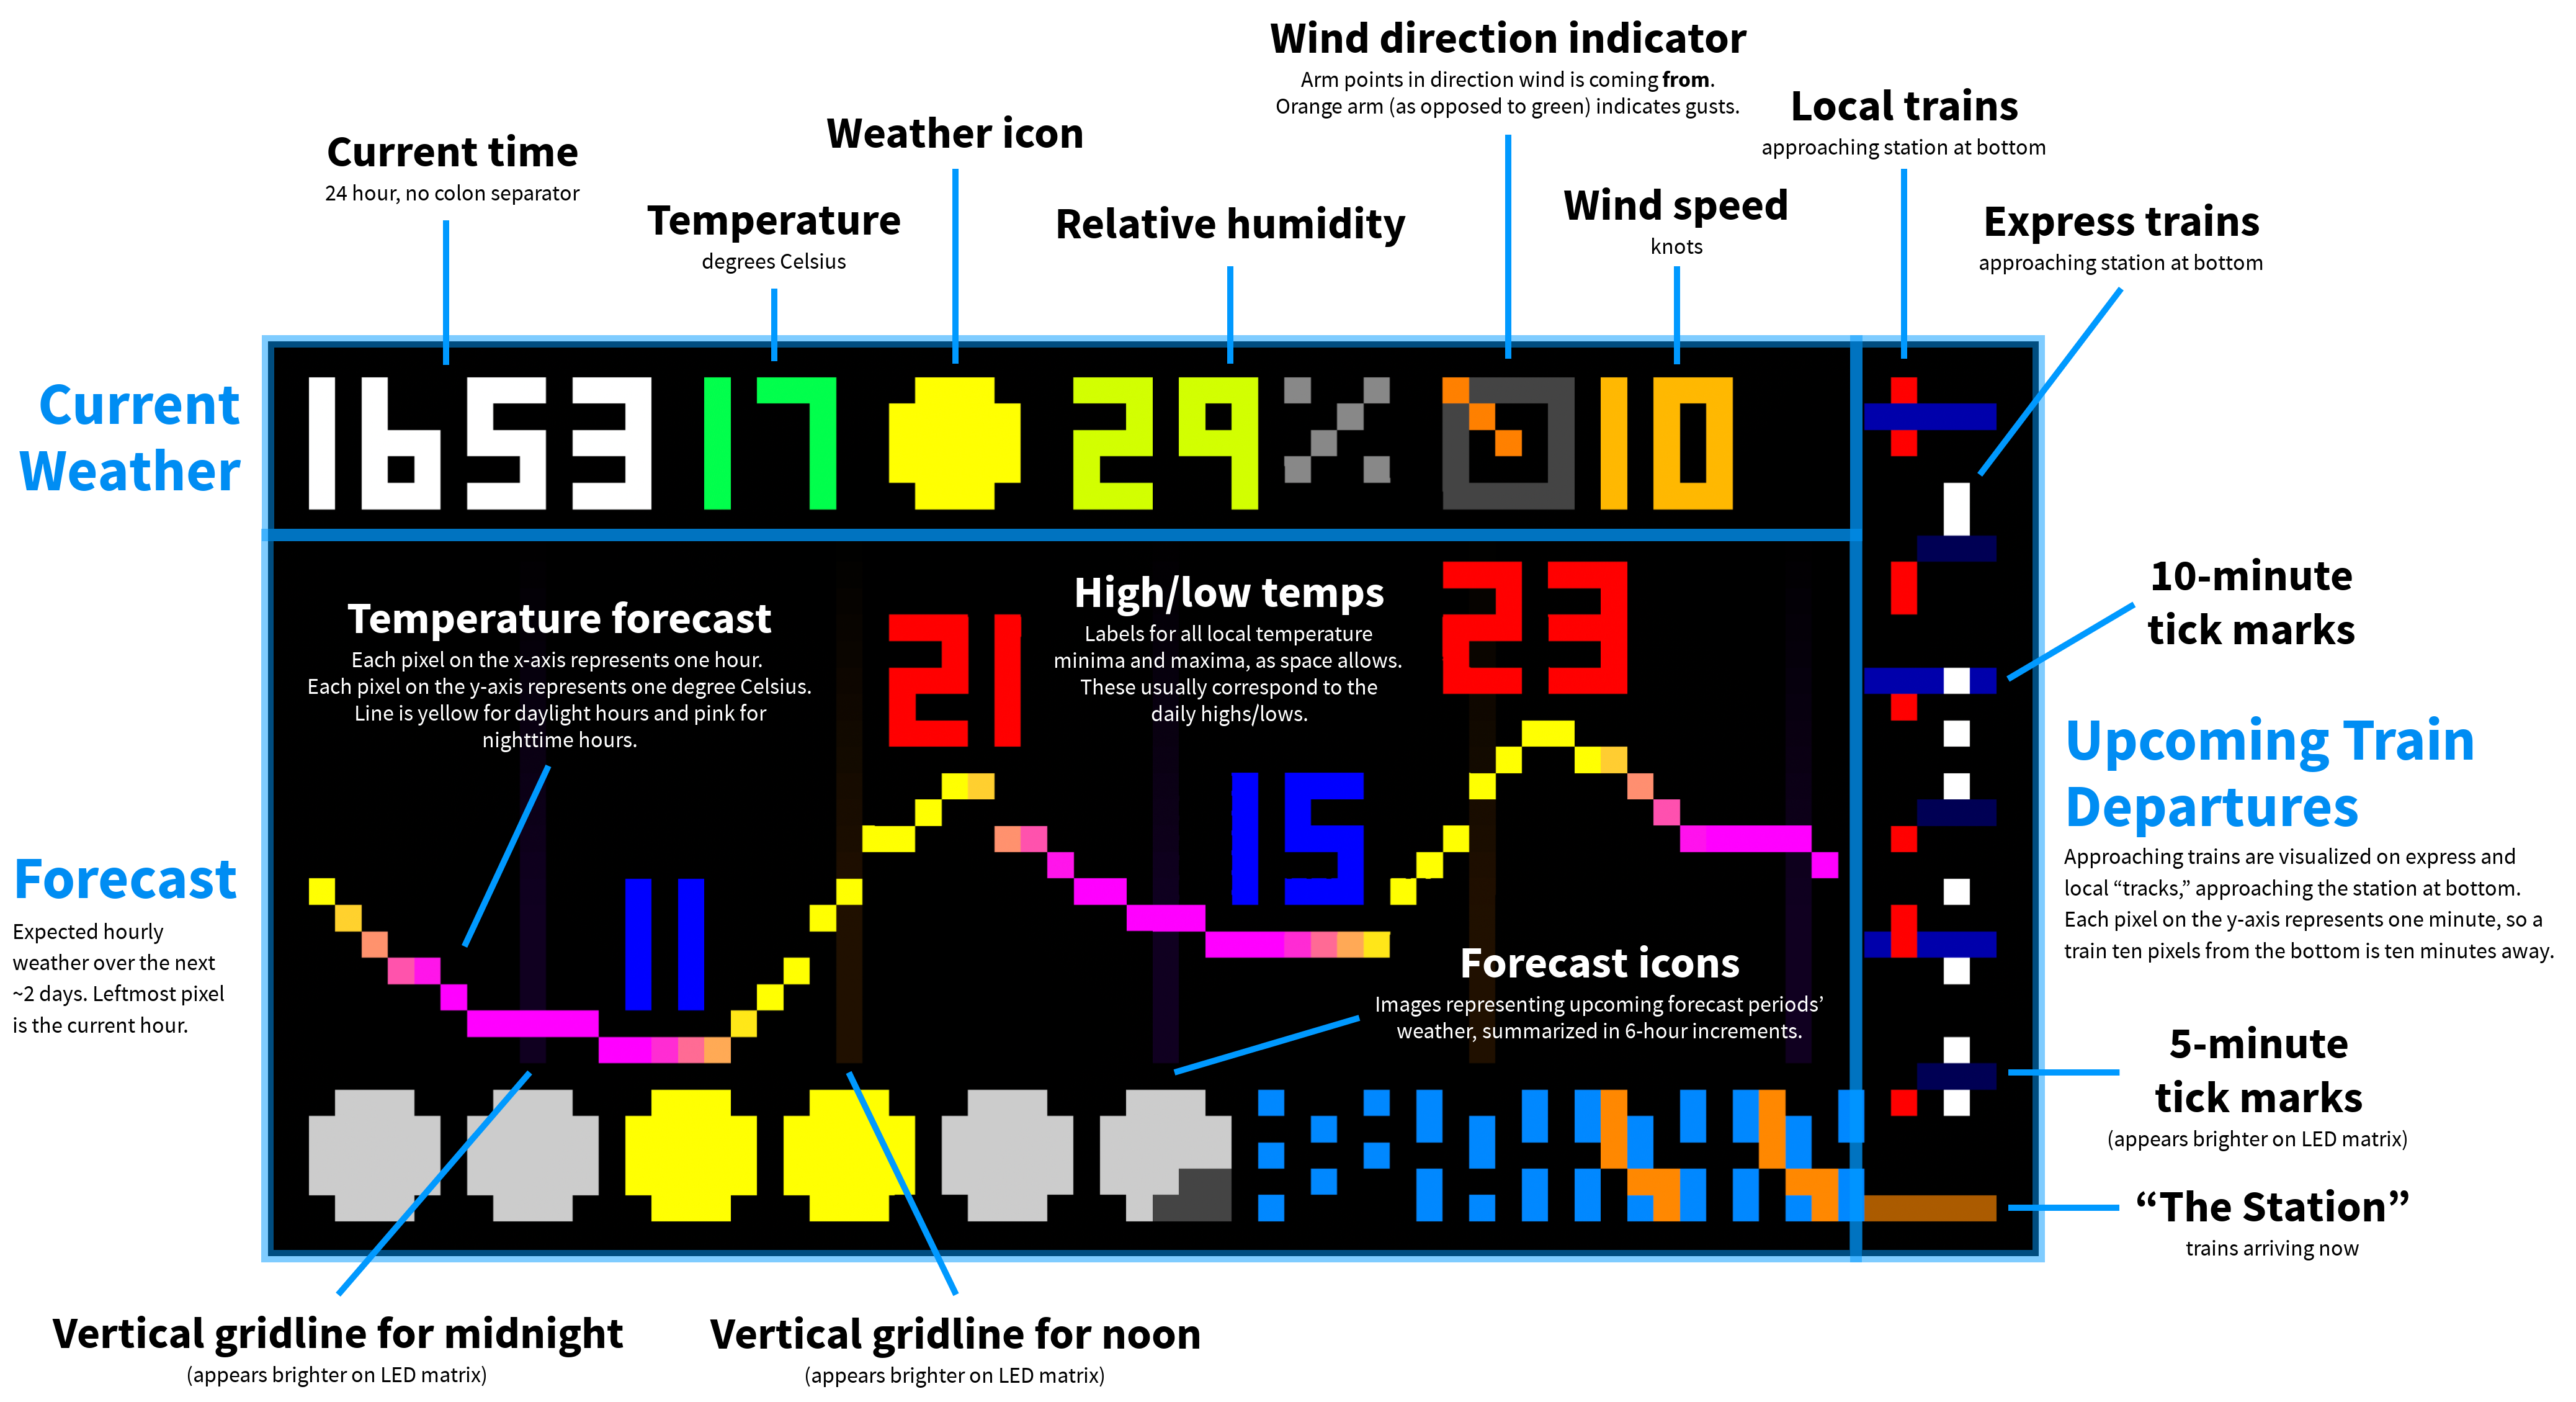
Wondering what everything on this display means? Jump down to the explanation!
- Raspberry Pi Zero W
- 64x32 LED matrix, 5mm pitch – can get cheaper from Aliexpress, but longer shipping time
- Adafruit RGB Matrix Bonnet
- Power supply, 5V 8A
- Mounting tape – (optional) attach Pi to matrix
- Cable concealer – (optional) for power supply cord
The hardware build is pretty straightforward and mostly involves plugging things in to the right places, unless you want to add an on/off button to the matrix. For Pis without a header, you will need to solder one on. Consider a Raspberry Pi Zero W (or the Zero 2 W) for a smaller form factor. The software commands will take a while to start up vs. newer/faster models, but once they get going I haven't faced any issues.
I followed this tutorial and watched the associated YouTube video for most of the guidance I needed. (The video displays something different in software, but the hardware setup is the same.)
I did make the mod described in the Adafruit RGB Matrix Bonnet documentation under Step 6 to eliminate matrix flicker: soldering a short wire to the bonnet between pins GPIO4 and GPIO18. After making this hardware mod, you need to disable sound on the Pi by following these steps. I didn't bother digging into why this was only an issue with the hardware mod; it doesn't really matter because this project does not involve audio.
Tested running:
- macOS on Apple Silicon (with web-based viewer for development)
- Raspberry Pi OS Lite on ARMv6, running on a Raspberry Pi Zero W (with LED matrix connection)
npm install- (on Pi only)
./scripts/build_rpi-rgb-led-matrix.sh
- Create an account at https://api.mta.info/#/signup
- Get an API key from https://api.mta.info/#/AccessKey (link only goes to the right page once logged in)
API_KEY=<Your API key> npm startYou can also npm run dev with your API key prepended for an auto-reloading server.
npm run displaynpm run web-viewerView the board at http://localhost:8000/viewer.html
Click image to enlarge.
Matrix images like this can be displayed with the web-based board viewer mentioned above.
The board only shows trains going in one direction because most of the time I only go downtown from my stop. Not needing to show both directions freed up more space for the weather/forecast visualization.
There are earlier branches of this repo that only display subway departures without weather information:
subway-only: Cycles through upcoming train departures in large green letters in one direction only, plus a departure timeline like the one on the right of this branch's board.no-timeline: Similar to the above, but displays departures in both directions and includes an uptown/downtown arrow. The tradeoff with this branch, as the name implies, is that there was no room for the departure timeline.
index.js: Main entry point for Node.js app that calls the MTA and weather.gov APIs, generates a board image using the JavaScriptcanvasAPI, and writes it to disk. It runs in an infinite loop and updates every 30 seconds.fetch/: Calling APIs and enriching/transforming responses to the desired formatsdisplay/: All the display logic for what to draw whereboard.png: Image of the board to display. Generated the by Node.js app and not in version control. View it on the web viewer or the LED matrix as detailed above under Running.
- constants.js: Constants.
STATION_IDis the subway station from which the departures are shown.
image-viewer.py: Script that recurringly reads the board image file from disk and displays it on the LED matrix using the Python bindings of rpi-rgb-led-matrix. Used Python rather than the faster C++ library because it was more developer friendly (to me) and because the display refresh rate doesn't need to be fast since it only shows a new frame every 30 seconds.
graphics/: Sprite images used on the board, positioned and composited by the Node.js app
scripts/ One-time bash scripts used for dependency installation:
install_canvas_dependencies.shautomatically runs beforenpm installto install the requiredcanvaspackage dependencies.npm installwill fail without doing this first.build_rpi-rgb-led-matrix.shbuilds the binaries forrpi-rgb-led-matrixon Linux OSs withapt-getonly. This library displays the board image file on the LED matrix.

