Predict the stock price trend of Google for the next one month. The data was downloaded from Yahoo Finance. It contains stock prices of google for the last 5 years. Stacked LSTM architecture is used for predictive modelling.
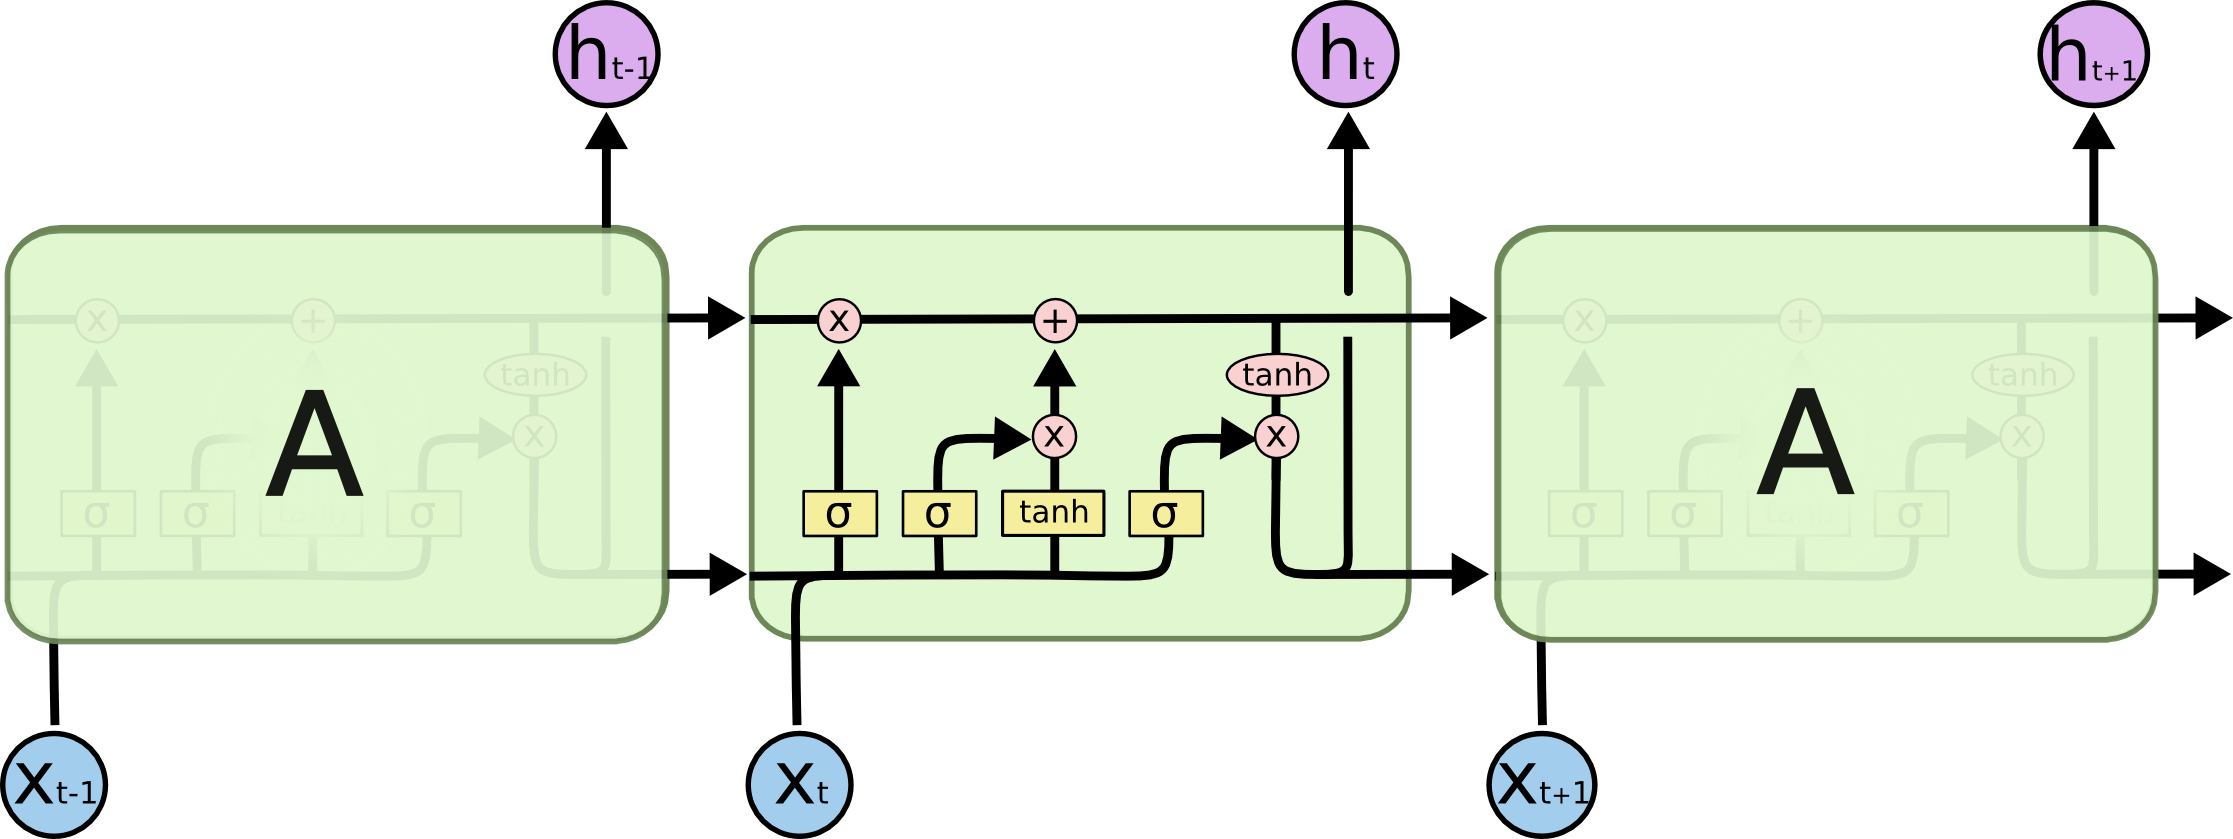
Long Short Term Memory networks aka LSTMs are a special kind of RNN, capable of learning long term dependencies. They are designed to avoid vanishing and exploding gradient problem that RNN faces for long term dependencies. LSTMs provide a highway for the gradient to propagate backwards.
- c(t) - Cell state vector
- x(t) - Input vector
- Forget Gate Layer - Looks at h(t-1) and x(t) to output what amount of information to throw away
- Input Gate Layer - Decides which value to update
- Cell State Vector - Creates a vector of candidate values
- Output Gate Layer - Decides which parts of the cell state to output
- Output Vector(h(t)) - Some part of cell state in the range of -1 to +1 is the output
- The forget gate ouputs values that determine what amount of previous cell state values to keep
- Input gate outputs values that is multiplied by the cell state vector to create an update
- Multiply previous cell state with the output of forget gate
- Then we add the result of 2 and 3. This is the new candidate values(C(t)), scaled by how much we decided to update each state value.
- C(t) is then squashed by tanh layer, multiplied by the output of output gate layer to give h(t)
- Clone this repository to your computer.
- Get into the folder using cd Stock-Trend-Predictor.
- Download the data from Yahoo Finance into this directory.
- pip install keras
- pip install tensorflow
- pip install pandas
- pip install matplotlib
- Run each cell in the Model_script.ipynb file.
- Save the graph for presentation
The model is able to predict the trend of stock prices accurately as shown in the graph
