SolrWatch is a Solr monitoring tool, which can track important metrics about Solr performance and visualize it.
- Prerequisites/Dependencies: https://github.com/vikas4s/solrwatch/wiki/1.-Requirements
- Configuration: https://github.com/vikas4s/solrwatch/wiki/2.-Configuration
- How to use: https://github.com/vikas4s/solrwatch/wiki/3.-Setup-(How-to-use)
- Using docker image: https://github.com/vikas4s/solrwatch/wiki/4.-Using-docker-image
Currently it tracks the following metrics:
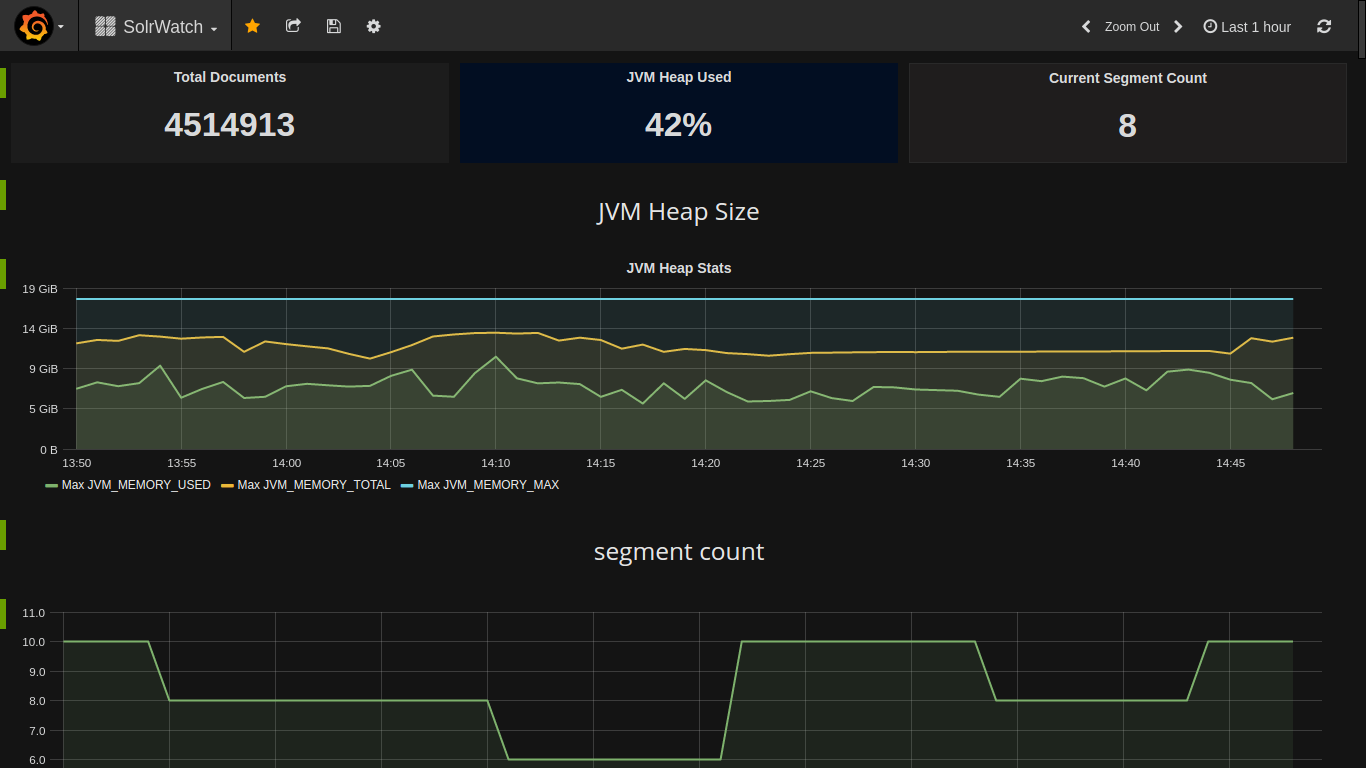
- Total number of documents
- Document growth rate
- Document deletion rate
- JVM heap usage
- Segment count, segments generation rate
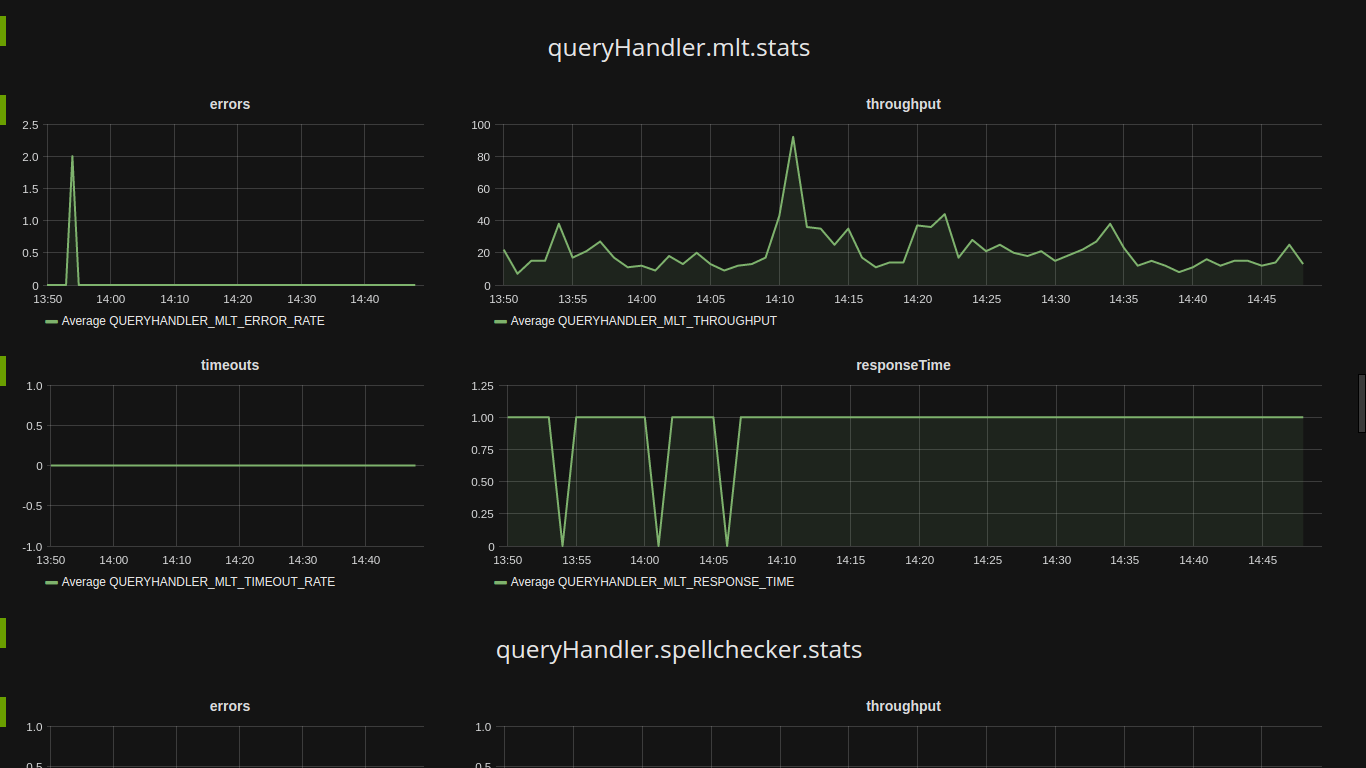
Query handlers handle incoming requests. User can define multiple query handler. For each defined handler, the following metrics are tracked:
- Throughput (Requests/minute)
- Error rate (Errors/minute)
- Timeout rate (Timeouts/minute)
- Response time (Avg response time/minute)
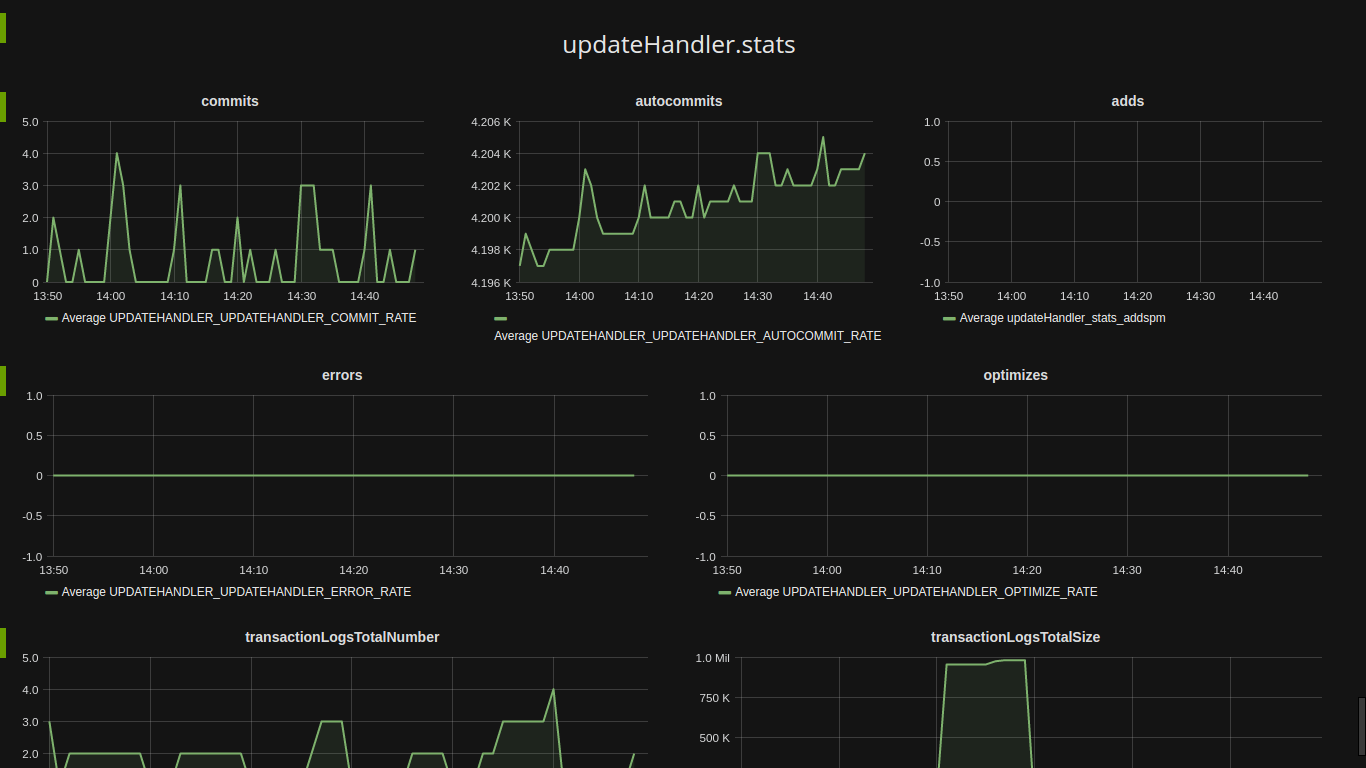
Update handlers handle indexinn requests. For each defined update handler, the following metrics are tracked:
- Commit rate (commits/minute)
- Autocommit rate (autocommits/minute)
- Indexing rate (Documents indexed/minute)
- Error rate (Errors/minute)
- Optimize rate (Optimizes/minute)
- Total no. of transaction logs
- Total size of transaction logs
Solrwatch fetches metrics from the following:
- JMX/Mbeans e.g. http://localhost:8983/solr/admin/mbeans?stats=true
- System stats e.g. http://localhost:8983/solr/admin/system?stats=true
- Luke status e.g. http://localhost:8983/solr/admin/luke
SolrWatch uses elasticsearch to store the metrics time series data. A running elasticsearch cluster is required. The elasticsearch URL can be specified in app.conf file.
SolrWatch creates an index named solrwatch in elasticsearch when it starts.
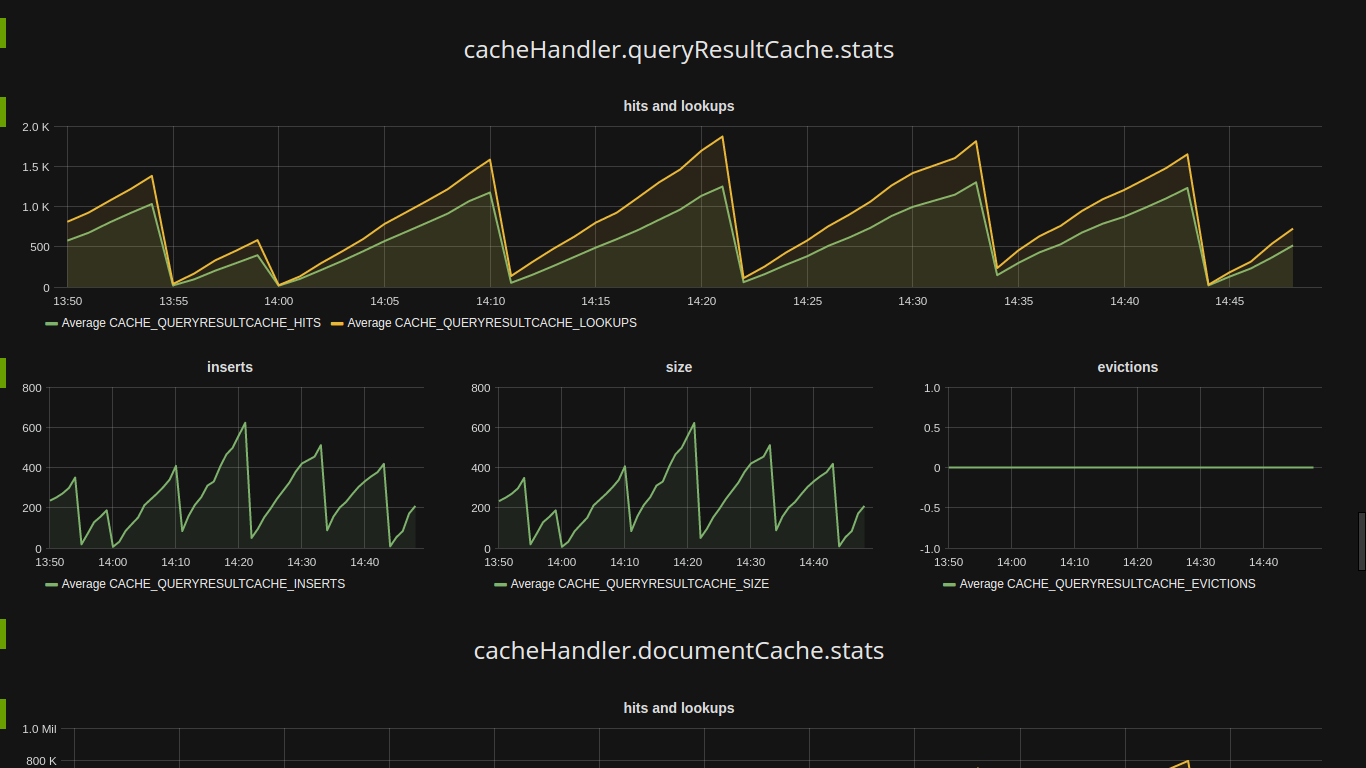
SolrWatch uses Grafana for visualization. In Grafana, we need to define an elasticsearch datasource named "SolrWatch". Sample Grafana templates are provided, which can be easily customized. You can create your own dashboards by connecting to solrwatch index in elasticsearch.


