Everything that glitters ain't fishscale
-- MF Doom - Figaro, Album: Madvillain
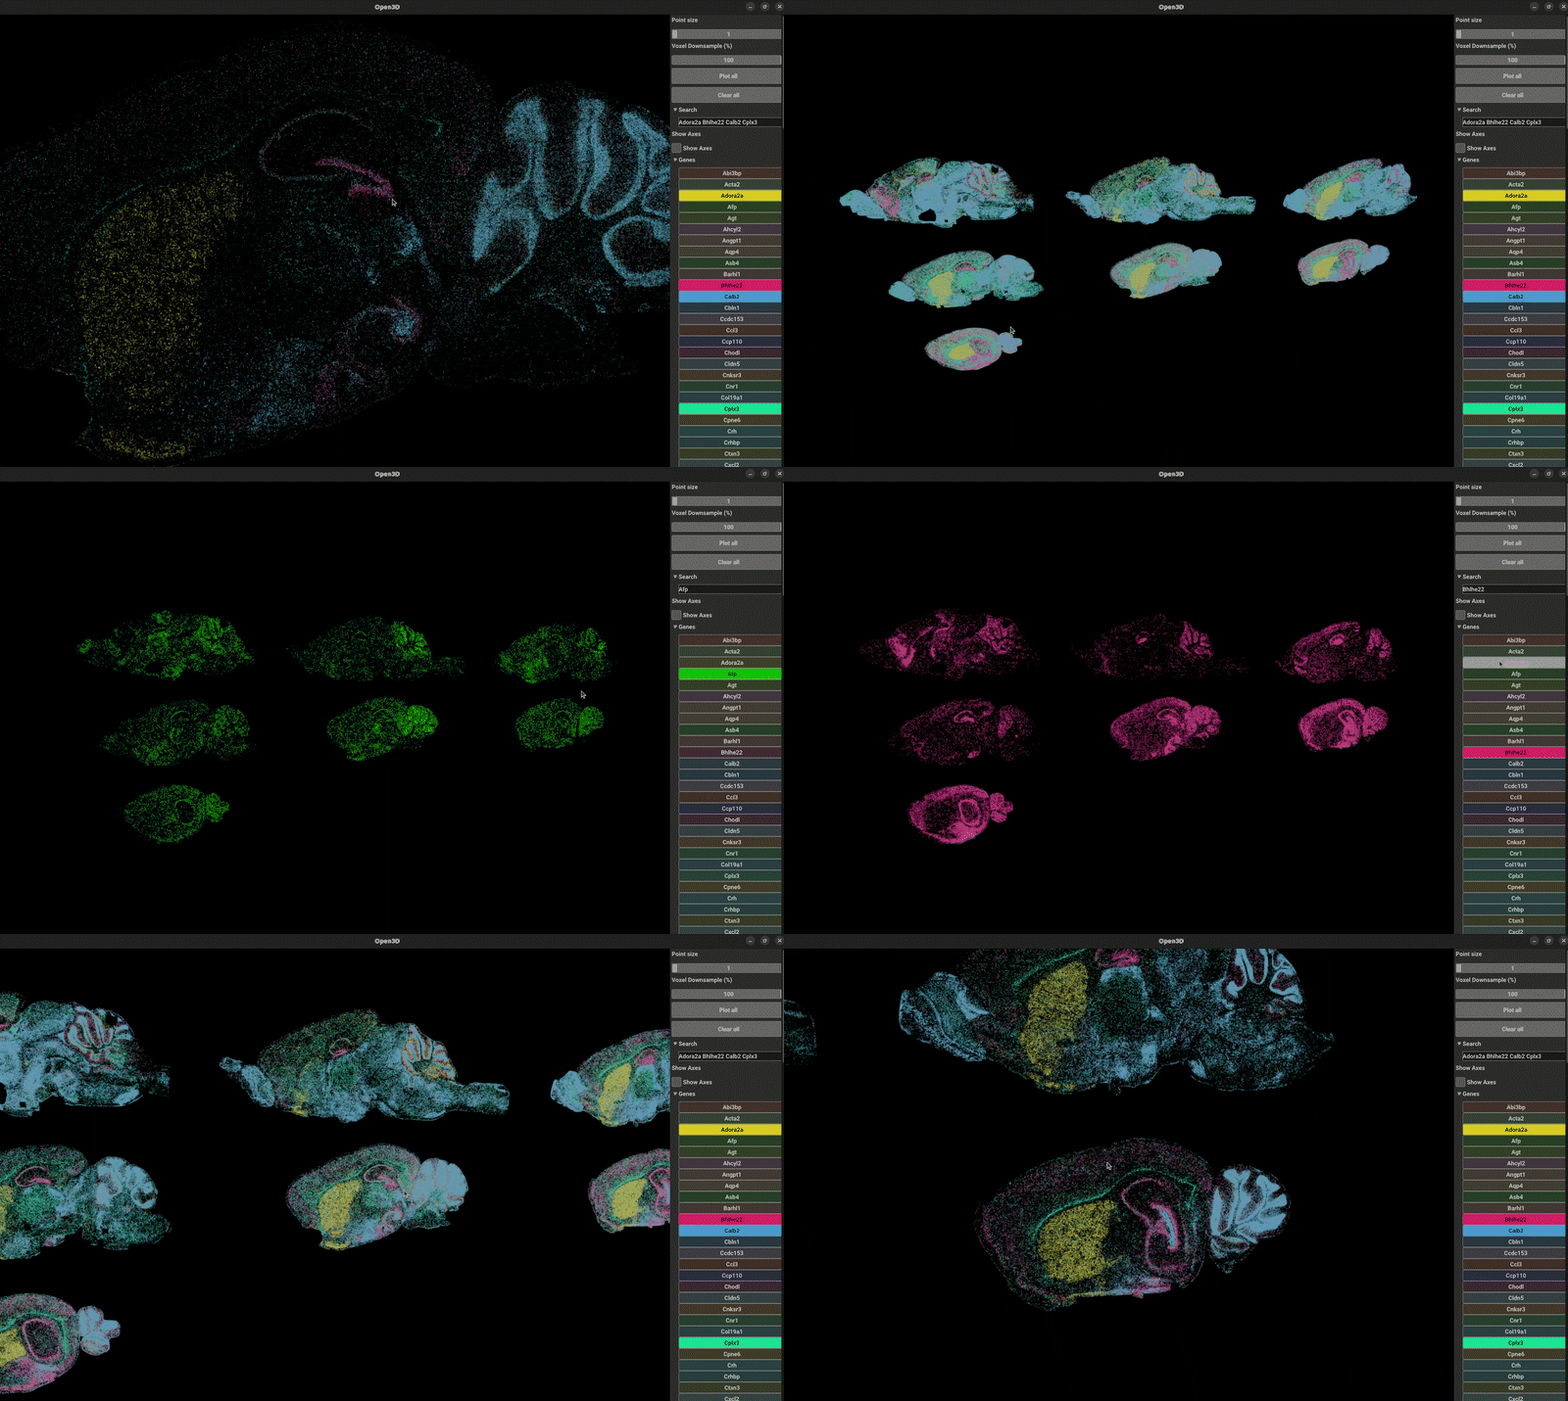
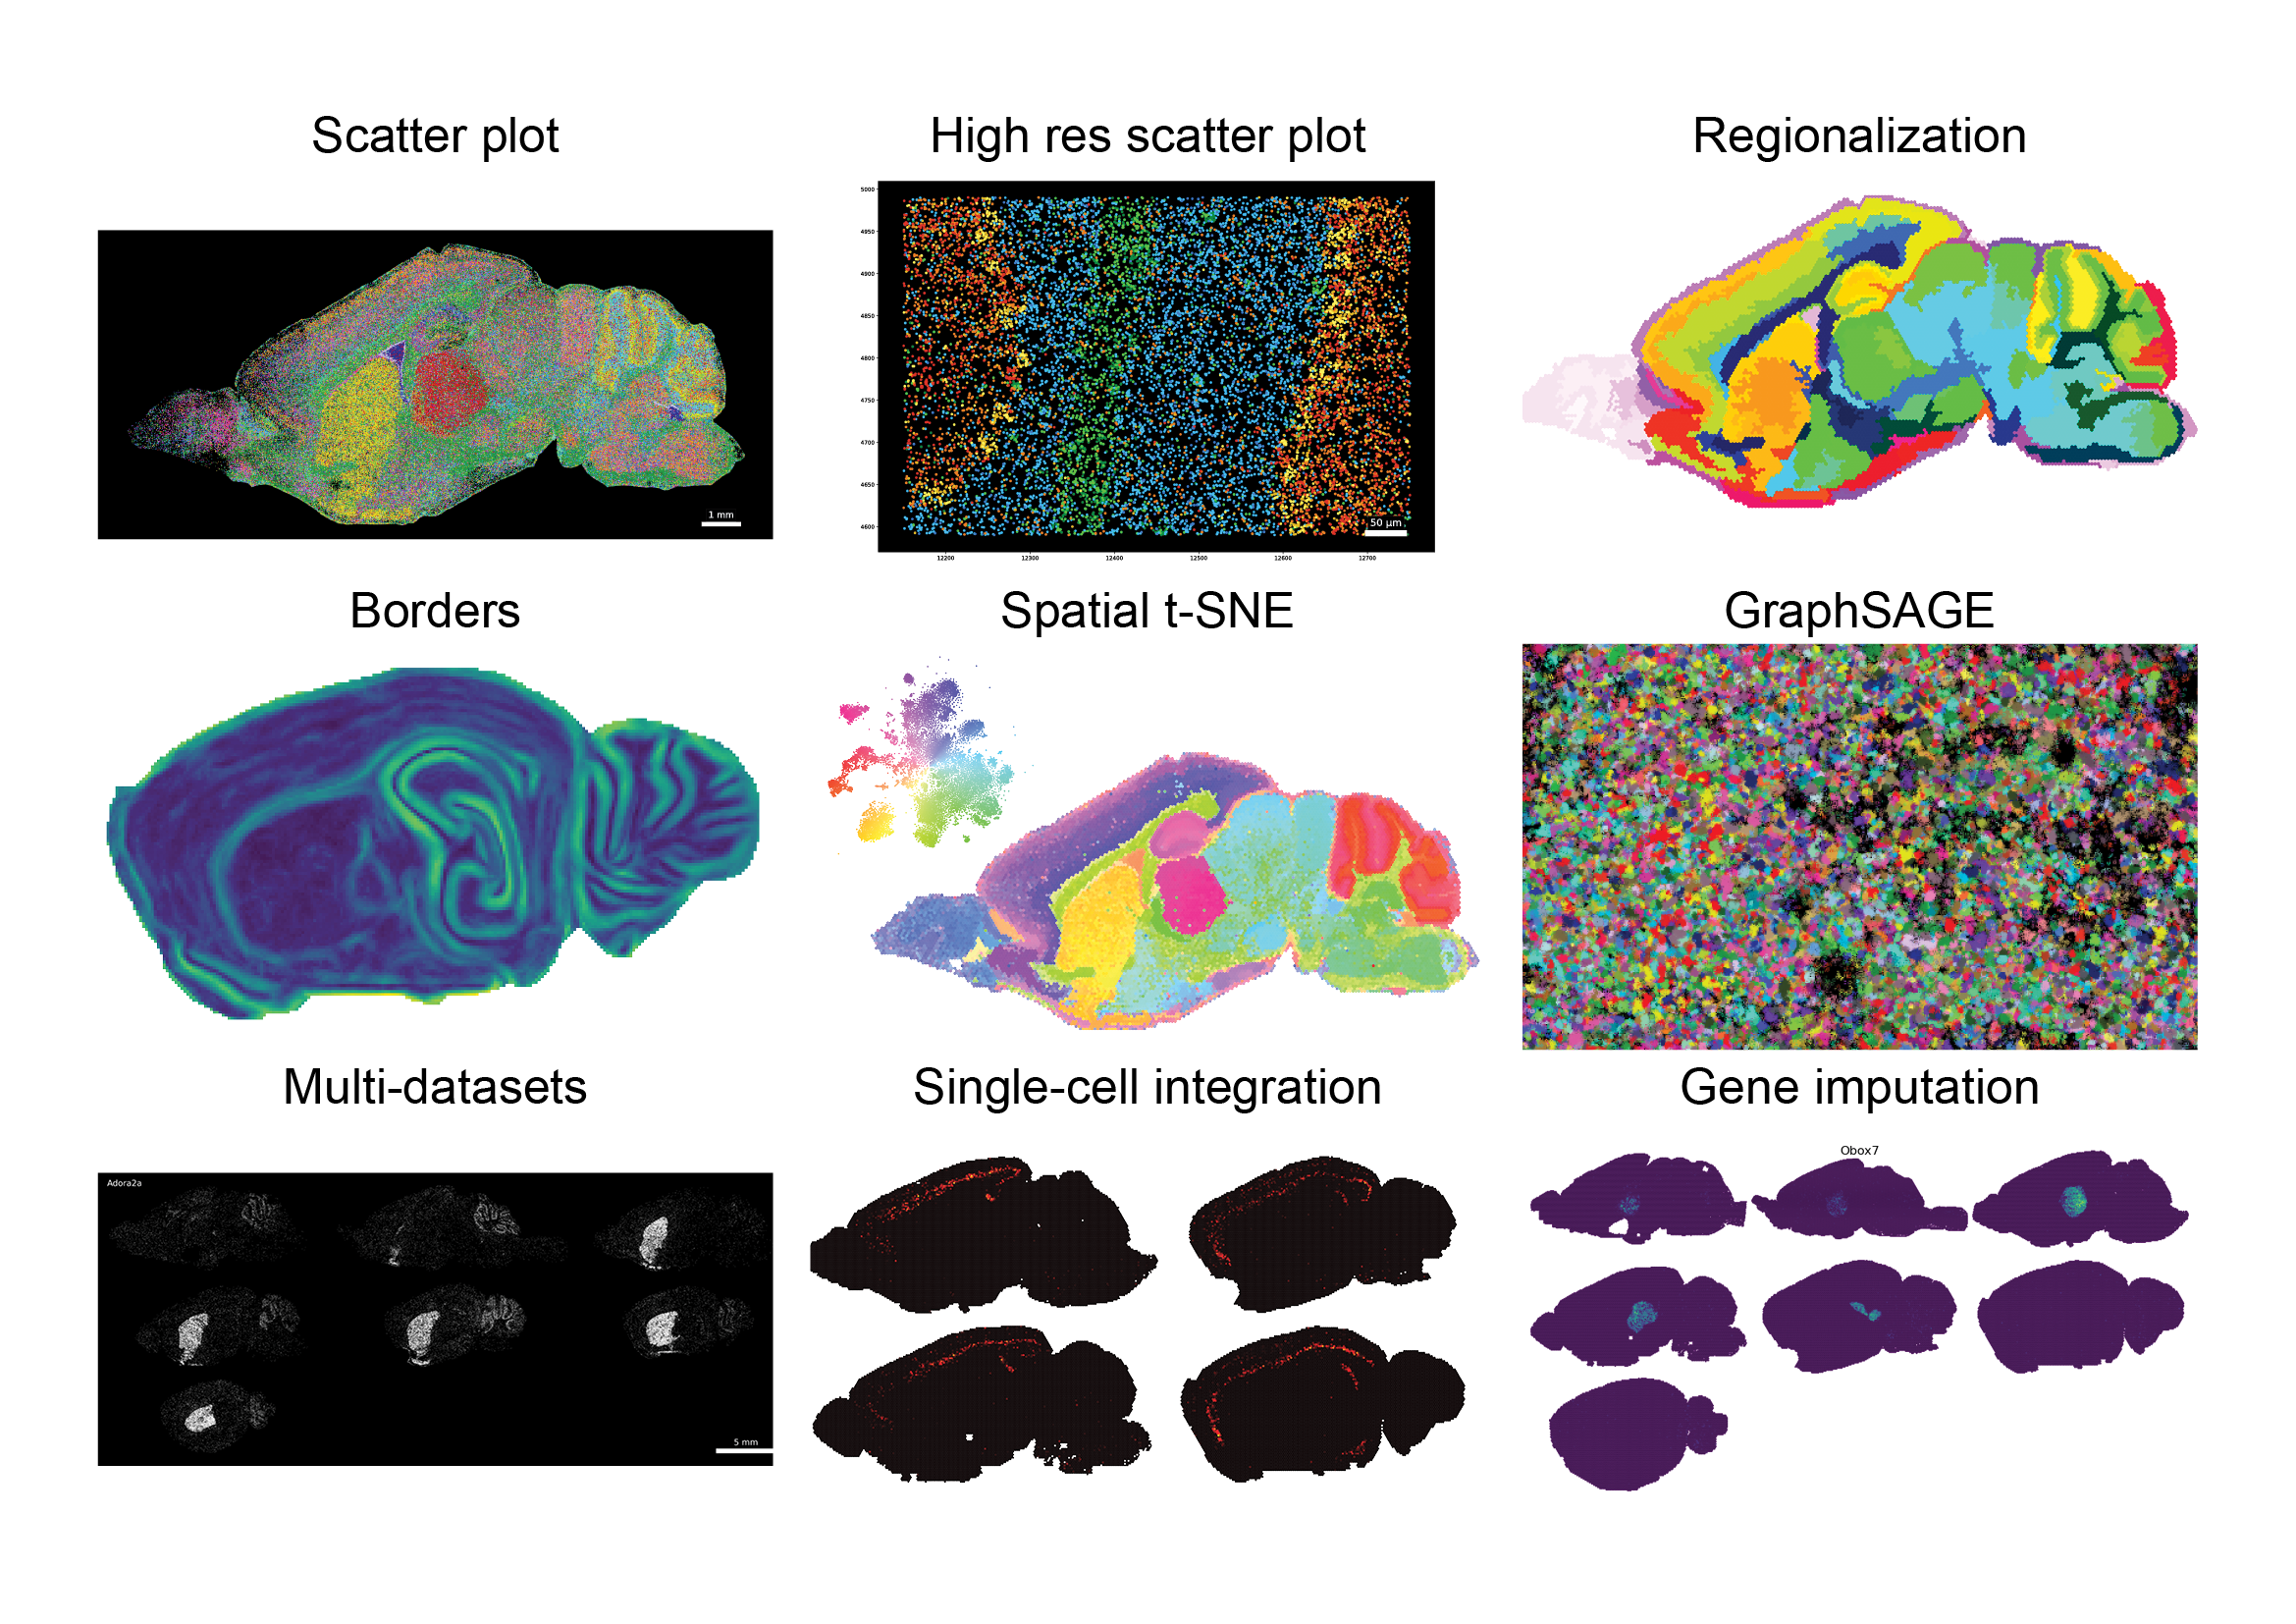
Software package for the visualization, exploration and analysis of point based spatial transcriptomics data. FISHscale can load single or multiple datasets.
FISHscale is made for the future with ever increasing dataset size, and where multiple datasets need to be jointly analyzed. FISHscale uses Dask to store all data on disk and only loads what it needs to make analysis memory efficient.
The following instructions should work for Linux and Mac, and probably also Windows.
Make a fresh Anaconda environment: (Open3D does not work with python 3.10)
conda create --name my_env python=3.7
conda activate my_env
Then install FISHscale:
git clone https://github.com/linnarsson-lab/FISHscale.git
cd FISHscale
pip install -e .
You can download all data realated to the EEL FISH paper from FigShare and use it as example data.
Use the single-dataset notebook to get started with single datasets.
If you want to use multiple datasets, use the multi-dataset notebook to get started with multi-dataset objects.
If the visualizer does not open the window after calling .visualize(), please follow these steps:
- Uninstall Open3D:
pip uninstall open3d - Build Open3D from source using these instructions: Open3D

