#Traffic Sign Recognition
#Medium blog : https://medium.com/towards-data-science/identifying-traffic-signs-with-deep-learning-5151eece09cb
Build a Traffic Sign Recognition Project
The goals / steps of this project are the following:
- Load the data set (see below for links to the project data set)
- Explore, summarize and visualize the data set
- Design, train and test a model architecture
- Use the model to make predictions on new images
- Analyze the softmax probabilities of the new images
- Summarize the results with a written report
###Here I will consider the rubric points individually and describe how I addressed each point in my implementation.
###Writeup / README
####Following is the link to my project code .
###Data Set Summary & Exploration
####1. Numpy library is used to calculate summary statistics of the traffic signs data set:
- The size of training set is 34799
- The size of the validation set is 4410
- The size of test set is 12630
- The shape of a traffic sign image is 32, 32, 3
- The number of unique classes/labels in the data set is 43
####2. Exploratory visualization of the dataset.
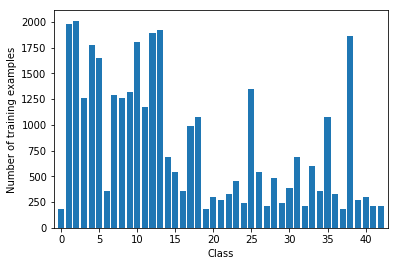
Here is an exploratory visualization of the data set. It is a bar chart showing the distribution of frequency of images on Y axis and their corresponding labels on X axis.
Some of the classes are highly underrepresented. Few classes have less number of data points. Future work can include generating multiple training data using flips and other techniques. At present , given data is used as it is.
###Design and Test a Model Architecture
####1. As a first step, image preprocessing was done to grayscale and further scale pixel in between 0 and 1.
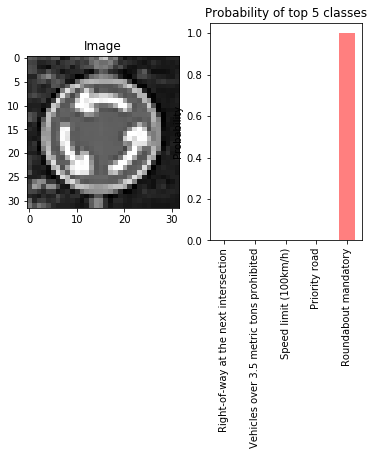
Using grayscale as color information does not give more information which further helps to solve the problem. As a property of image , edges and intensity are important with repect to this problem. Here is an example of a traffic sign image after grayscaling and its classification .
####2. Following is the architecture of first cut of the model used in this project.
Model consisted of the following layers:
| Layer | Description |
|---|---|
| Input | 32x32x1 grayscale image |
| Convolution | 1x1 stride, valid padding |
| RELU | |
| Max pooling | 2x2 stride, same padding |
| Dropout | .90,propbability to keep units |
| Convolution | 1x1 stride , valid padding |
| RELU | |
| Max pooling | 2x2 stride, same padding |
| Dropout | .80,propbability to keep units |
| Flatten | |
| multiply weight bias | Add bias after weight are multiplied |
| RELU | |
| Dropout | .70,propbability to keep units |
| Full connection | |
| multiply weight bias | Add bias after weight are multiplied |
| RELU | |
| Dropout | .60,propbability to keep units |
| DENSE | |
| RELU | |
####3. Model Training
Model was trained using following major parameters
- EPOCHS = 40 # can be increased to see the effects
- BATCH_SIZE = 128 # Due to memory constrained restricted to 128
- Learn rate = 0.001
- optimizer = tf.train.AdamOptimizer(learning_rate = rate)
- tf.truncated_normal for weight initialization
####4. Approach
Initially color images were used as it is in LeNet architecture , converting them to Grayscale improved the accuracy.
Learn rate was initially setto 0.0001 and epochs was set to 100 , later learn rate was increased to 0.001 and 0.1. O.001 converges to better result faster as compared to latter. 0.1 doesnot give high accuracy as it gets stuck in local optima.
Batch size was increased to 256 but it was resource intensive. However no major improvement in validation accuracy was observed while increasing the batch size to 256
Final model results were:
- validation set accuracy of 91.2%
- test set accuracy of 85.4%
###Model testing on New Images
####1. German traffic signs were taken from the web for the classification to see how model performs on new images.
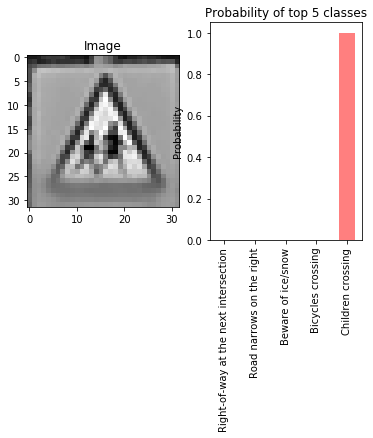
There were 38 new images found on the web ,here are five of them:
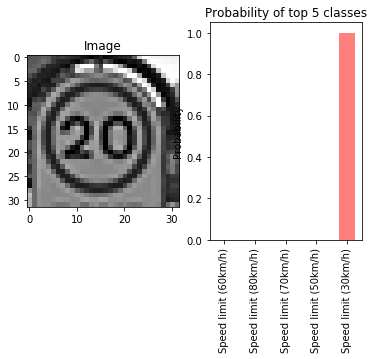
Fourth image might be difficult to classify because there are very few training examples for category 0 "speed limit 20 km/h"
####2. Following is the grayscaled version of image and prediction chart which shows the probability of classification on each category.
Here are the results of the prediction:


