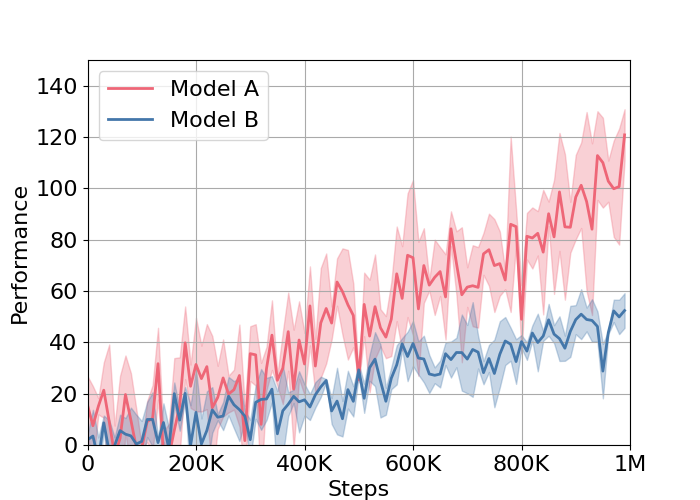
Auxiliary codes for generating 2D plots of learning curves. Mainly intended as a personal use. I can't come up with a better repository name
Running this script only requires matplotlib, which can be installed via pip install matplotlib.
Fill in the parameters in plot_config.json as needed. Currently, the configuration is set up to draw the curves for example data in log folder. The details for the arguments in plot_config.json is below in Configuration File section.
Also, change the parse_func function in plot.py such that it receives a file path, parses the file into a list of x values and a list of y values, and returns those lists.
After setting up the configurations, run the plotting code as below:
python plot.py
The output curves and logs will be saved in
"<prefix><current date>_<current time><suffix>".
This is img/<datetime> directory by default.
The prefix and the suffix can be altered by changing the
variables output_folder_prefix and output_folder_suffix in plot.py. For example,
output_folder_prefix can specify the directory, and output_folder_suffix can be used to indicate the name of the experiment.
The overall format of the plot file plot_config.json is below.
{
    "exp_note": "...",
    "tasks": {
        "task_name_1": {
            ...
        },
        "task_name_2": {
            ...
        }
    }
}
The detailed explanations of the arguments are below.
"exp_note": Notes can be added here to indicate what the generated curve is about. These notes are written in the generated log file, along with other arguments provided."task_name_1","task_name_2": Name of the tasks. Generated curve image files will be named as the name of the task.- Within the dictionary of each of the tasks, the following arguments are accepted:
| Argument name | Type | Description |
|---|---|---|
"min_updates" |
int |
Lower bound of the x point for interpolation. Note that this must be higher than or equal to the minimum x value in the data. Please be cautious that this is not related to the displayed x axis boundary, which is instead controlled by xaxis_bound argument. |
"max_updates" |
int |
Upper bound of the x point for interpolation. Please be cautious that this is not related to the displayed x axis boundary, which is instead controlled by xaxis_bound argument. |
"interval" |
int |
Interval between x points to interpolate to. |
"xaxis_bound" |
[float, float] |
Pair of values indicating the x axis boundary to display. |
"yaxis_bound" |
[float, float] |
Pair of values indicating the y axis boundary to display. |
"file_names" |
See description | A dictionary containing the curve name (e.g. the name of the model or treatment group) as key, and a list of file names as value. If multiple file names are provided, one curve will be drawn with the mean curve as the solid line and the standard deviation as the shaded region. |
"order" |
list of str |
The ordering of the curves indicated in file_names argument. This determines which color is matched to which curve, as well as the ordering in the legend. |
"font_size" |
optional, float |
Size of font. Defaults to 16. |
"fig_size" |
optional, [float, float] |
Size of figure. Adjust this if the axis labels are cut off by the figure boundary. Defaults to [7.0, 5.0]. |
"colors" |
optional, list of str |
Colors of curves. The order of colors should match the order of curves in file_names. Defaults to ["red", "blue", "purple", "yellow", "green"]. |
"color_blind" |
optional, bool |
Whether to use color-blindness-friendly version of the curve colors. Defaults to True. |
"line_width" |
optional, float |
Width of curve lines. Defaults to 2.0. |
"x_label" |
optional, str |
Label for x axis. Defaults to "x". |
"y_label" |
optional, str |
Label for y axis. Defaults to "y". |
"use_legend" |
optional, bool |
Whether to show legend. Defaults to True. |
"legend_loc" |
optional, str |
Location of the legend, if use_legend is True. For the list of possible values, please check the matplotlib documentation (link). Defaults to "upper left". |
"tick_format" |
optional, bool |
Whether to abbreviate numbers on axes (e.g. display as "500k" rather than "500,000"). Defaults to True. |
"draw_grid" |
optional, bool |
Whether to draw grids. Defaults to True. |
