This is systrace script for Linux Desktop/Server
python systrace -h
Usage: systrace [options]
Options:
| options | description |
|---|---|
| -h, --help | show this help message and exit |
| -o FILE | write HTML to FILE |
| -t N, --time=N | trace for N seconds |
| -b N, --buf-size=N | use a trace buffer size of N KB |
| -d, --disk | trace disk I/O (requires root) |
| -f, --cpu-freq | trace CPU frequency changes |
| -i, --cpu-idle | trace CPU idle events |
| -l, --cpu-load | trace CPU load |
| -s, --no-cpu-sched | inhibit tracing CPU scheduler (allows longer trace times by reducing data rate into buffer) |
| -w, --workqueue | trace the kernel workqueues (requires root) |
| -g, --gpu | trace GPU events |
| -e TRACE_EVENT, --trace-event=TRACE_EVENT | trace Custom events |
add ext4/block request parser from old systrace
add userspace support library integrate with policykit ftrace_tracing_mark
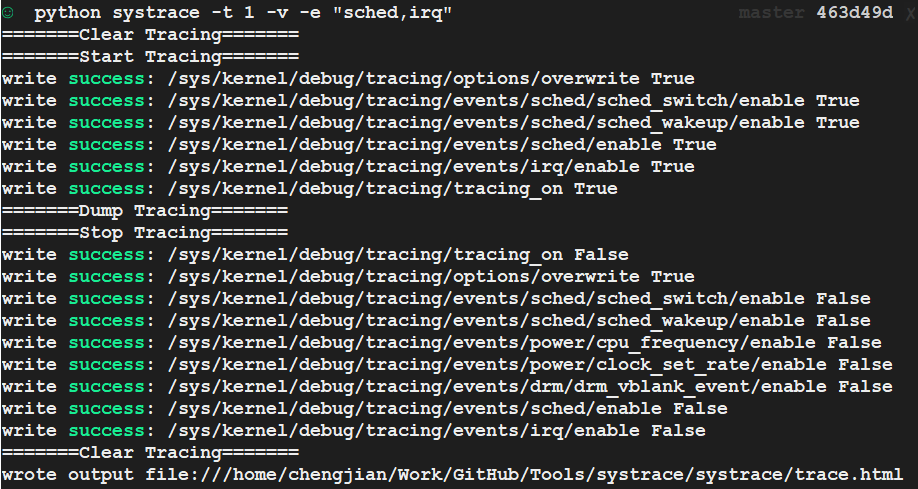
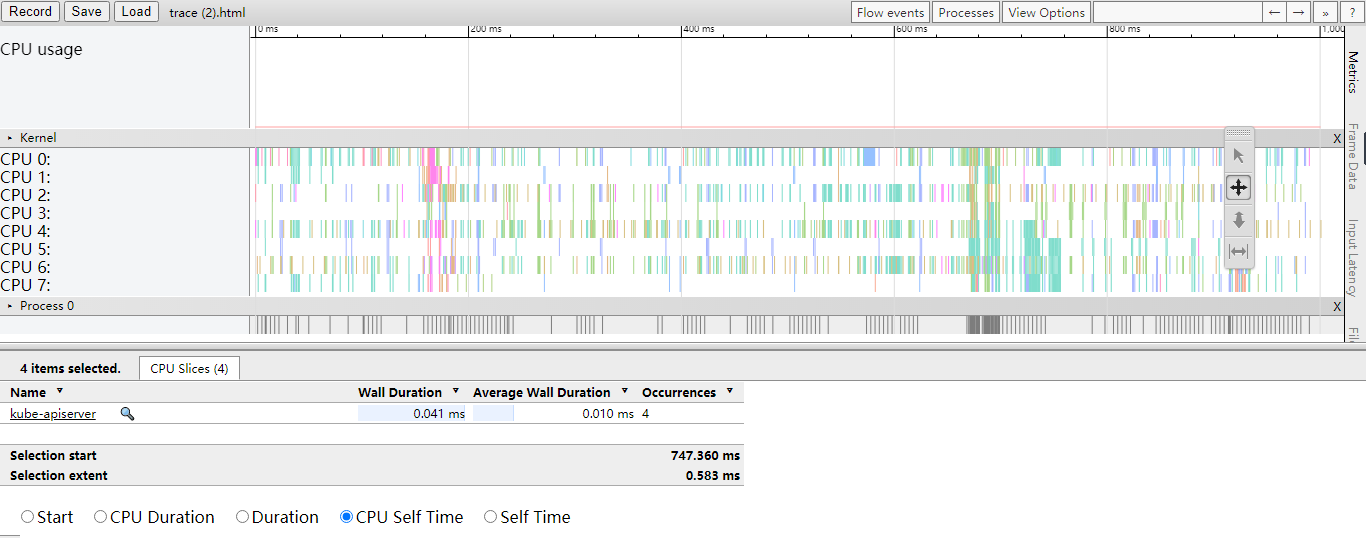
python systrace -t 1 -v -e "sched,irq"open your chrome tracing page chrome://tracing
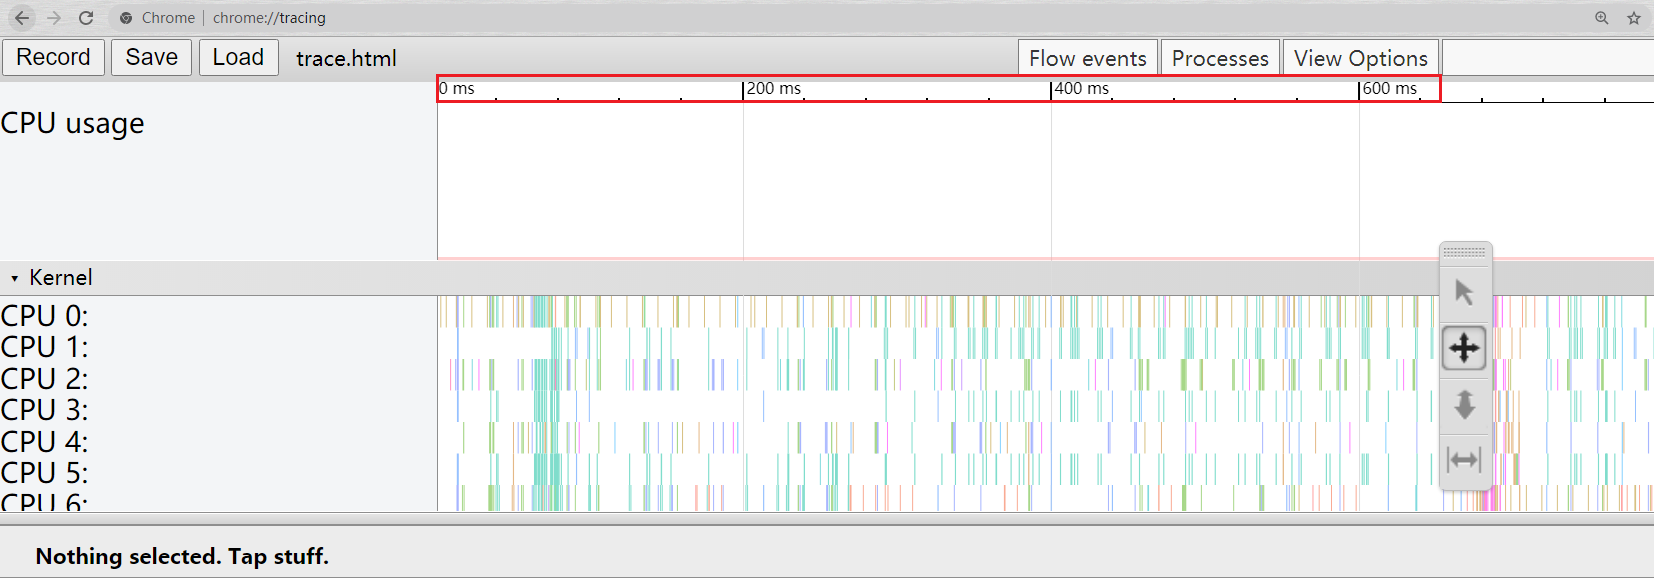
Drag trace.html into the chrome window
We can see that the time shown in the Trace-Viewer(systrace) is relative-time,
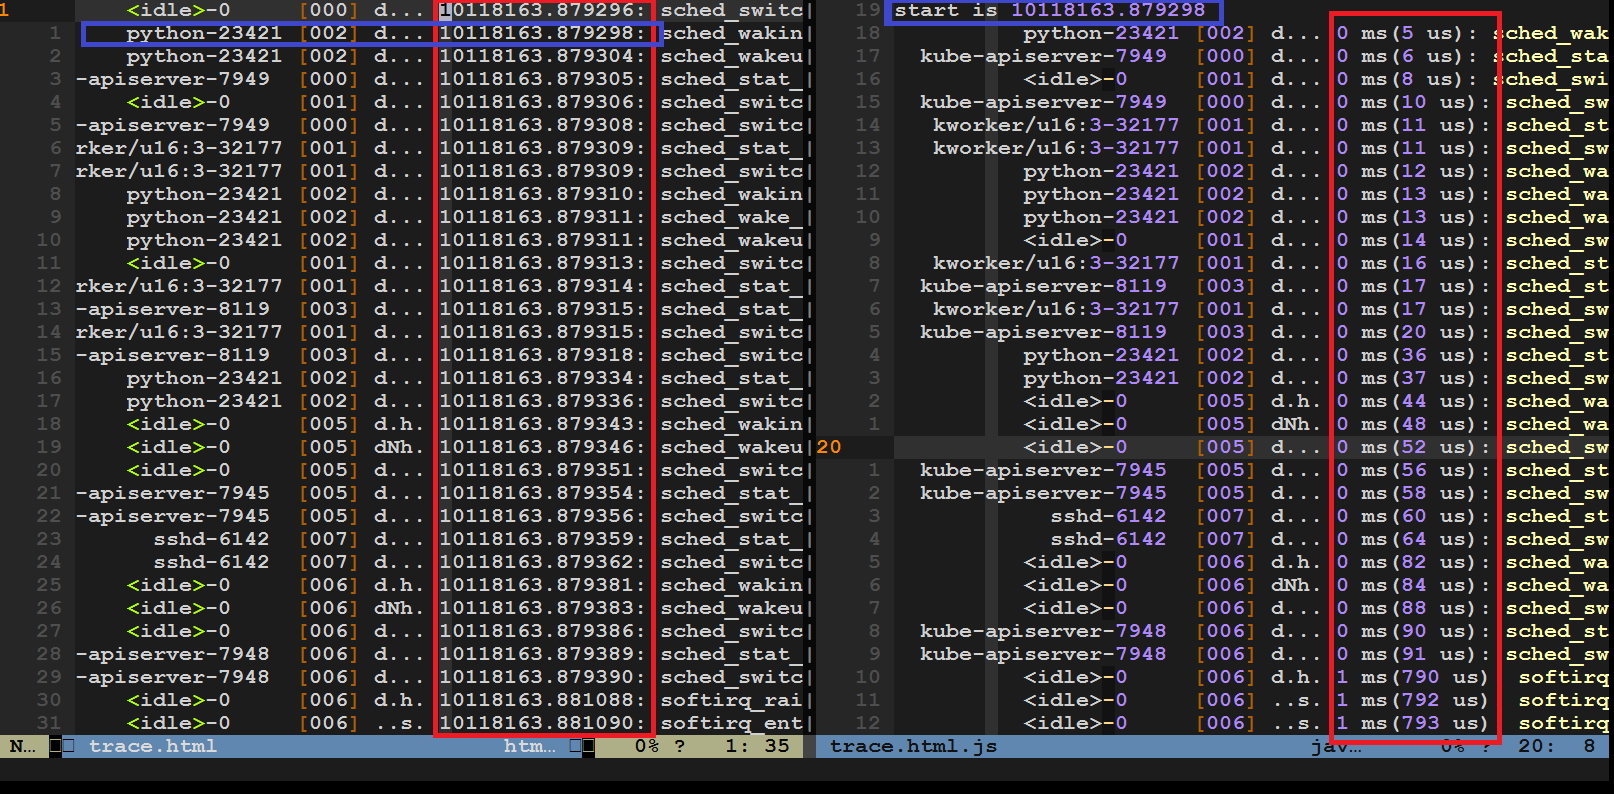
However, the time displayed in the ftrace dumping is the system time(absolute time).
Use the script fix_time.pl to adjust absolute-time to relative-time.
perl scripts/fix_time.pl ./trace.html trace.html.jsThe relative time is shown in the output file trace.html.js
Parser for Linux Ftrace (Android Systrace) logs for system power & performance analysis.


