I need to start working on the official documentation of this
So I began working on it around the first weeks of December 2022, with a lot of expectations. I thought this would be a one-week project and then I'd be done, but life surprised me by saying, "You thought I was feeling you? ha!" We had a class trip to Msa and final year project presentations the second week of December, final exams the third week, and Christmas the fourth week. So I restarted the project in January, around the 3rd, but because I had just finished school, I was super focused on landing a job by the end of the month. Life continues to hit me with the, sike!!!1 Anyway, I returned to the project. I gave up by the 5th day! I bet you're wondering why
As you can see, our mpesa statements are saved alongside our original transactions. Not in a way that will save you time on data cleaning. Imagine going through 9876 rows of data one by one, with your mpesa statement next to it, trying to figure out what you were paying for in that Till Number! Those were the difficulties. I'd end up paying over Kshs 800 to a till number with no record of what I was paying for!!!!!!!! How can I keep track of my expenses if I don't have proof of what I bought? As a result, I gave up. I wasn't going to be able to clean all of those rows by myself. Who me! Never!
I cleaned the 9876 rows, sat down every night for 30 minutes before bed, accessed my initial mpesa statement, accessed the 2022 calendar, and searched through my chats with friends to see whether I had mentioned going out or shopping to them. Luckily, I have a box with most of the receipts I receive after shopping, which is a good thing because it makes it easier for me to track my reward points. After ten days, I had finished renaming the rows. Let me give you a sneak preview, so I took it from this......
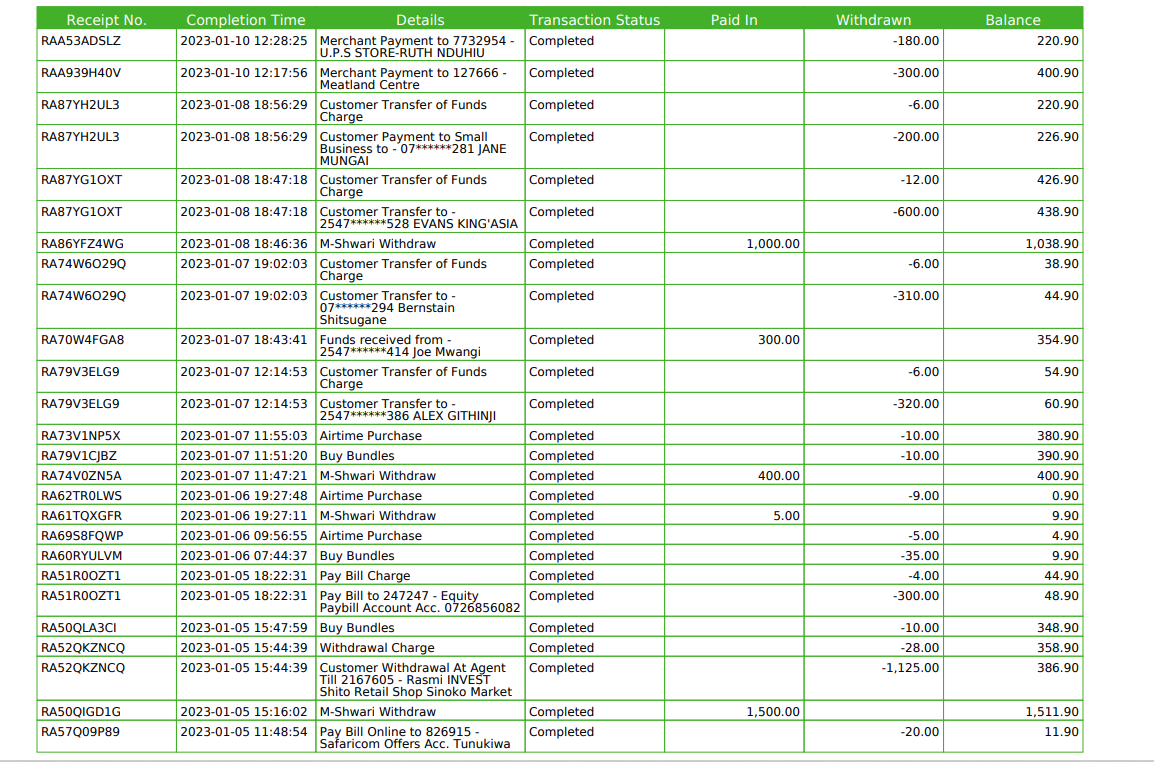
to this

After cleaning, I had the statement in the format I desired. It's similar to finishing the dirty job of cleaning squids, but now you're finished and can easily cook them according to your recipe. On to the next task, honestly I didn't need the time column. As a result, I dropped it. That was the first and only thing I did on the entire dataset. Safaricom's data team does an excellent job of making their data easy to work with. The following step is to extract months from the date column. That should be a simple task, right? After that, I just had to do some data analysis; if you notice the workbook names at the bottom of my excel screenshots, you can see the work I did. By the 20th of January, I had calculated my monthly expenses, income, and read a lot of money books about the financial situation of a 21-year-old me. Back to the interesting stuff, 21 pivot tables later, I actually continued working on the dashboard, but..... The plots, analysis, and tables were all fine; I just didn't like the design. Please correct me if I'm wrong, but this is how it appeared.
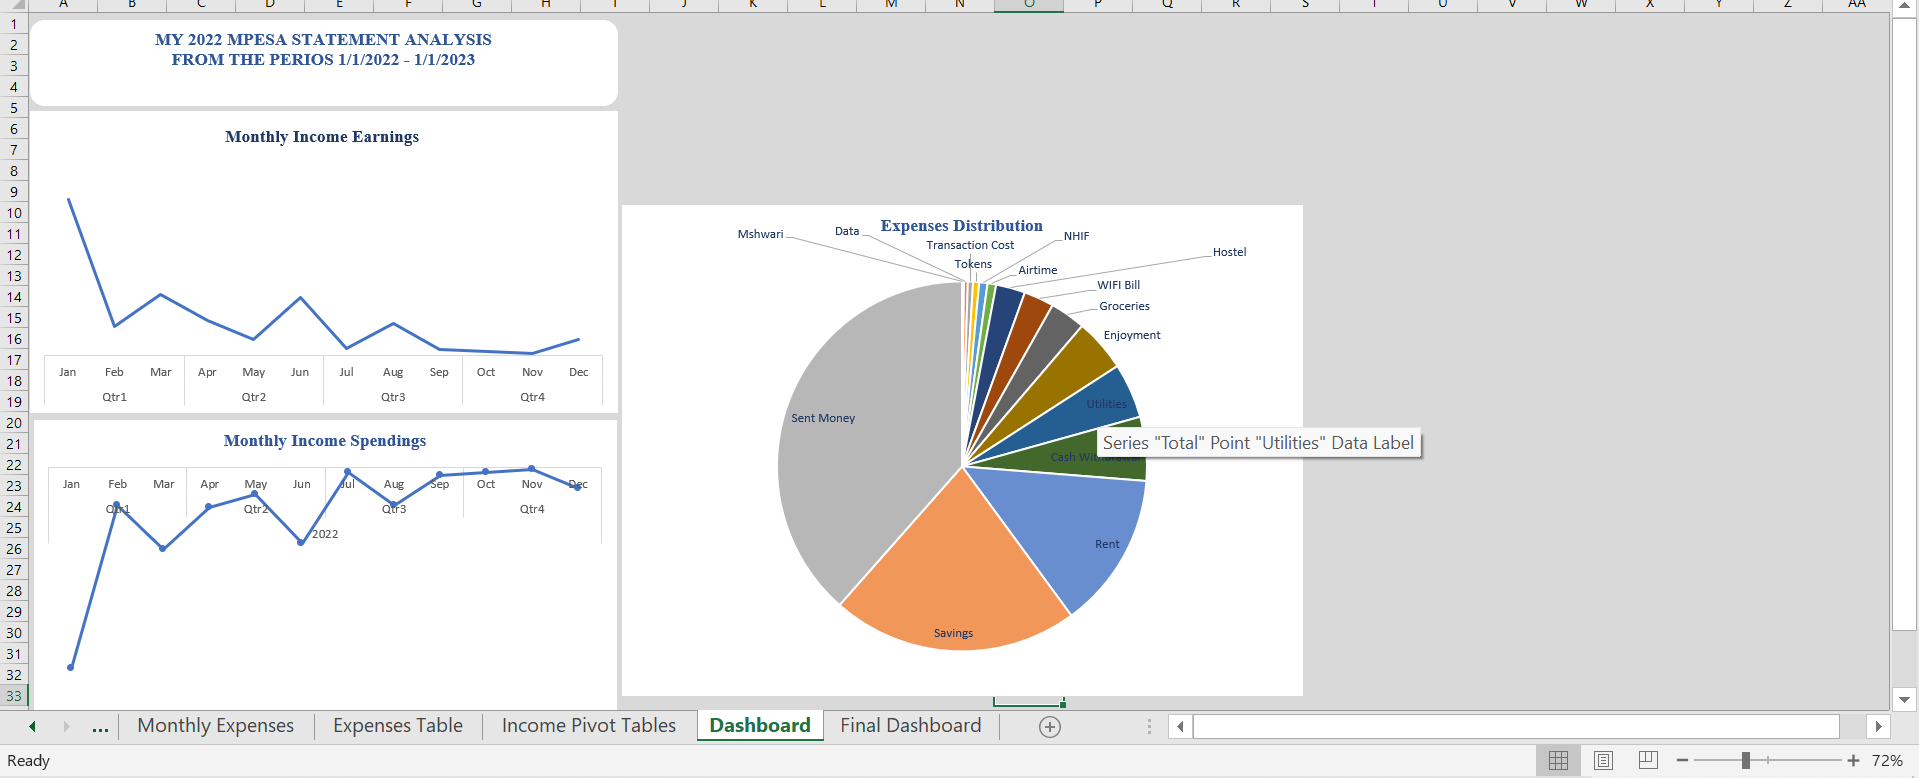
Let's be honest: wouldn't you want to make a statement for your first data analysis project? Right, go big or go home! So I took a break from Excel and went to the enchanted land known as the internet. After a few templates, I found one that stood out to me... and I worked with it. Call it a coincidence or luck, but the template included a tutorial on how to combine the shapes to form one large palette, which is basically the entire design.
So I woke up on the 22nd, opened a new Excel workbook, and began working on the dashboard design. It took me three hours to organize everything and compare what I wanted my dashboard to look like to the template I used as inspiration. I finished in 6 days. And this is the end result; this is what you see when you open the notebook. Page 1 includes the data and a connected slicer to filter the data in months, my final assessment of my network as of today, and some of the few things I wanted to know from my statement.

The actual work was completed here; oh, and by the way, I shaded the money spent on my expenses because I'm not ready to reveal how bankrupt I am. This was my favorite page because I uploaded some of my insights from the book "Psychology of Money."

Finally, the final page discusses how different I hope to be in 2023. What are my objectives, and, most importantly, can I afford a Z Flip Phone?

Enough rambling; I know you're probably asking why it took me a month to do all of this. As I mentioned when I began the narrative, I had goals for the month of January that I had to work toward. I did, however, make an effort to work on this project for at least 30 minutes each day. So from January 3rd to January 28th, I volunteered for 30 minutes. There are 780 minutes in all, which equates to 13 hours. And if you think of in that way, analyzing my financial statement only took me a half-day.