Experiments with adaptive instance normalization and tanh on chexpert and mimic
Uncertainties are labeled as negative.
Python 3.7 requirements.txt
Main file is main.py;
-
prepare CheXpert and MIMIC datasets in a directory - look at csv's in /data/2Label --> set arguement data_root to the path
-
set the lines 3,4 of the main.py accordingly if you use multiple GPUs. Default is for single-gpu. !!! Saving plots won't work in multi-gpu mode
-
for information on other arguments, look at main.py or use the help command :)
-
run main.py
If you get out of range in pandas iloc method, it is because the labels.npy is not suitable for the dataset. Just delete labels.npy and wait for it to generate a new one.
One more bug is in the .png generation that produces chromatic aberration-like artifacts (blue).
Feel free to report other known bugs.
This is a work in progress.
CSN converges such that the input to densenet is actually binarized image with per-image learned treshold. Currently the training is very unstable, CSN-Densenet best result after 30 epochs:
ROCAUC for Atelectasis is 0.7397375328083989
ROCAUC for Cardiomegaly is 0.8258689839572192
ROCAUC for Consolidation is 0.8818014705882353
ROCAUC for Edema is 0.8641369047619047
ROCAUC for Pleural Effusion is 0.8516757246376812
Multichannel version is more stable - the results below are only after the 2nd epoch. Models are from file models_multich.py:
ROCAUC for Atelectasis is 0.8493438320209974
ROCAUC for Cardiomegaly is 0.8695409982174689
ROCAUC for Consolidation is 0.9132352941176471
ROCAUC for Edema is 0.9171130952380953
ROCAUC for Pleural Effusion is 0.9004755434782609
After training for 8 epochs and averaging top10 AUCs:
Atelectasis AUC_avg: 0.848 MIN: 0.845 MAX: 0.856
Cardiomegaly AUC_avg: 0.872 MIN: 0.867 MAX: 0.890
Consolidation AUC_avg: 0.933 MIN: 0.930 MAX: 0.937
Edema AUC_avg: 0.908 MIN: 0.908 MAX: 0.913
Pleural Effusion AUC_avg: 0.911 MIN: 0.909 MAX: 0.913
Compared to baseline - just Densenet - from chexpert paper (U-zeros):
Atelectasis : 0.811 (0.751,0.872)
Cardiomegaly : 0.840 (0.783,0.897)
Consolidation : 0.932 (0.898,0.966)
Edema: 0.929 (0.888,0.970)
Pleural effusion: 0.931 (0.897,0.965)
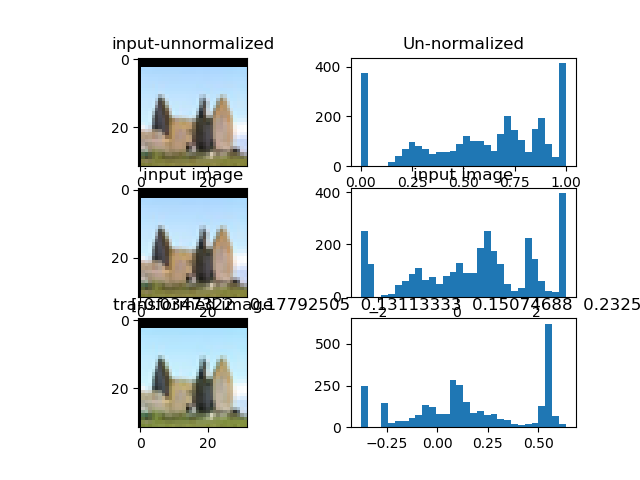
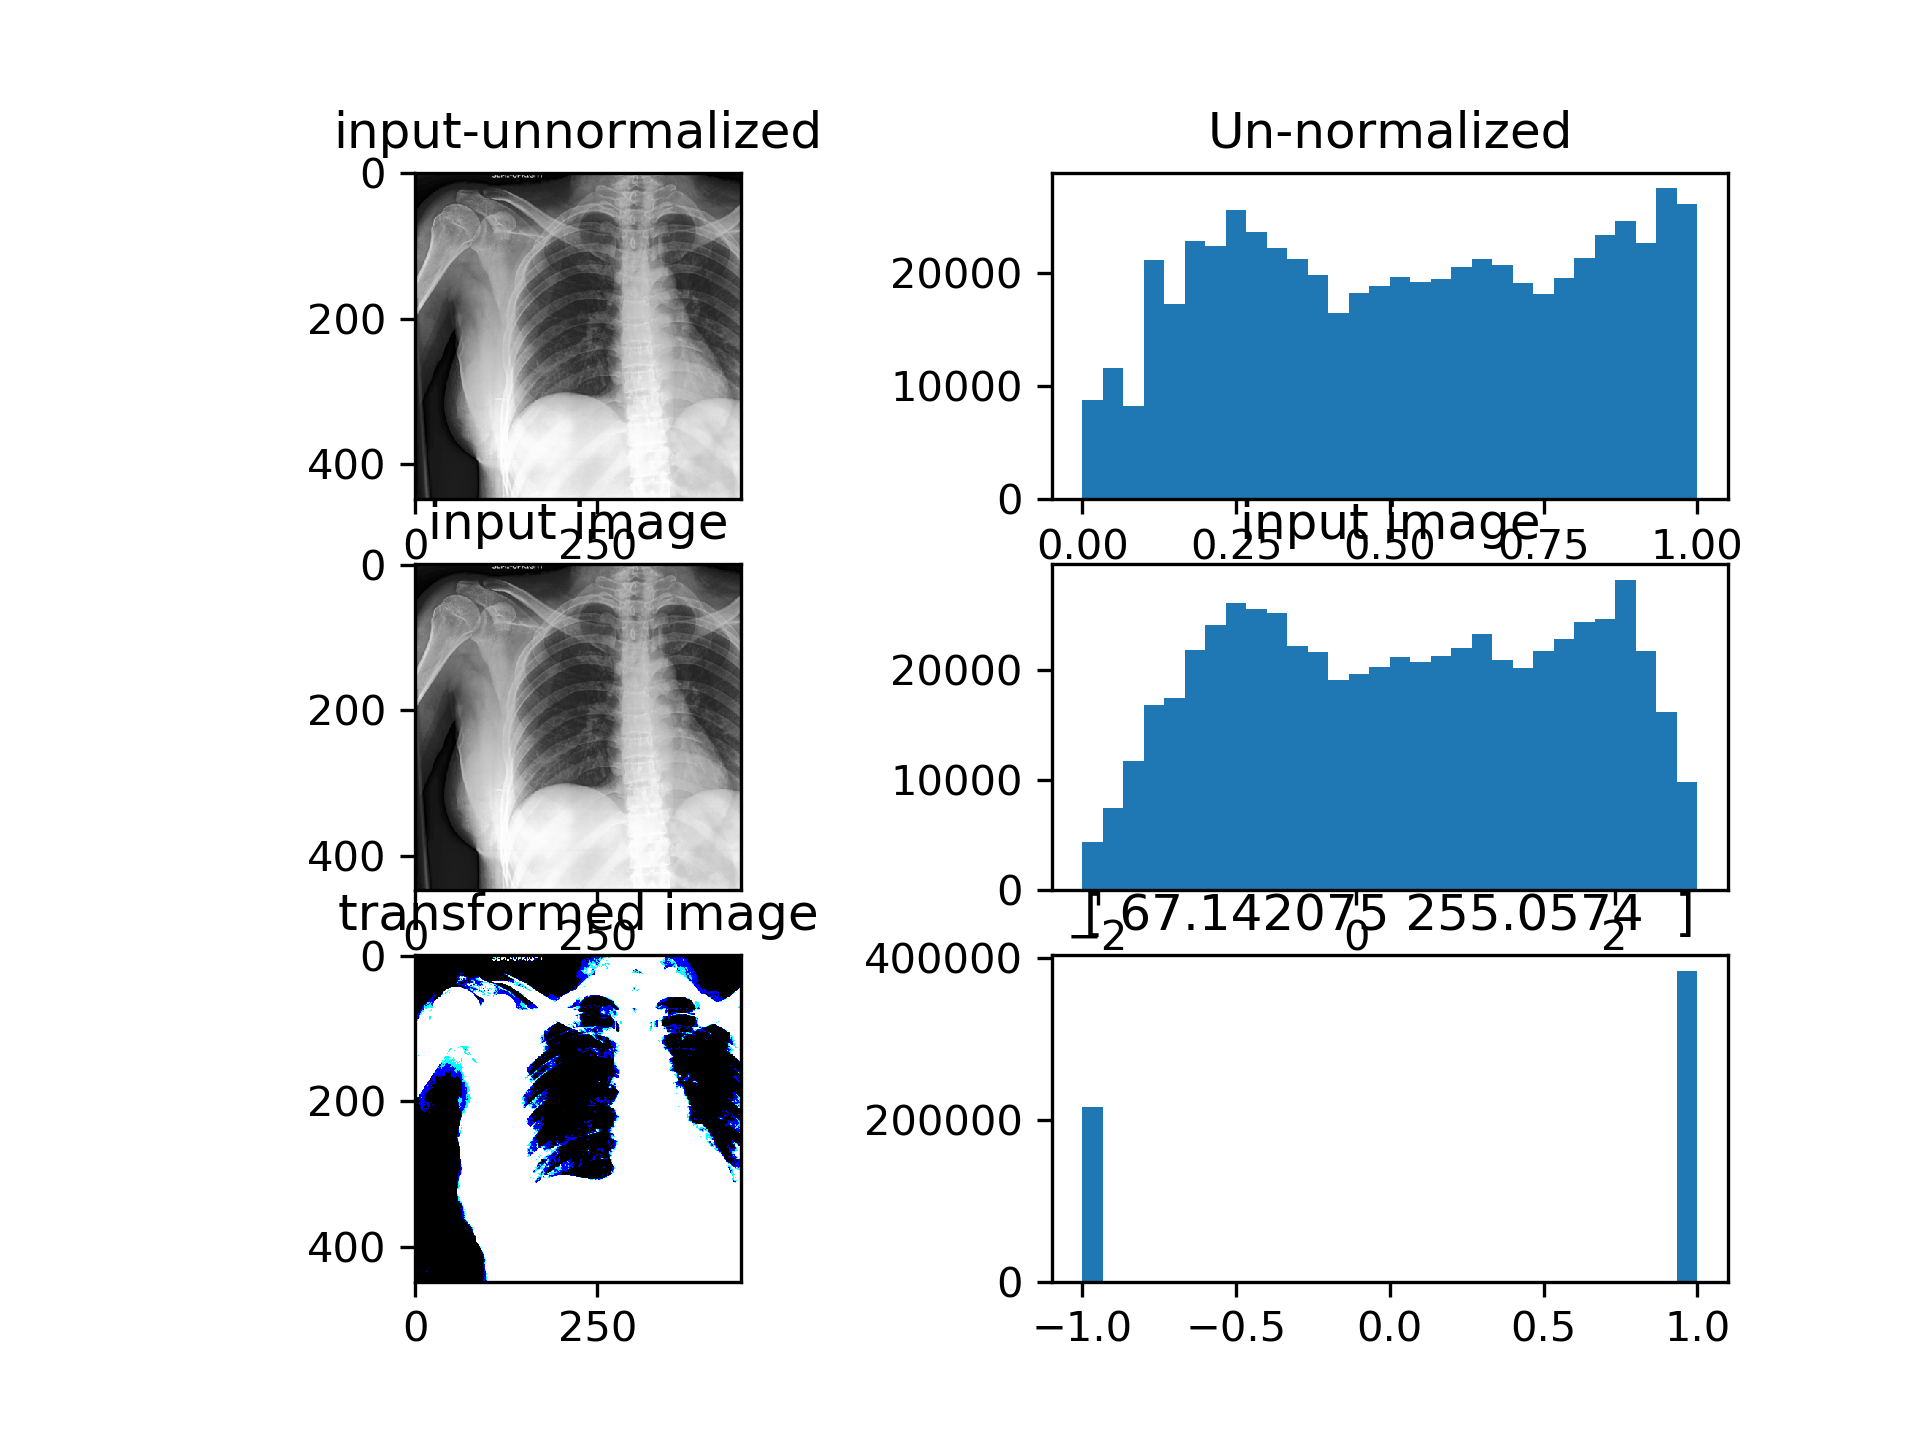
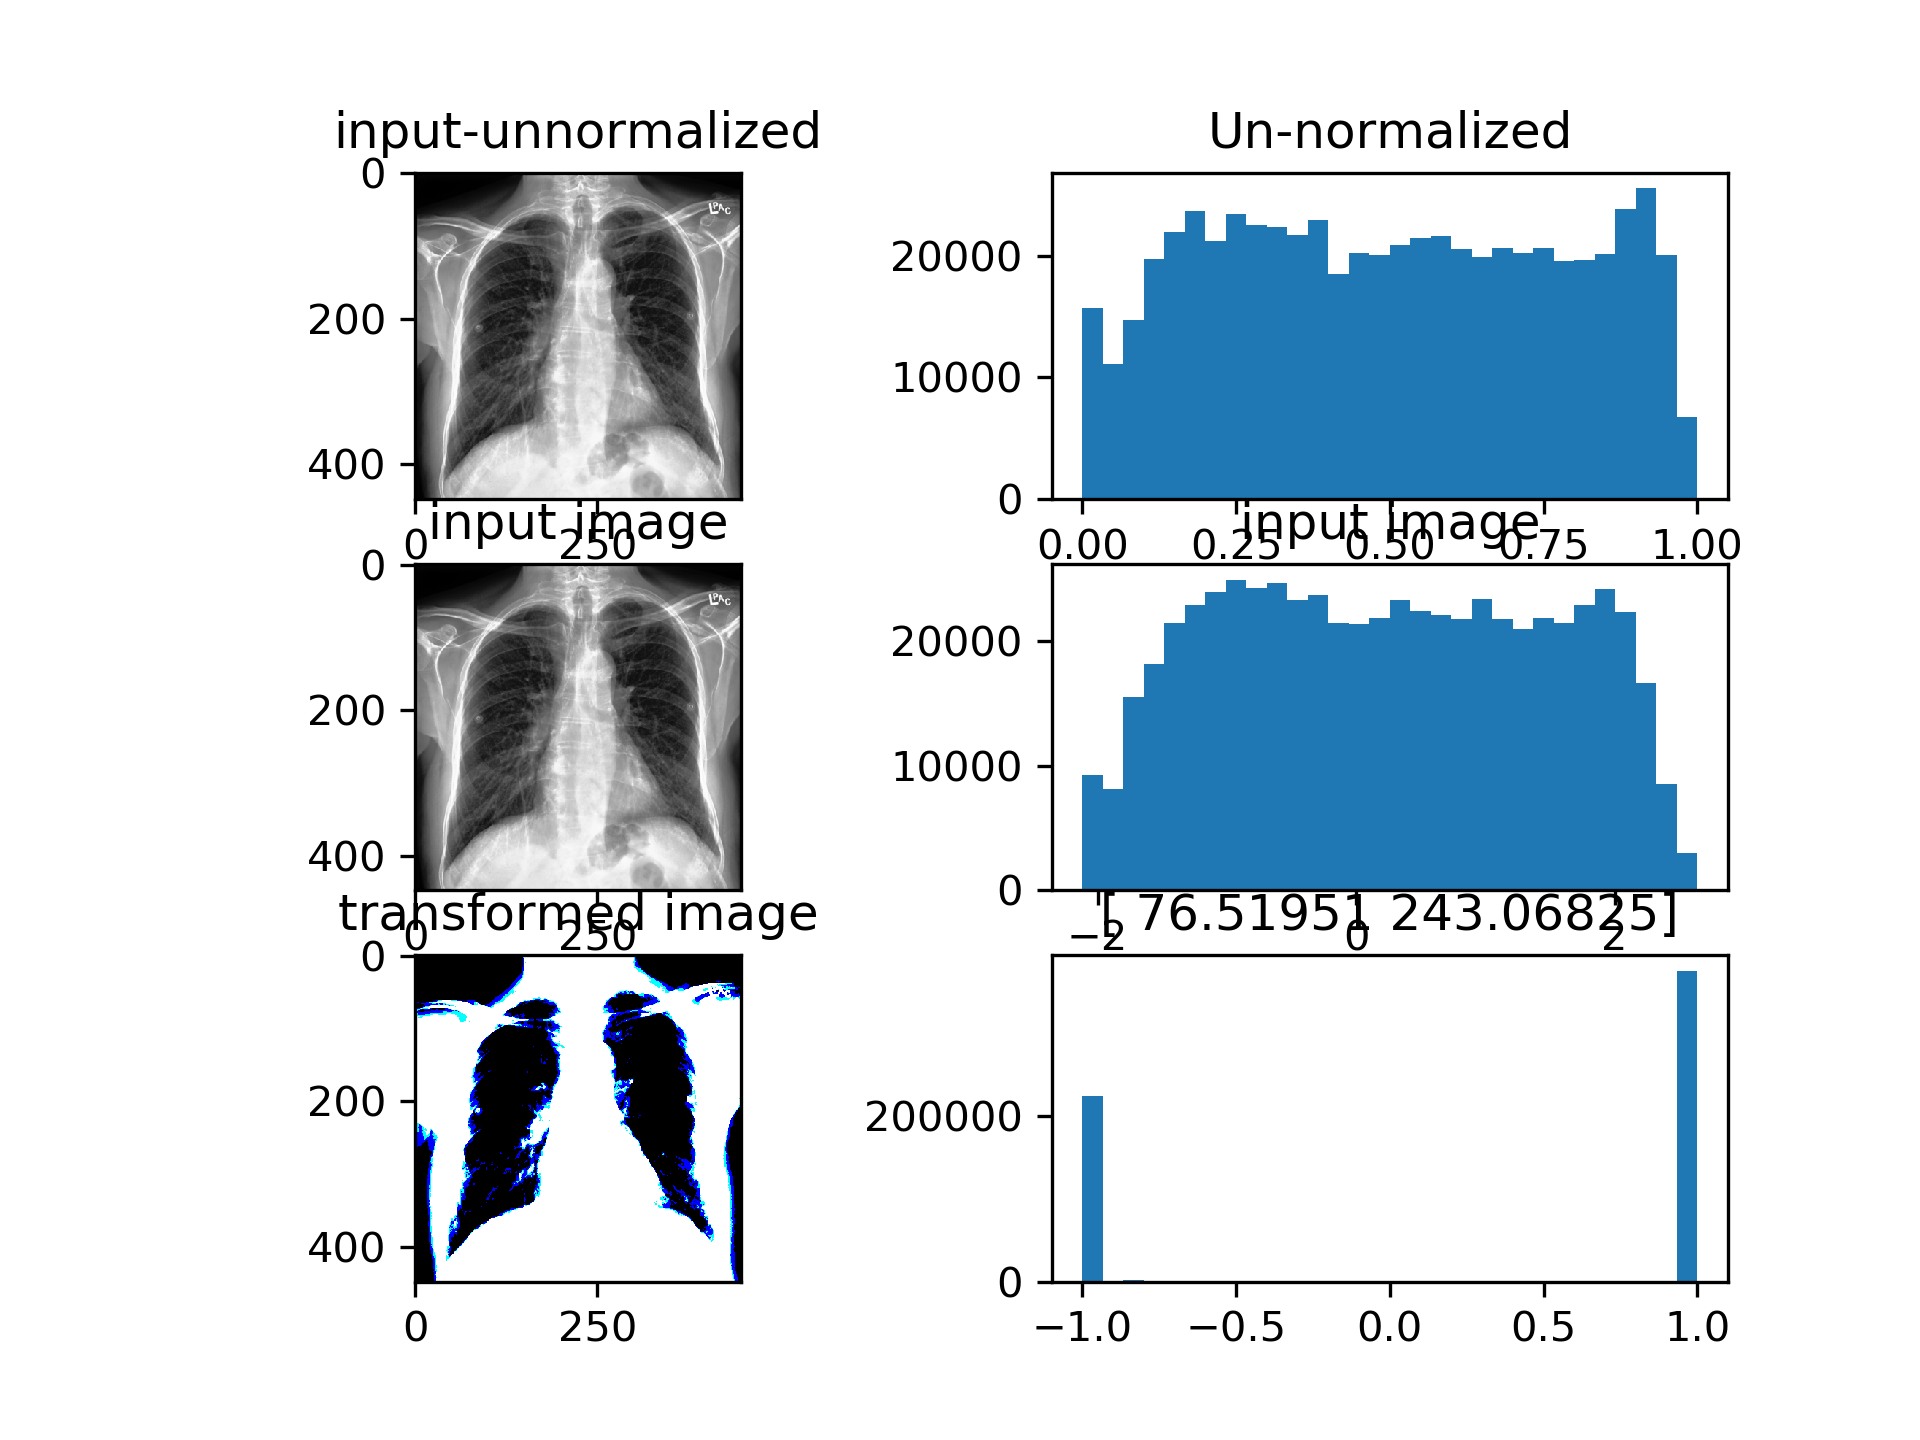
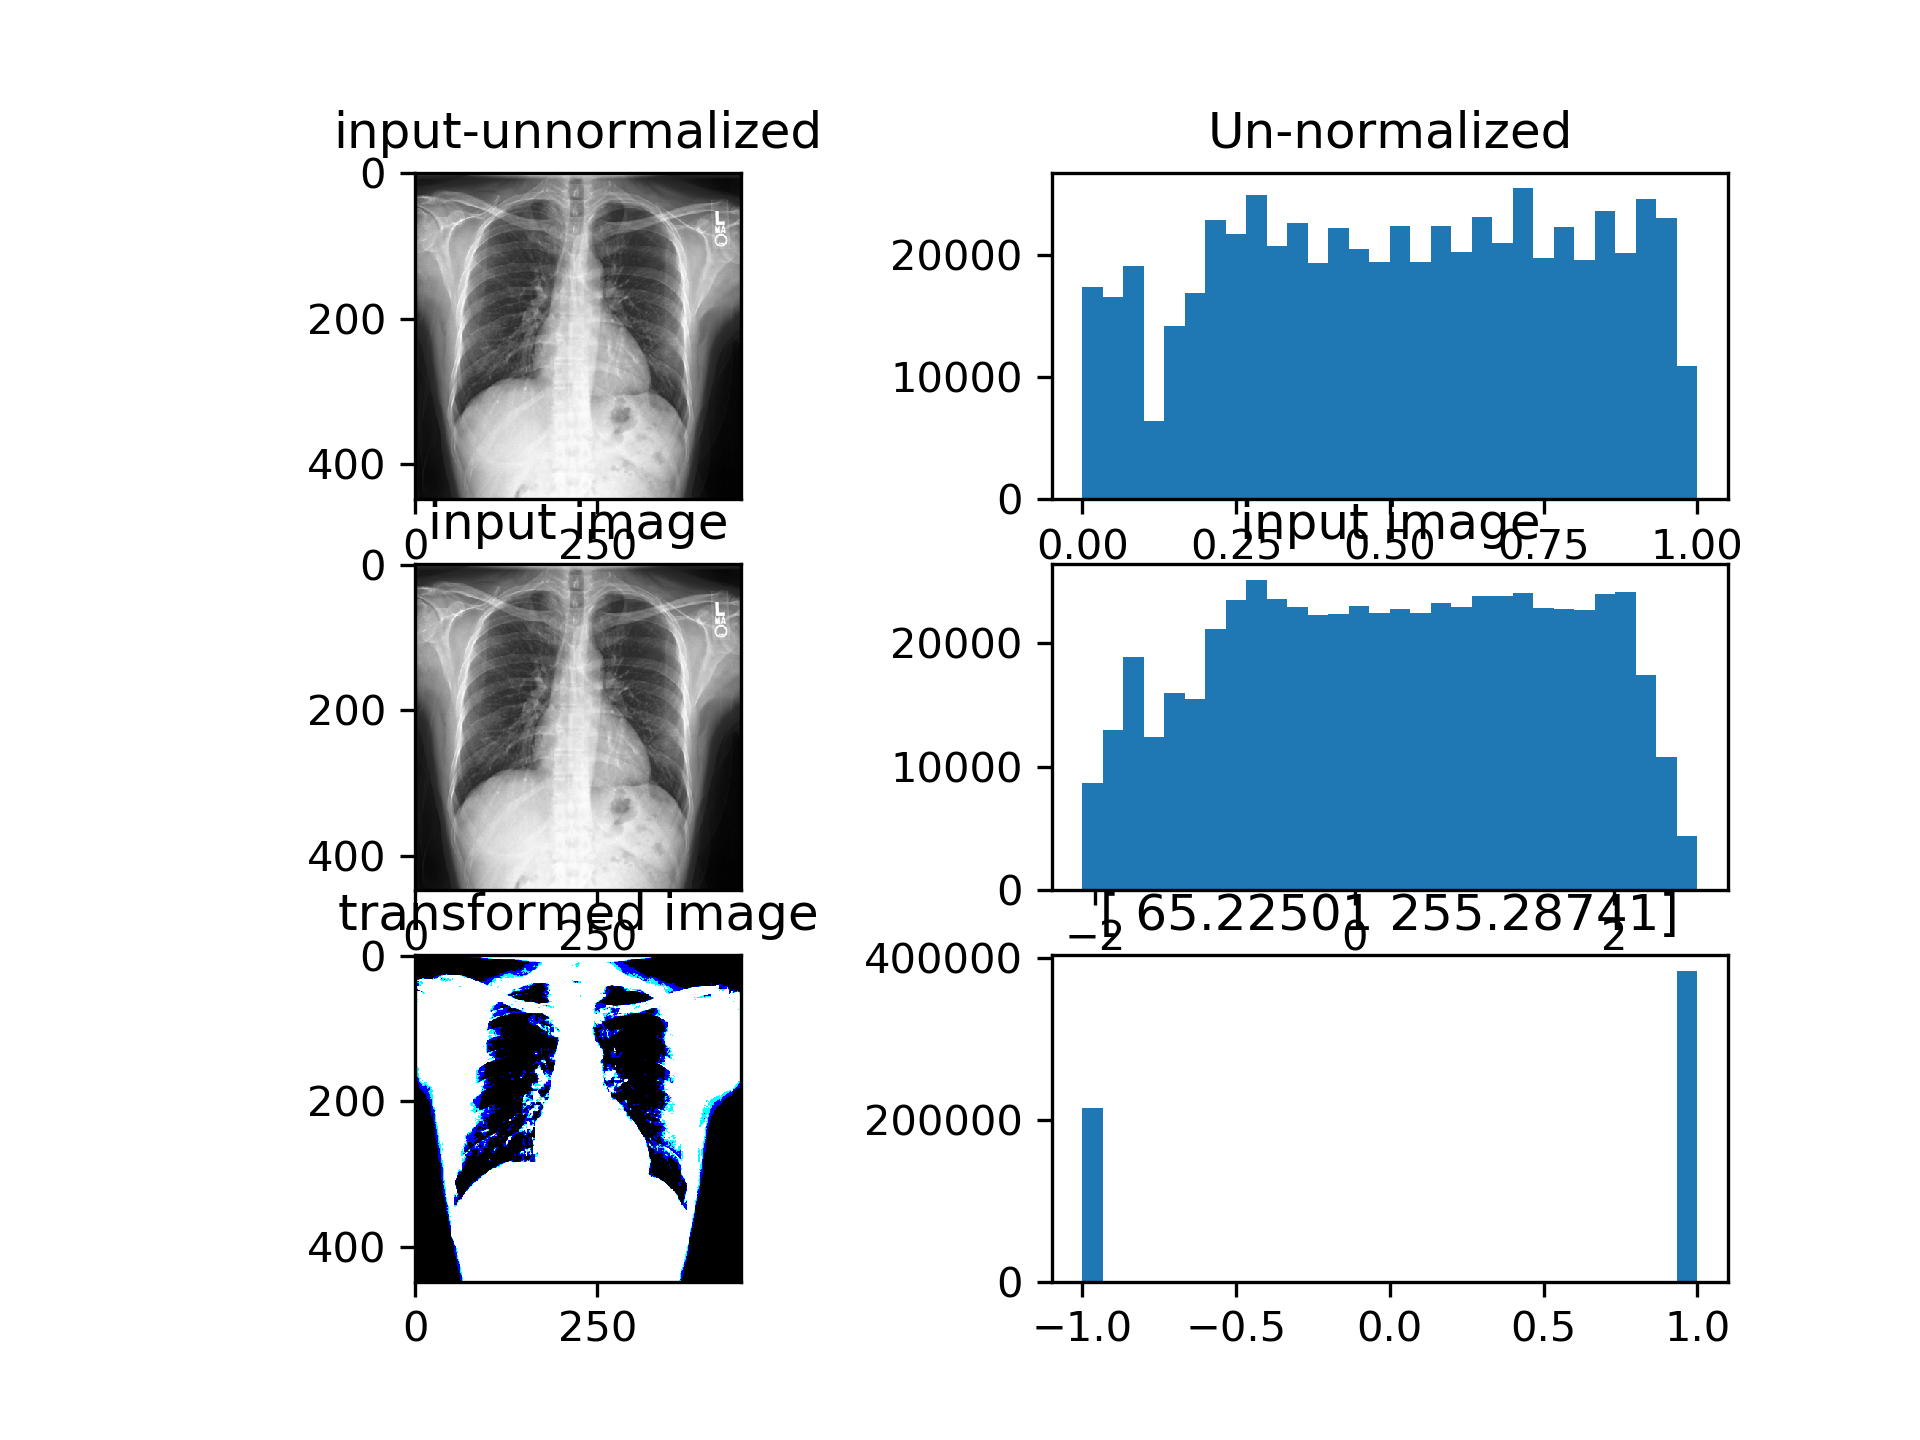
The single channel version examples: Densenet achieves above results with the bottom left image as input. The 2 numbers above the bottom right histogram are beta and gamma (shift and scale) from AdaIN repspectively. Images are binarized, since the AdaIN output is passed through a tanh before being fed into the model.
Multi-Channel version transformations:
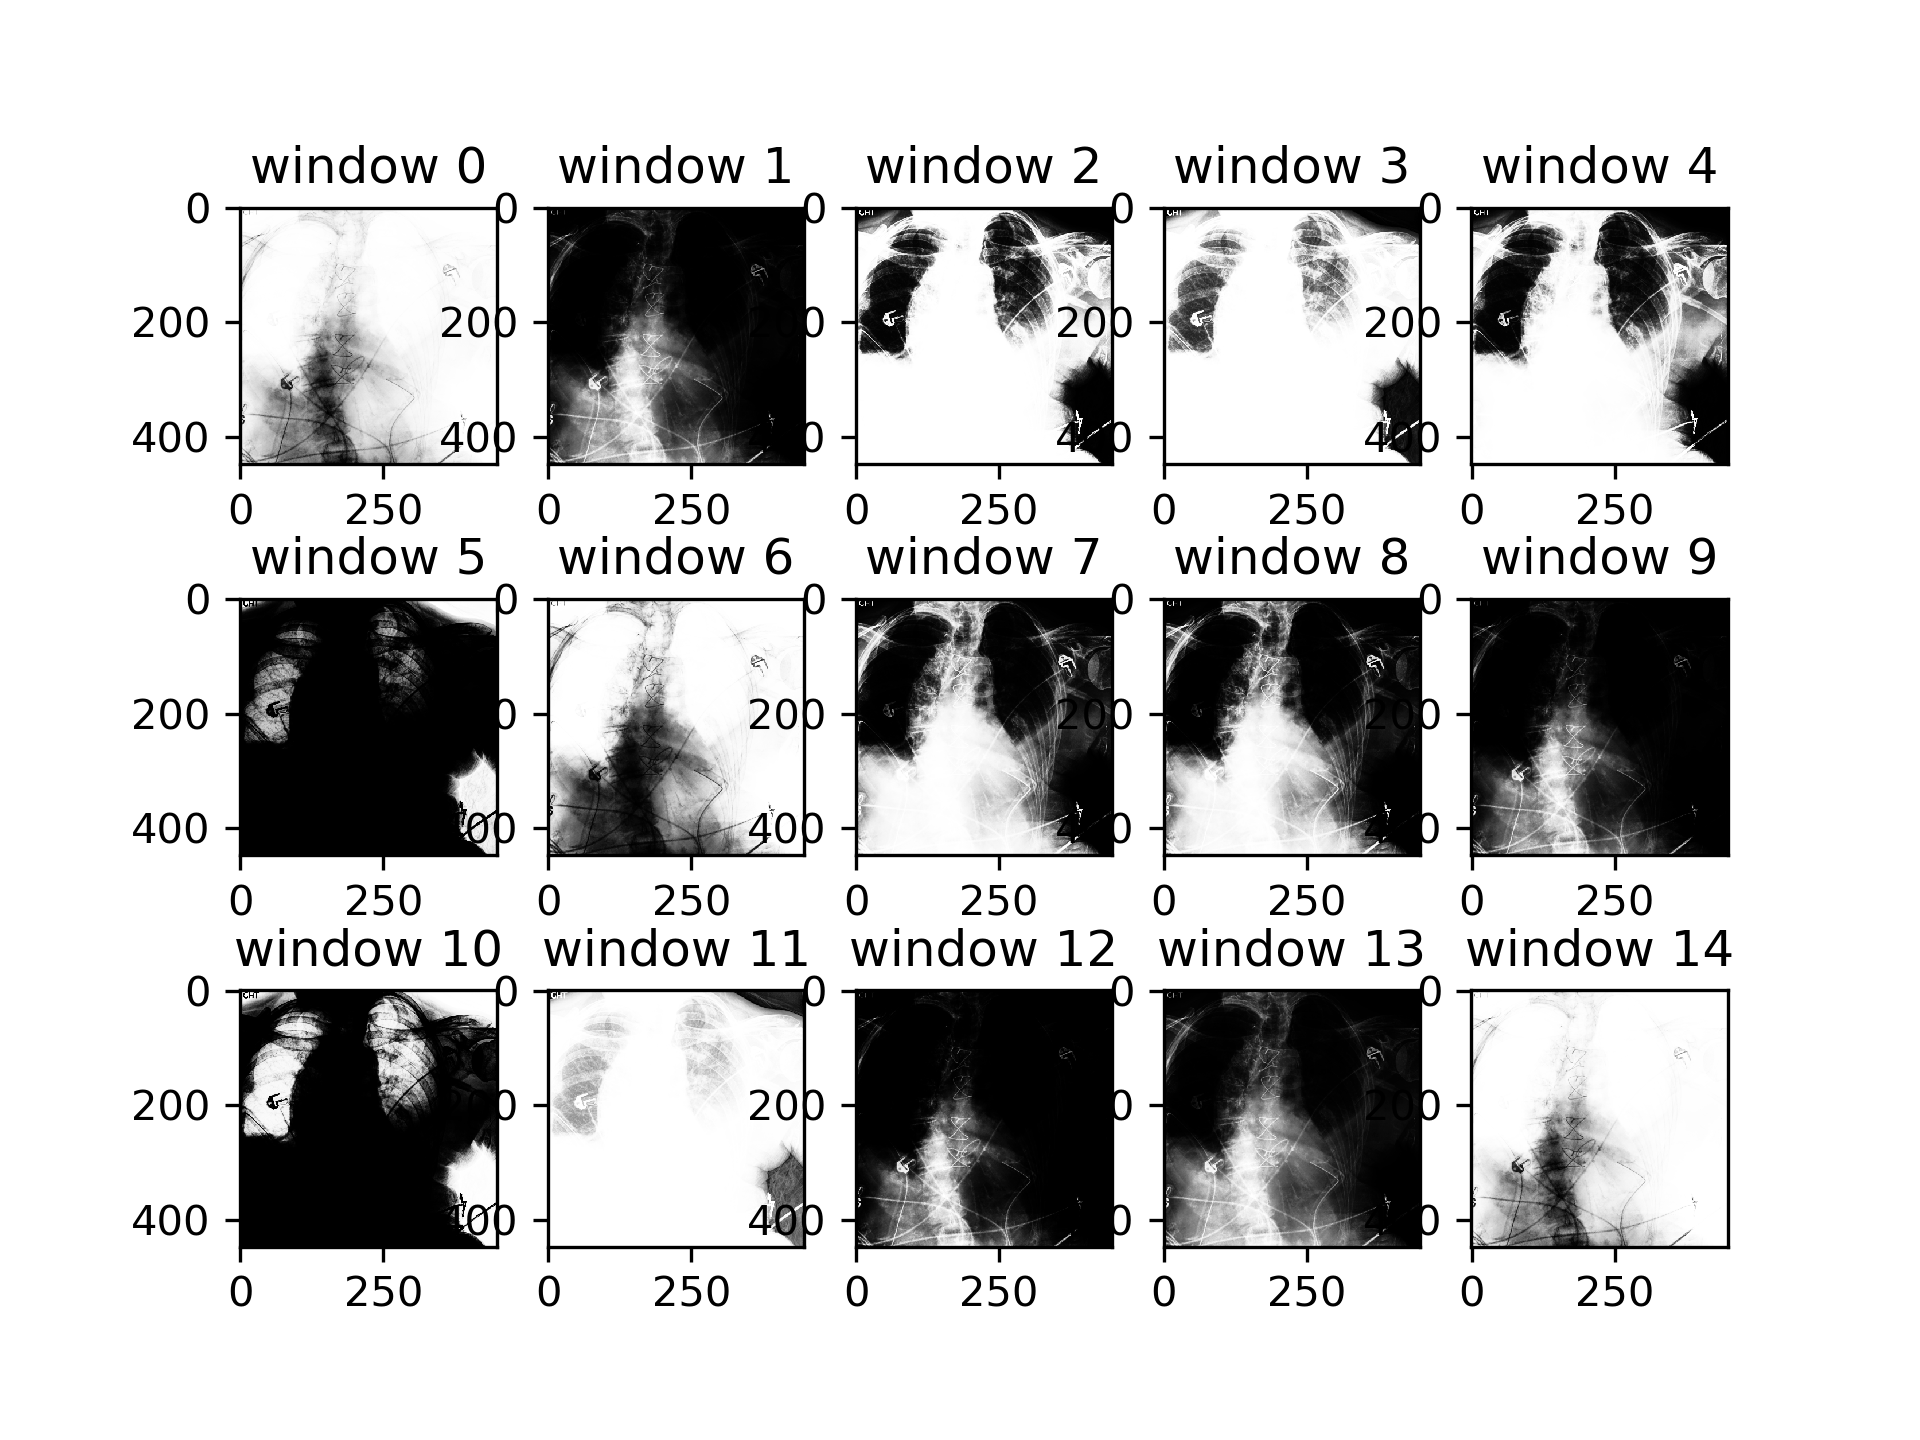
Experiments were performed on CIFAR100 dataset. CSN was adapted to have per channel outputs (RGB). There is no improvement on the densenet baseline (acccuracy 0.77), the performance is worse with CSN (acccuracy 0.60). We achieve equal performance to baseline when training with 2 optimizers CSN and densenet: the CSN with 5x reduced learning rate compared to the densenet (accuracy 0.77).