Legendgrams
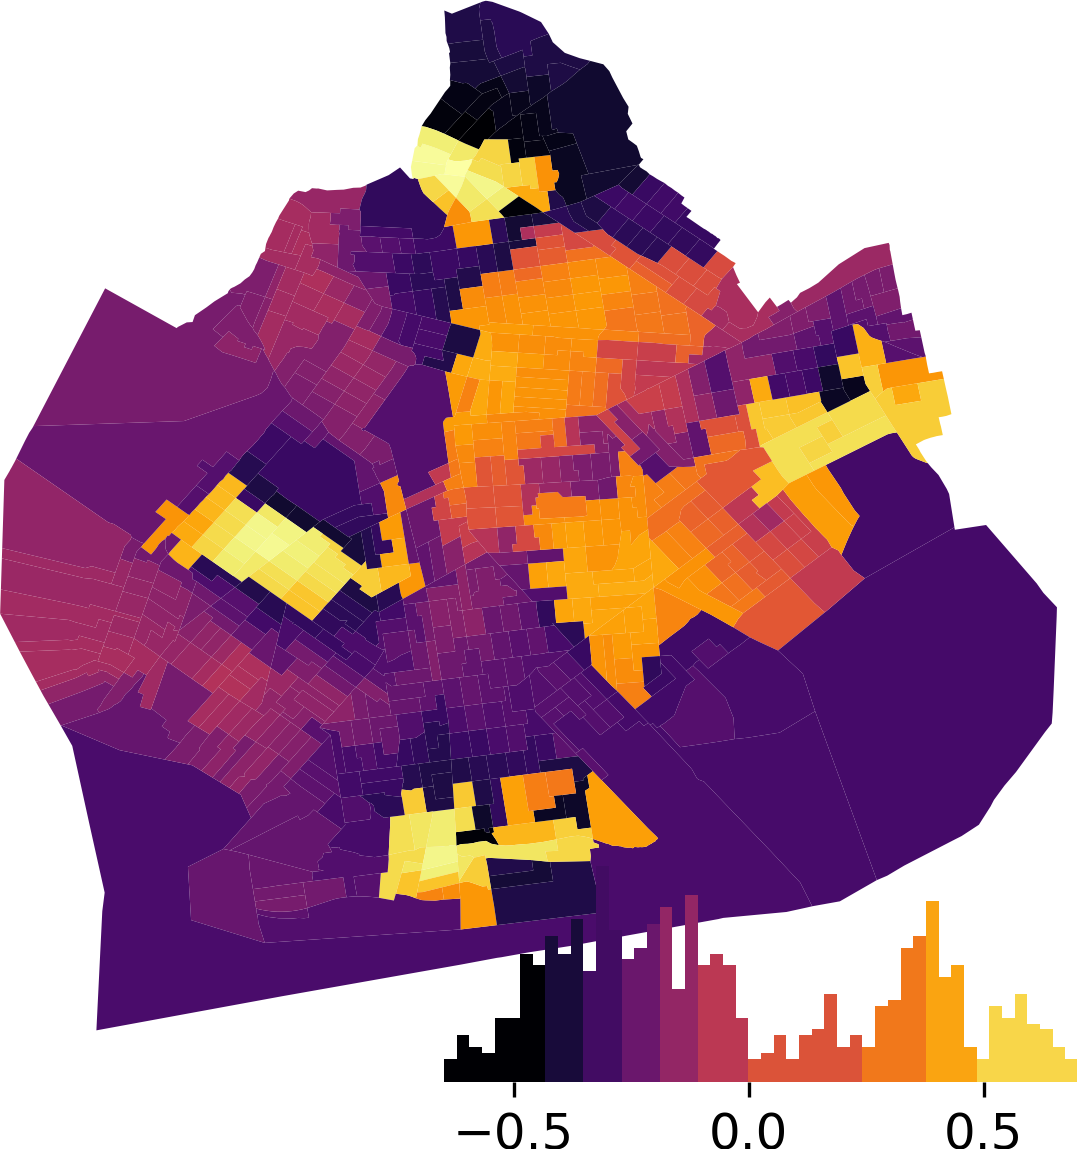
This is a small bit of unittested, reproducible code to provide legendgrams. Legendgrams are map legends that visualize the distribution of observations by color in a given map:
Legendgrams are distributed by PySAL, an open source cross-platform library of spatial analysis functions written in Python. It is intended to support the development of high level applications for spatial analysis.
To use legendgrams, simply install the package using pip:
$ pip install legendgramThen, apply the function to the figure/axis you want to have a legendgram:
>>> import pysal as ps, geopandas as gpd, matplotlib.pyplot as plt
>>> from legendgram import legendgram
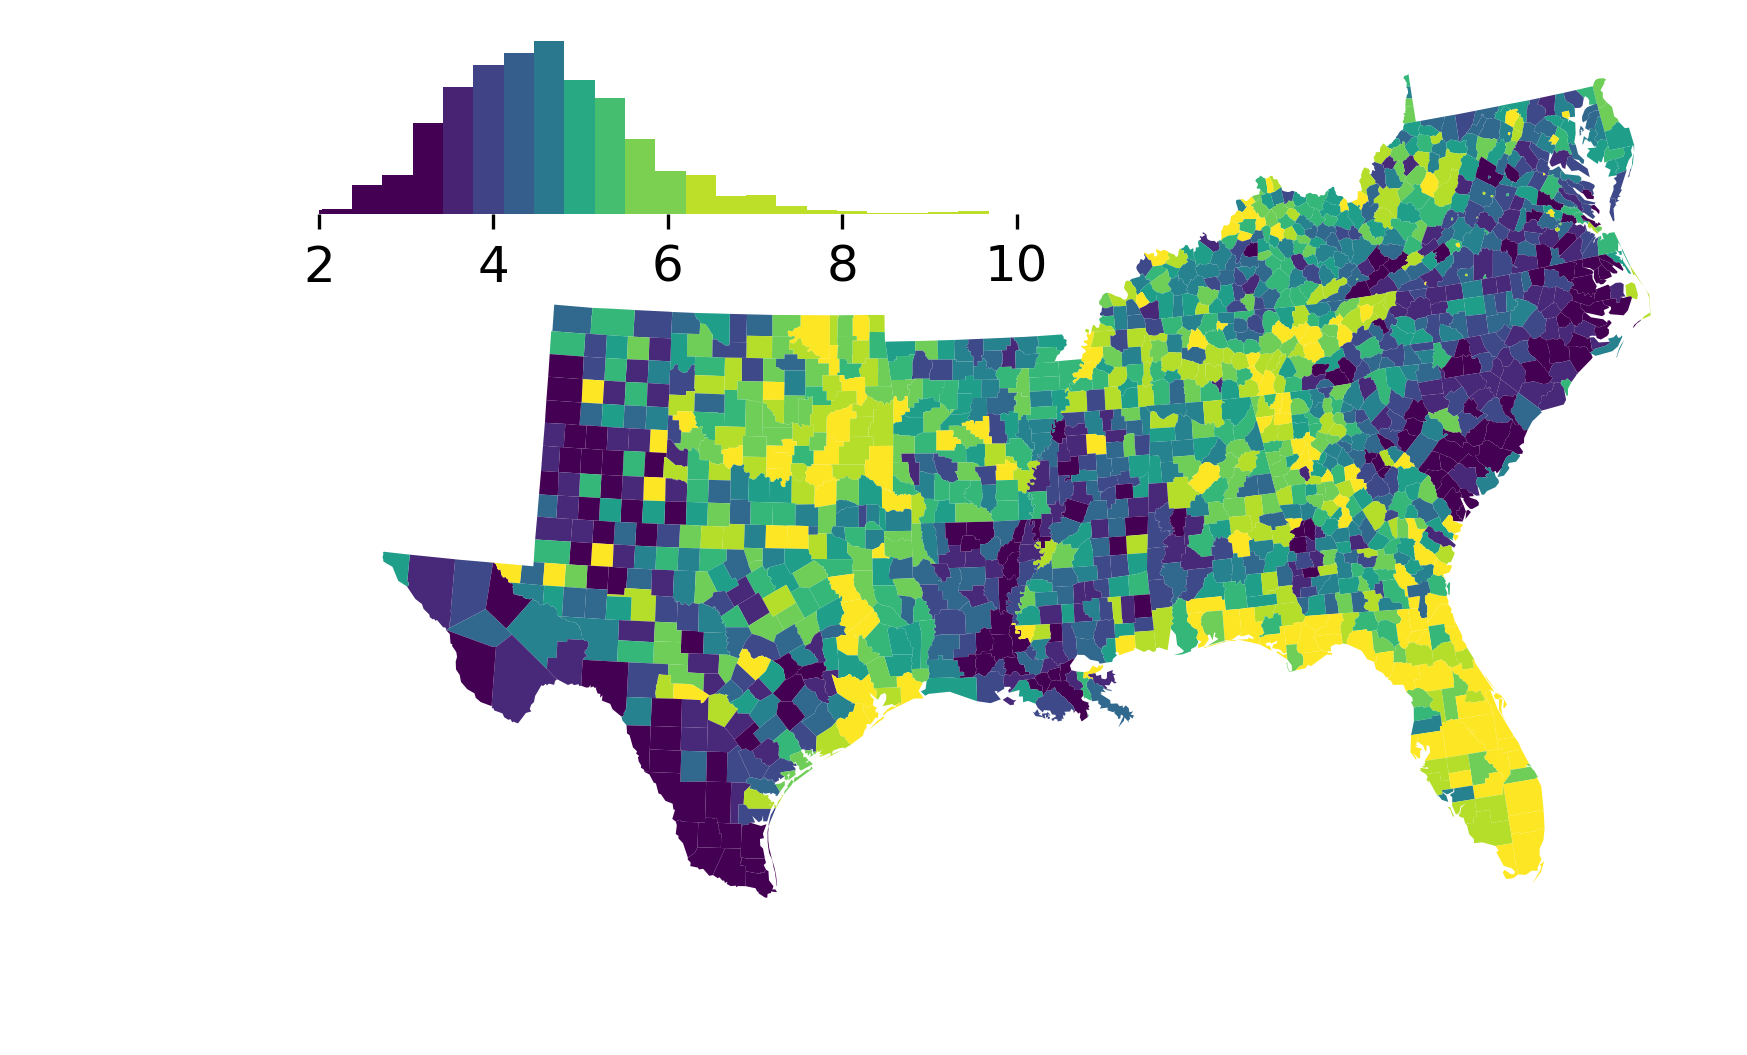
>>> data = gpd.read_file(ps.examples.get_path('south.shp'))
>>> data.crs = {'init': 'epgs:4269'}
>>> data.to_crs(epsg=5070)
>>> f,ax = plt.subplots()
>>> data.plot('DV80', k=10, ax=ax, scheme='Quantiles')
>>> bins = ps.Quantiles(data['DV80'].values, k=10).bins
>>> from legendgram import legendgram
>>> import palettable.matplotlib as palmpl
>>> legendgram(f,ax,data['DV80'],bins,pal=palmpl.Viridis_10,
legend_size=(.5,.2), # legend size in fractions of the axis
loc = 'upper left' # matplotlib-style legend locations
clip = (2,10) # clip the displayed range of the histogram
)
An example notebook is provided as well.
License
This is licensed under the 3-Clause BSD license. Refer to the license file for more details.