A tool to quickly find nearest neighbors in images dataset based on color similarities. Features are abstracted from color distribution of images, and with Locality Sensitive Hashing, small-sized sketches are generated to estimate cosine similarities. Prism provides a web-based interface to explain the process from feature extraction to finding most similar images.
https://kainliu.github.io/posts/find-similar-images-based-on-locality-sensitive-hashing/
Prism starts with the color spectrum of images to generate signatures, abstract compact minhash sketches, and apply with LSH(locality-sensitive hashing) to find most similar images.
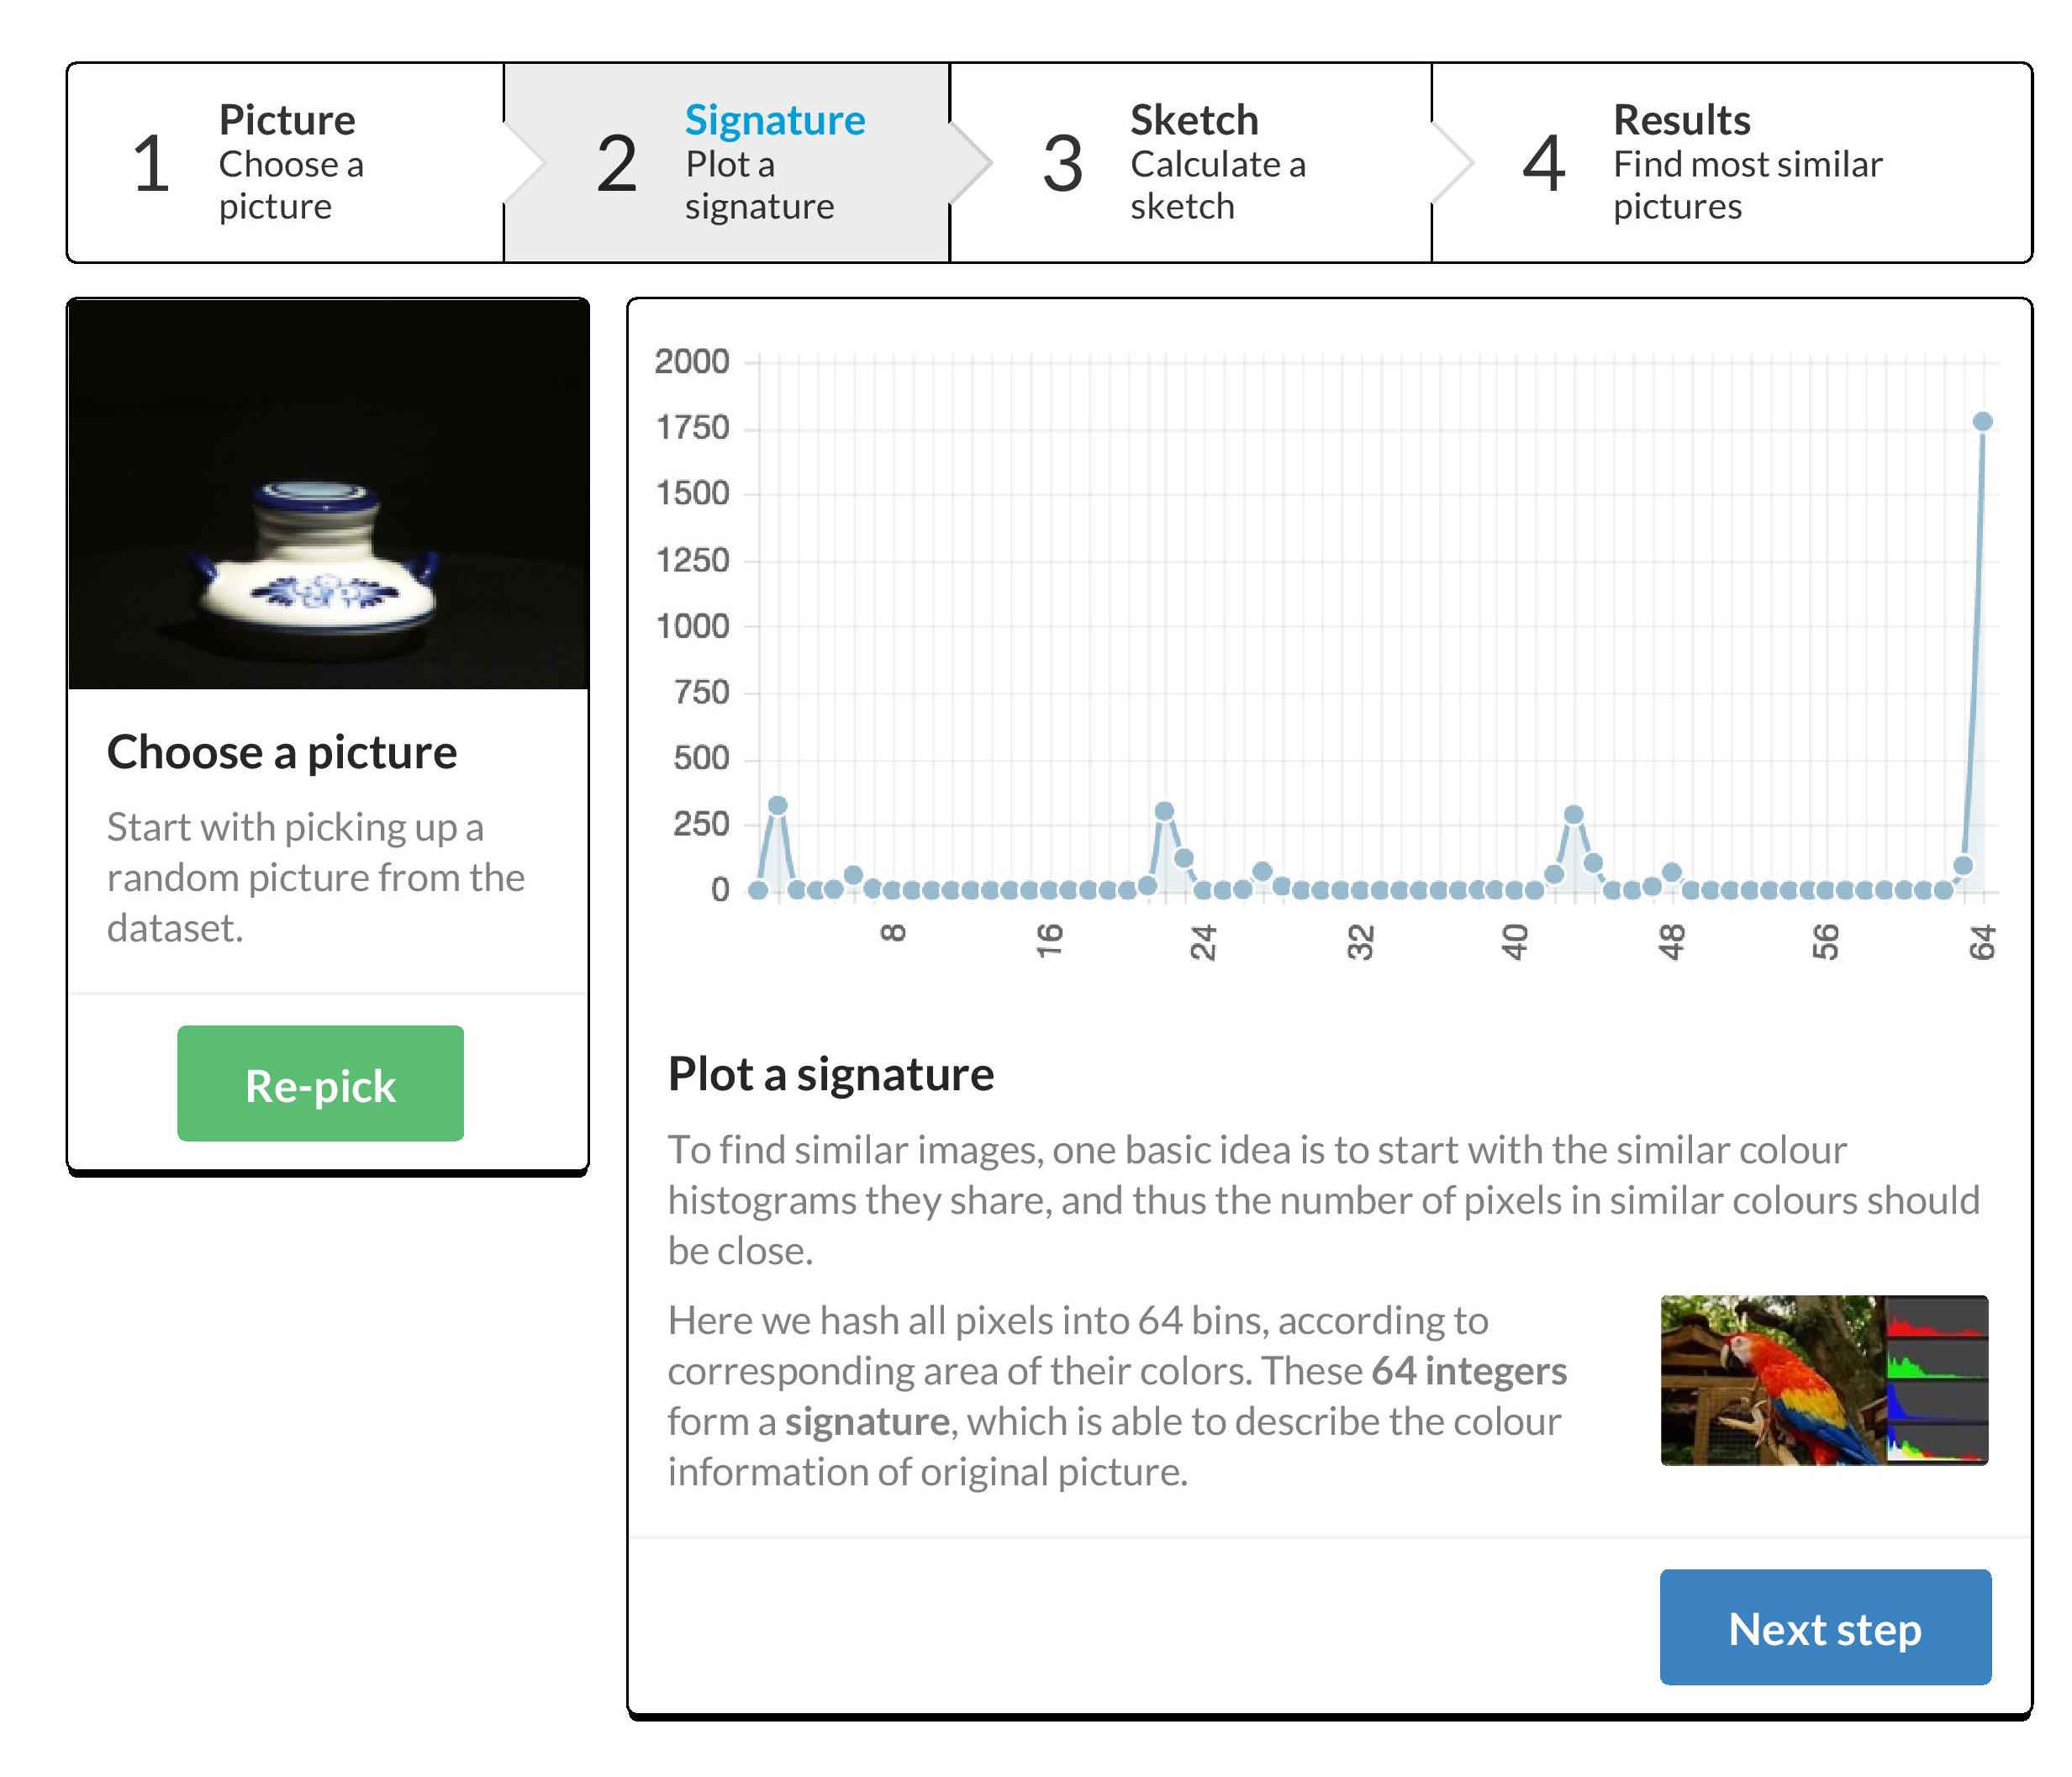
To find similar images, one basic idea is to start with the similar colour histograms they share, and thus pixel counts in similar colours should be close.
Here we hash all pixels into 64 bins, according to corresponding area of their colors. These 64 integers form a signature, which is able to describe the colour information of original picture.
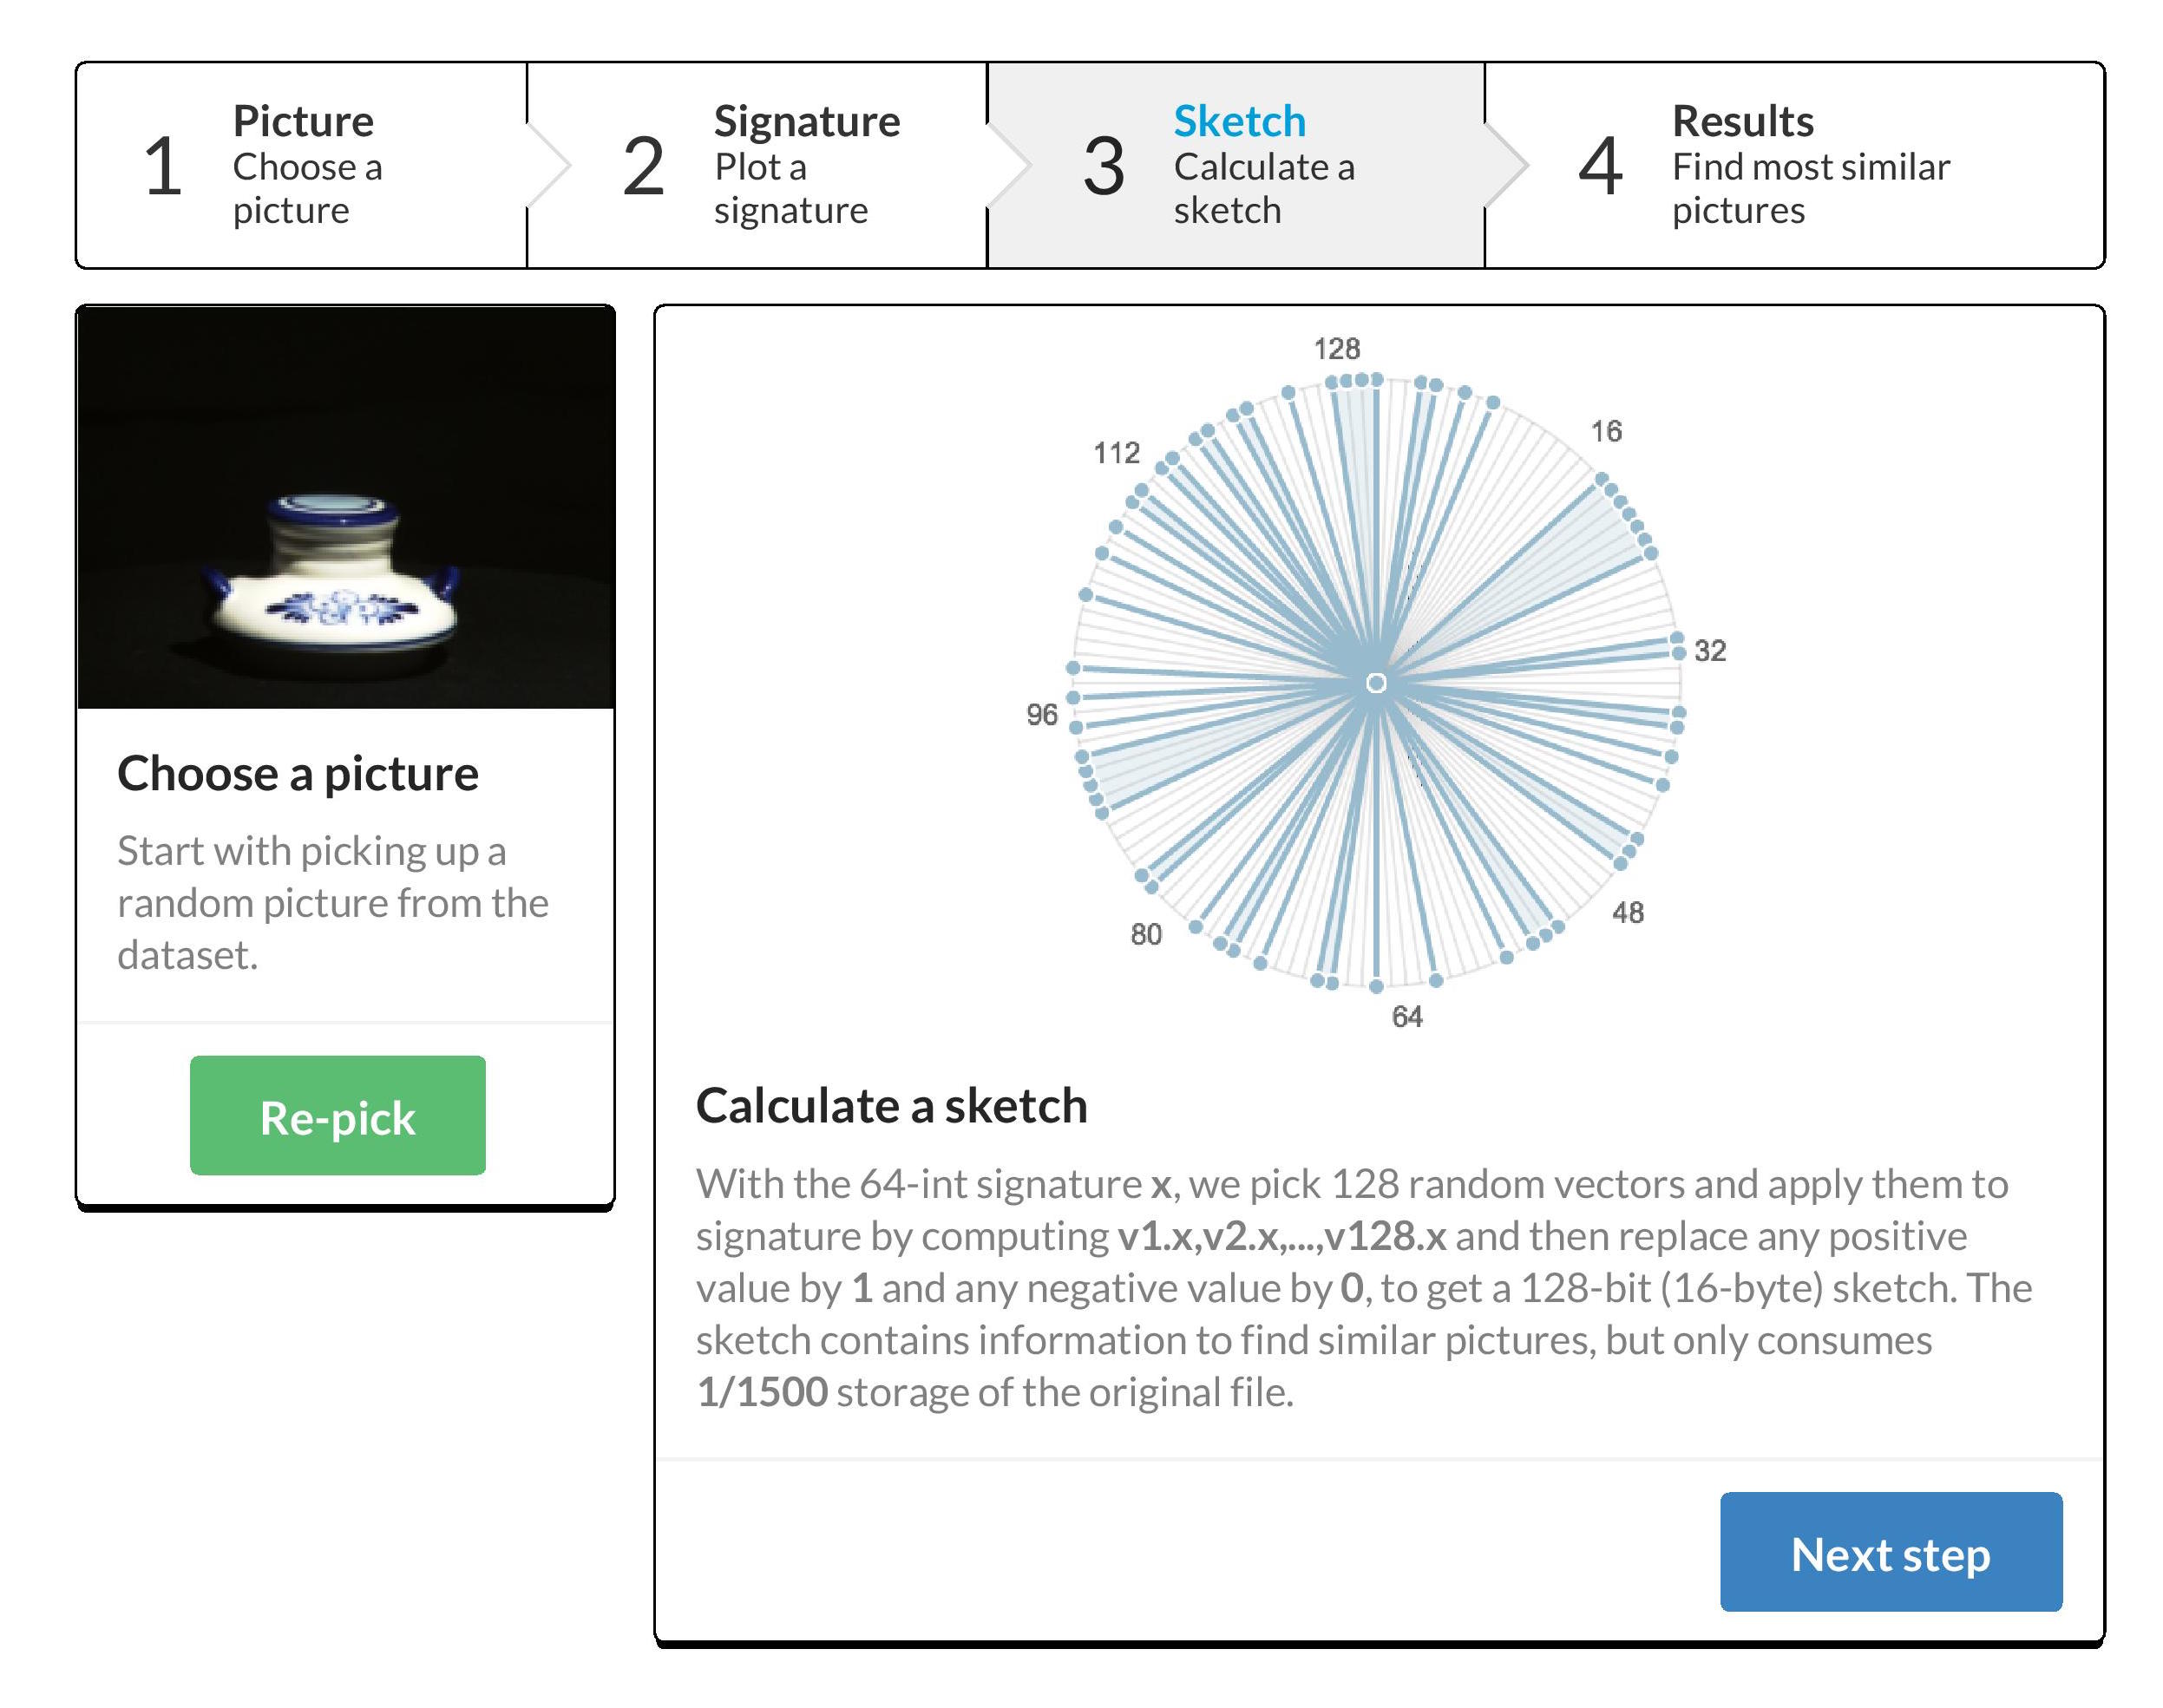
With the 64-int signature x, we pick 128 random vectors v and apply them to signature by computing v1.x,v2.x until v128.x and then replace any positive value by 1 and any negative value by 0, to get a 128-bit (16-byte) sketch. The sketch contains information to find similar pictures, but only consumes 1/1500 storage of the original file.
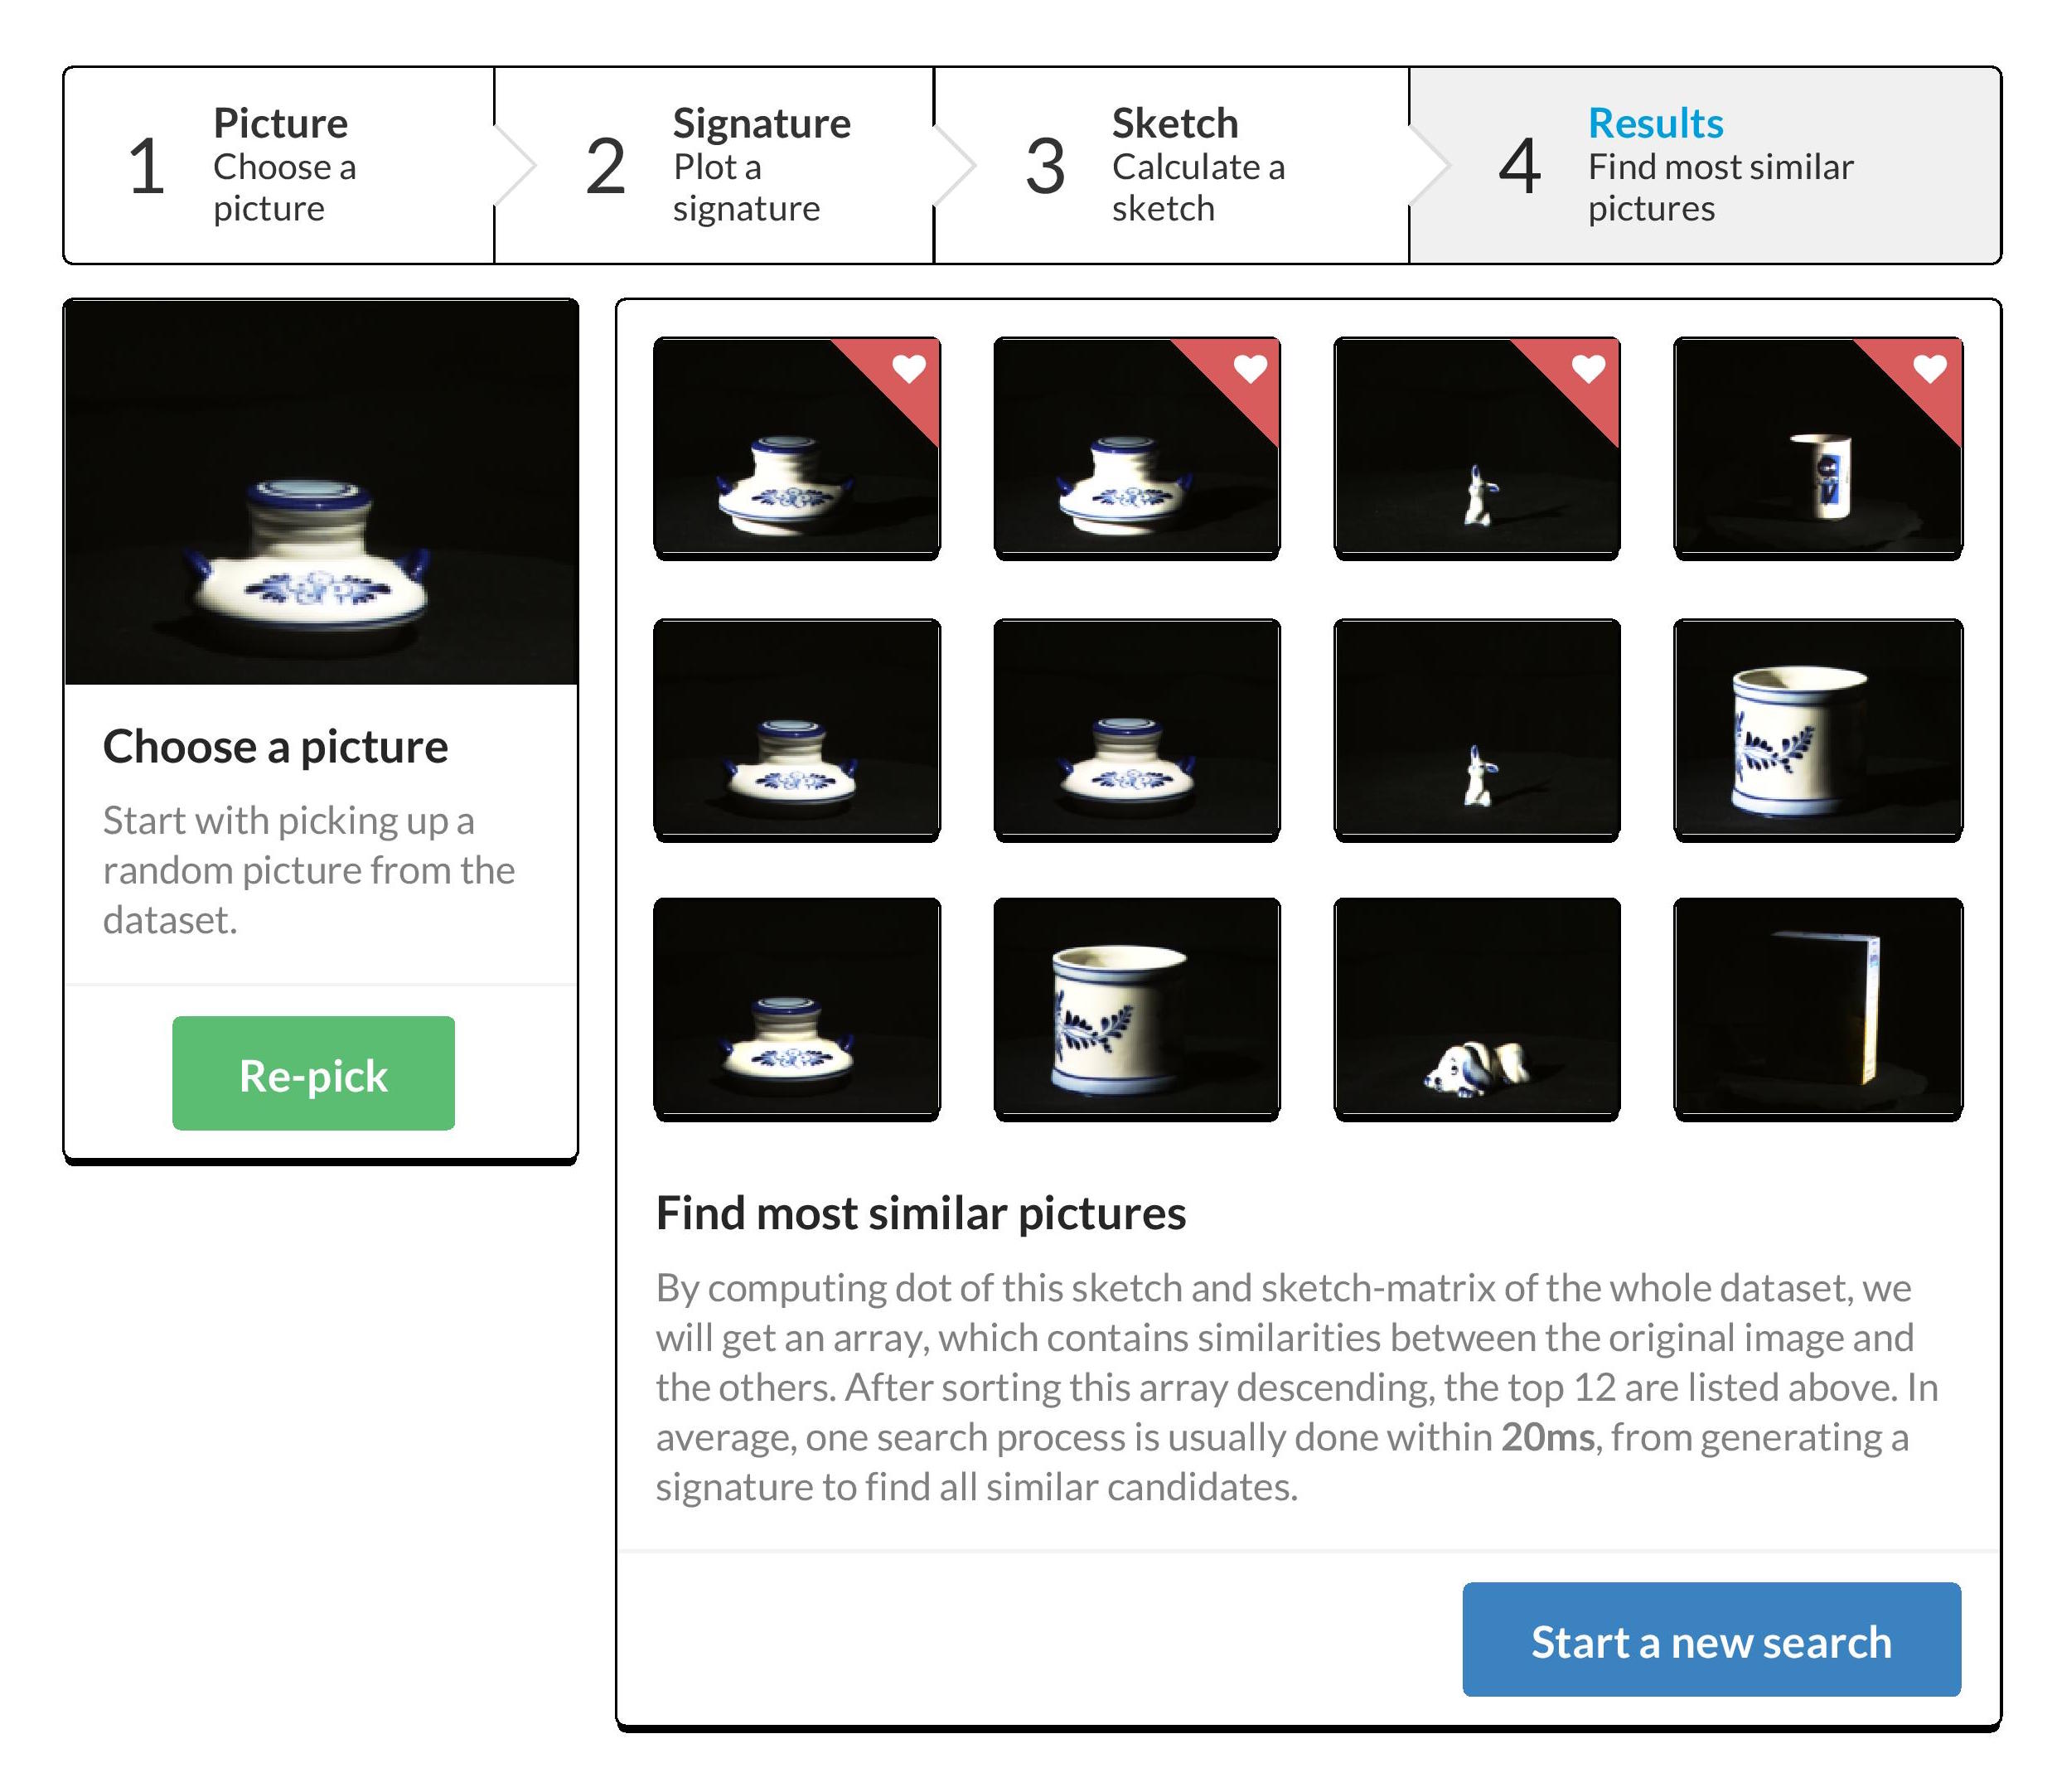
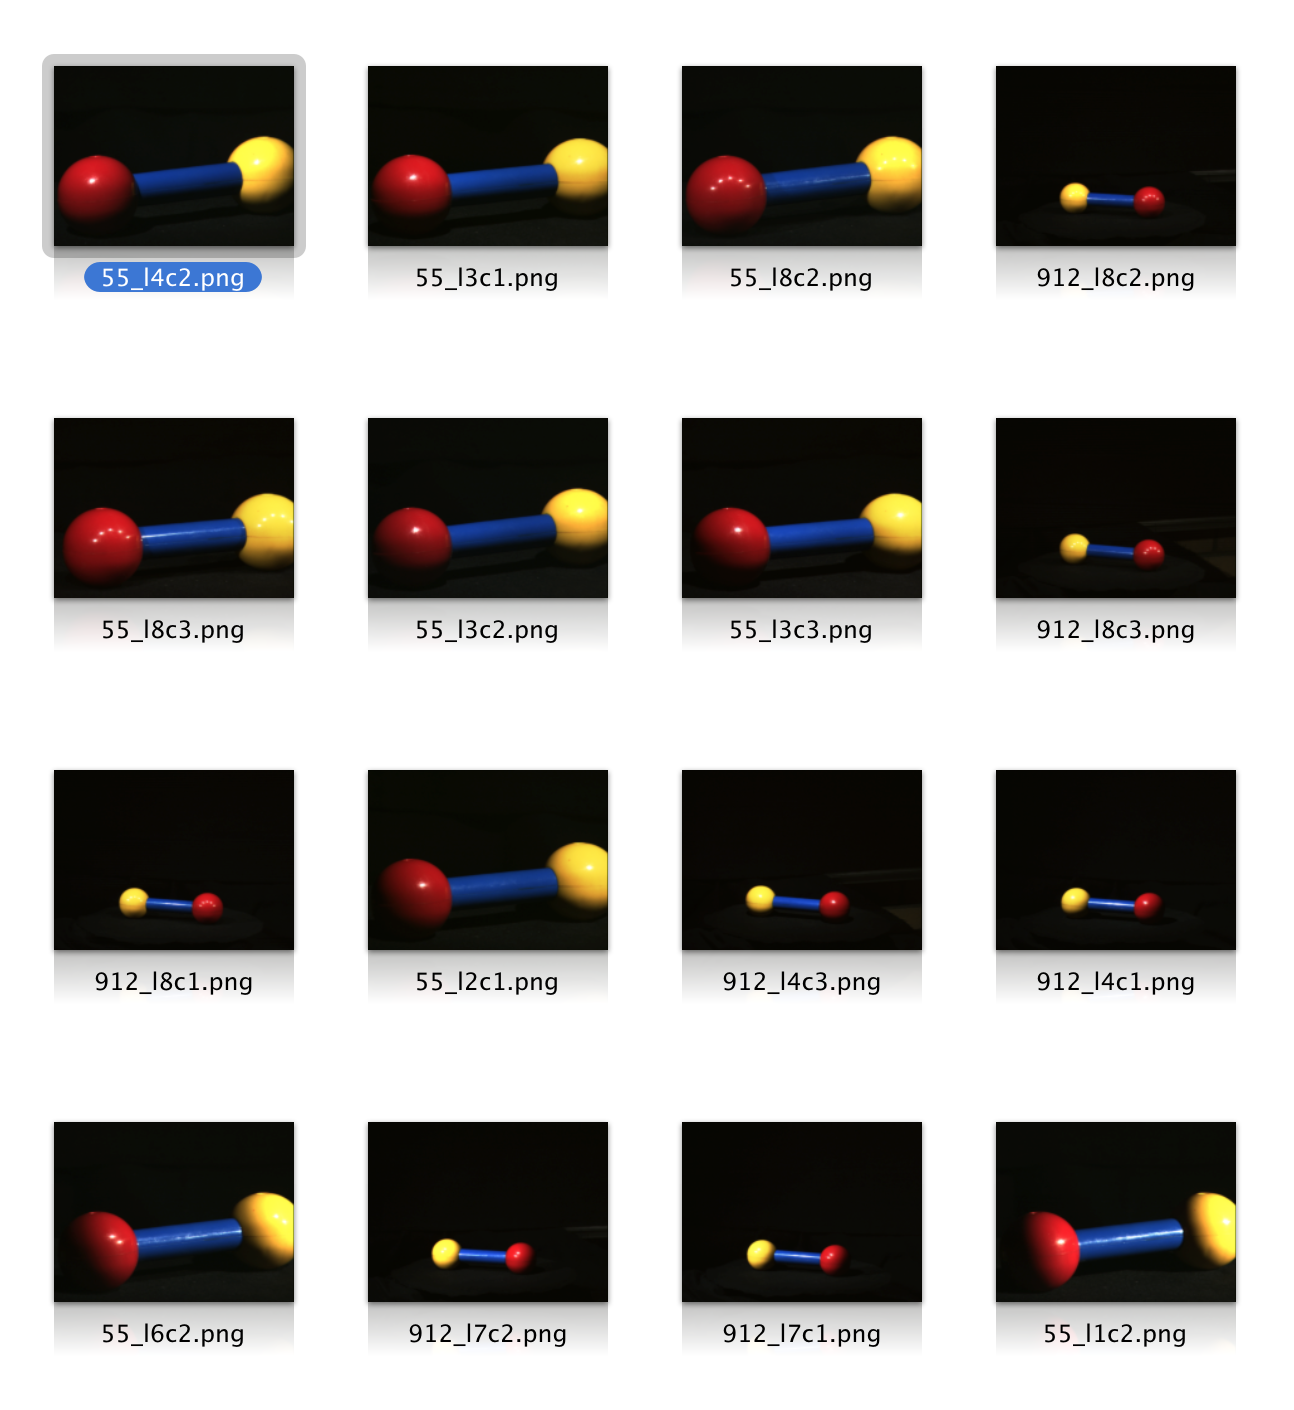
By computing dot of this sketch and sketch-matrix of the whole dataset, we will get an array, which contains similarities between the original image and the others. After sorting this array descending, the top 12 are listed above. In average, one search process is usually done within 20ms, from generating a signature to find all similar images.
To be optimized:
-
Bin size to hold digits of colours: 2, 4, 8, 16 or bigger? The bin_size function is used to optimize this parameter.
-
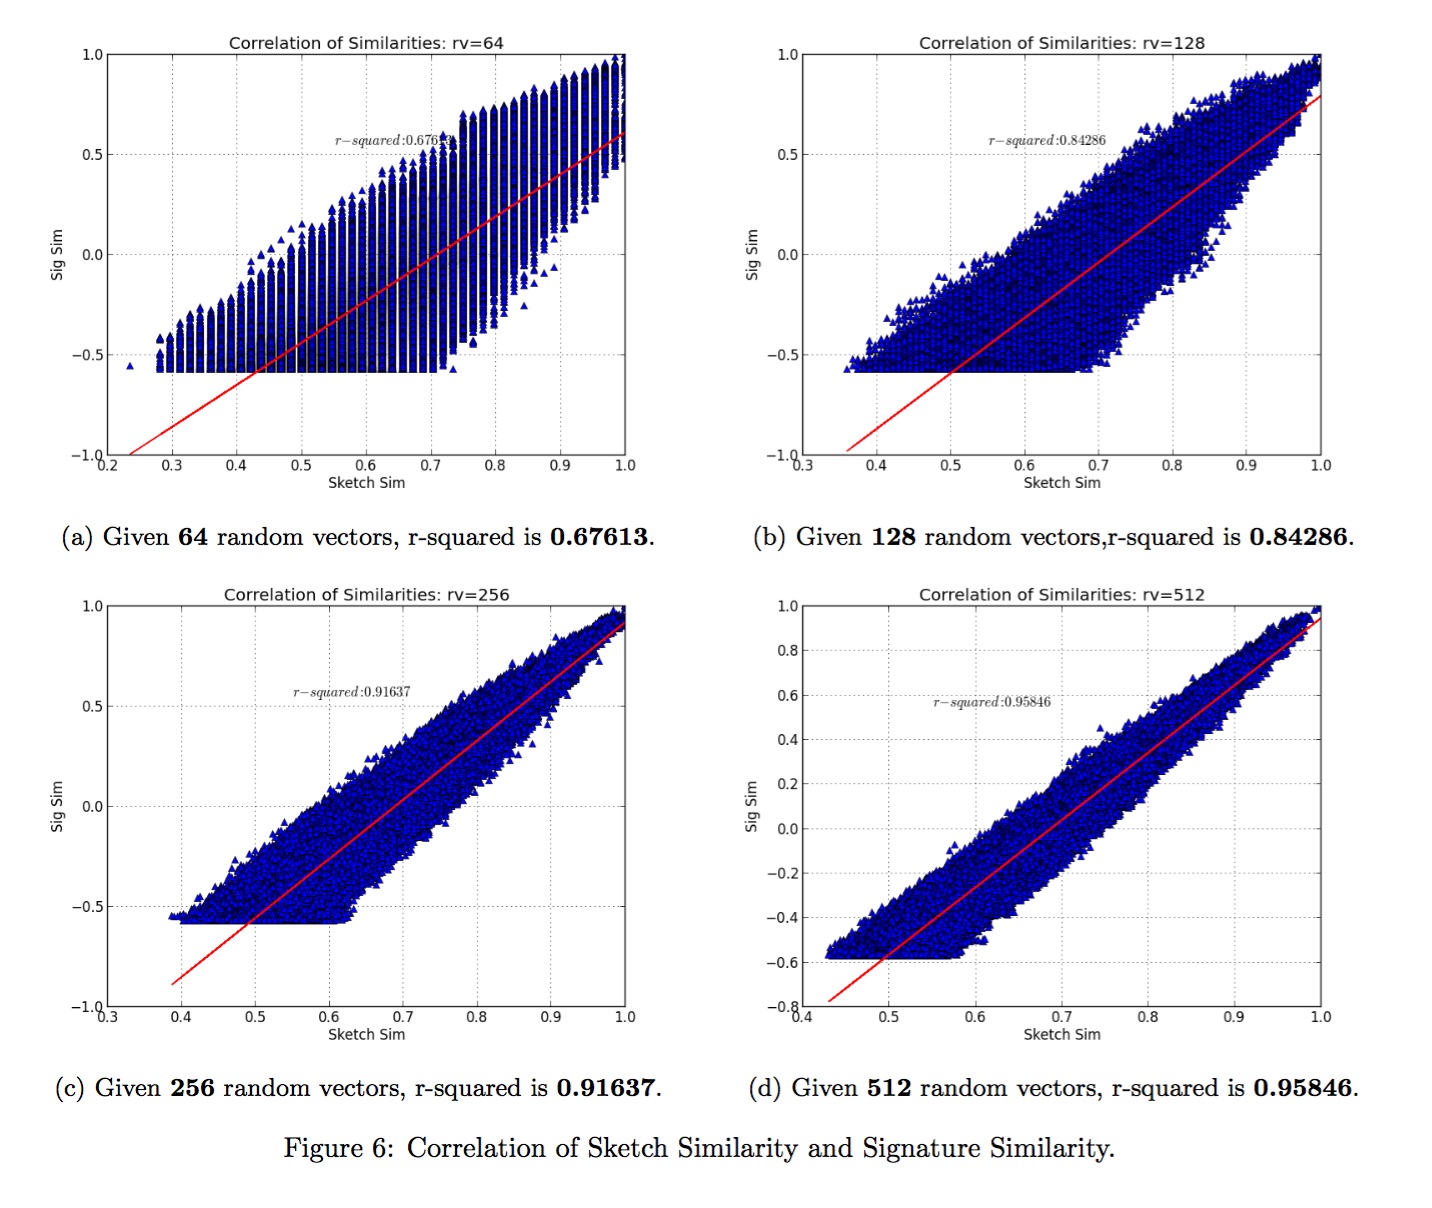
Vectors to be randomly generated: calculation of more vectors leads to higher accuracy but also consumes more time and memory. 64, 128, 256 or bigger?
R-squared is a statistical measure of how close the data are to the fitted regression line. Selecting 256 vectors ensures a r-squared greater than 0.9.
Options
sig: generate Signatures based on the colours distribution.sketch: generate Sketches based on Signatures.cos: calculate the Cosine Similarity between samples and all population.matrix: calculate the similarity matrix based on Sketchessimilar: find similar candidates for one imageall: find similar candidates for all images, generate a mongodb sql as outputbin_size: experiments to optimize bin size
Recommend another article explaining this solution of minhash and LSH in R.

ALOI is a color image collection of one-thousand small objects, recorded for scientific purposes. In order to capture the sensory variation in object recordings, we systematically varied viewing angle, illumination angle, and illumination color for each object, and additionally captured wide-baseline stereo images. We recorded over a hundred images of each object, yielding a total of 110,250 images for the collection.
Illumination direction is varied in 24 configurations and for each object there are 24 pictures.
