centreon4splunk is a Splunk App for Centreon and provides several dashboard
- Host Status
- Service Status
- Downtime
- EventHandler
- Log Entry
- Metric (perfdata)
- BA Status
This app is working with Centreon >= 2.8.24 or 18.10 and use the stream connector feature to generate log.
- Use stream connector to generate a log file "/var/log/centreon4splunk/centreon4splunk.log"
- Use Universal Forwarder to monitor this log
- Data must be forwarded into the index calling "centreon"
- Install and use centreon4splunk app to manipulate data
- On your Centreon server, run :
mkdir -p /var/log/centreon4splunk && chown -R centreon-broker:centreon-broker /var/log/centreon4splunk
- Copy lua script lua/centreon4splunk.lua to "/usr/share/centreon-broker/centreon4splunk.lua" on your Centreon server
- Connect to Centreon Web UI
- Configure the new output in "Configuration > Pollers > Broker configuration > Central Broker".
- In Output tab select "Generic – Stream connector" and click "Add"
- Define the name of this output and the path to the Lua connector : /usr/share/centreon-broker/centreon4splunk.lua
- Click Save and go to generate the configuration and restart cbd daemon.
- On your Centreon server, install and configure Universal Forwarder Splunk
- Add an input to monitore /var/log/centreon4splunk/centreon4splunk.log, use centreon4splunk sourcetype and select centreon index Example "inputs.conf" file :
[monitor:///var/log/centreon4splunk/centreon4splunk.log]
index = centreon
sourcetype = centreon4splunk
- On your Splunk, configure a new sourcetype
[centreon4splunk]
DATETIME_CONFIG =
TZ = Europe/Paris
NO_BINARY_CHECK = true
SEDCMD-StripHeader = s/^.*INFO: (.*$)/\1/
TIME_PREFIX="log_time":
disabled = false
pulldown_type = true
description = centreon4splunk
- Create a new index calling : centreon
- Deploy app centreon4splunk in your Splunk server on /opt/splunk/etc/apps/
- Restart Splunk and go to : https://splunkserver:8000/centreon4splunk/Infos
/var/log/centreon4splunk/centreon4splunk.log file can be really be. I advise you to configure logrotate. For example,
# vi /etc/logrotate.hourly.d/centreon4splunk
/var/log/centreon4splunk/centreon4splunk.log {
  size 256M
  rotate 12
  nocompress
  copytruncate
  missingok
  notifempty
  nocreate
  nomail
}
notify_centreon action use Centreon API to submit passive check. You must restart Splunk to enable configurations. First, configure authentication for API/Rest
- Copy $SPLUNK_HOME/etc/apps/centreon4splunk/default/alert_actions.conf to $SPLUNK_HOME/etc/apps/centreon4splunk/local directory
- Edit local/alert_actions.conf and change attribut value
- param.base_url : URL centreon
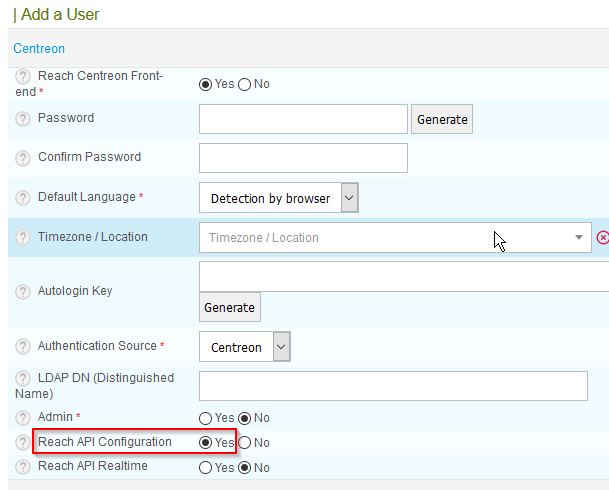
- param.login : A user Centreon with "Reach API Configuration" privilege
- param.password : The login password

In Centreon,
- Create new service using "generic-passive-service-custom" template.
- Chose a name and attach it to a host.
- Reload the poller to apply configuration.
In Splunk,
- Run the search and click Save As > Alert
- Set a title and configure the schedule
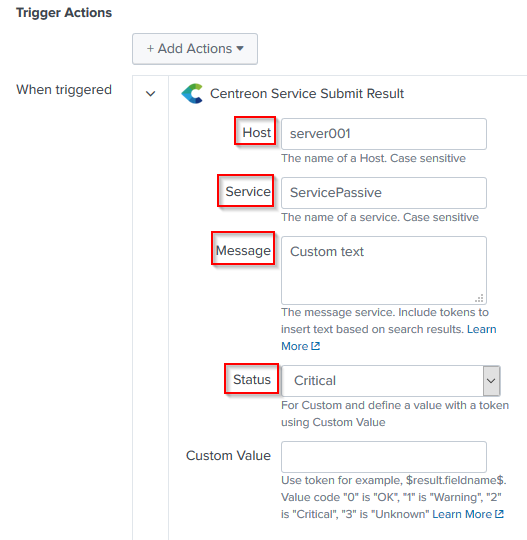
- Use trigger action "Centreon Service Submit Result"
- Set the host and service name
- Select the status (OK, WARNING, CRITICAL or UNKNOWN)
If you choose Custom status, you can send a custom field. For example
Troubleshooting :
- See $SPLUNK_HOME/var/log/splunk/notify_centreon.log
- Run manually : $SPLUNK_HOME/bin/splunk cmd bin/python etc/apps/entreon4splunk/bin/notify_centreon.py --execute < /tmp/input

