一款基于Golang的Linux流量统计与提醒工具,支持telegram消息和自动关机。
依赖:
- Linux系统
- root权限
- 一个telegram机器人
使用root权限执行以下命令进行安装:
wget -qO- https://raw.githubusercontent.com/nodeseeker/netMonitor/main/installation.sh -O installation.sh && chmod +x installation.sh && ./installation.sh
telegram的机器人将发生以下提示消息:
[test.example.com]流量提醒:当前使用量为 170.00 GB,超过了设置的85%阈值
[test.example.com]关机警告:当前使用量 190 GB,超过了限制的95%,即将关机!
程序运行状态通过systemd status netmonitor命令查看
● netmonitor.service - Network Bandwidth Monitor
     Loaded: loaded (/etc/systemd/system/netmonitor.service; enabled; preset: enabled)
     Active: active (running) since Sun 2024-09-08 21:02:50 CST; 20h ago
   Main PID: 4146349 (netmonitor)
      Tasks: 3 (limit: 537)
     Memory: 840.0K
        CPU: 2ms
     CGroup: /system.slice/netmonitor.service
             └─4146349 /opt/NetMonitor/netmonitor -c /opt/NetMonitor/config.json

Sep 08 21:02:50 test.example.com systemd[1]: Started netmonitor.service - Network Bandwidth Monitor.
程序的运行记录在/opt/NetMonitor/output.log中;如果出现运行错误,将储存在/opt/NetMonitor/error.log中。
在/opt/NetMonitor文件夹下,使用vim/nano或者任意编辑器,填写下面内容到config.json配置文件中。
-
需要一个设备名称(即
device对应的名称),用于在发送消息时区别信息来源,以下的示例的名称为test.example.com。 -
使用
ip a查找需要监控的网卡(即interface对应的网卡名称),输出内容示例如下,一般是lo下的第一个网卡,名称一般是eth0或enp3s0之类的,以下示例是eth0:1: lo: <LOOPBACK,UP,LOWER_UP> mtu 65536 qdisc noqueue state UNKNOWN group default qlen 1000 # lo是环回接口,不要使用这个 ... 2: eth0: <BROADCAST,MULTICAST,UP,LOWER_UP> mtu 1500 qdisc fq state UP group default qlen 1000 # eth0 就是物理网卡,有时候名称可能是enp3s0等各种 ... -
interval为更新时间,单位为秒,默认每60秒更新一次流量统计信息。 -
start_day是流量的更新时间,有些VPS的销售系统默认月初更新,有的是根据购买时间更新,按照实际情况即可。示例为每月9号更新一次,只需要填写日期,即1-31的某一天。 -
statistics的子项是以字节bytes为单位的流量统计信息,首次配置的时候,将last_reset改为上次流量充值时间,采用yyyy-mm-dd格式,其他项为0,不需要改动。 -
comparison中的category有三个选项。其一,upload为单向统计上传流量;其二,download为单向统计下载流量;其三,upload+download为双向统计流量。实际使用哪个,依据商家/机房/自己的流量统计需求填写。limit是设置的流量限制,单位为GB;threshold是发消息提醒的阈值,以配置为例,当流量达到200×0.85=170GB的时候,会通过电报发送消息提醒;ratio为自动关系的阈值,以配置为例,当流量达到200×0.95=190GB的时候,系统会自动关机,并在关机的前30秒发送关机提醒。 -
nessage中的token和chat_id为telegram机器人的密钥和聊天ID,按照实际情况填写。其他的选项,默认false即可,会在月周期之后自动重置,不需要手动修改。
{
  "device": "test.example.com",
  "interface": "eth0",
  "interval": 60,
  "start_day": 9,
  "statistics": {
    "total_receive": 0,
    "total_transmit": 0,
    "last_receive": 0,
    "last_transmit": 0,
    "last_reset": "2024-08-09"
  },
  "comparison": {
    "category": "upload+download",
    "limit": 200,
    "threshold": 0.85,
    "ratio": 0.95
  },
  "message": {
    "telegram": {
      "threshold_status": false,
      "ratio_status": false,
      "token": "1234567890:ASDFGHJKL-QWERTYUIOP",
      "chat_id": "9876543210"
    }
  }
}
纯golang实现,适配所有golang支持的CPU架构上,例如:龙芯loong64,RISC-V(64位)等,只需自行编译。以下为编译示例:
CGO_ENABLED=0 GOOS=linux GOARCH=loong64 go build -trimpath -ldflags="-w -s" -o netmonitor-linux-loong64 main.go # 编译适配于龙芯CPU的Linux系统
CGO_ENABLED=0 GOOS=linux GOARCH=riscv64 go build -trimpath -ldflags="-w -s" -o netmonitor-linux-riscv64 ../src/main.go # 编译适配于64位RISC-V CPU的Linux系统
程序读取/proc/net/dev信息进行统计,理论上支持Unix系统的部分发行版,例如freeBSD等。家穷,用不起BSD或者MacOS,故没有编译程序也没有做适配。
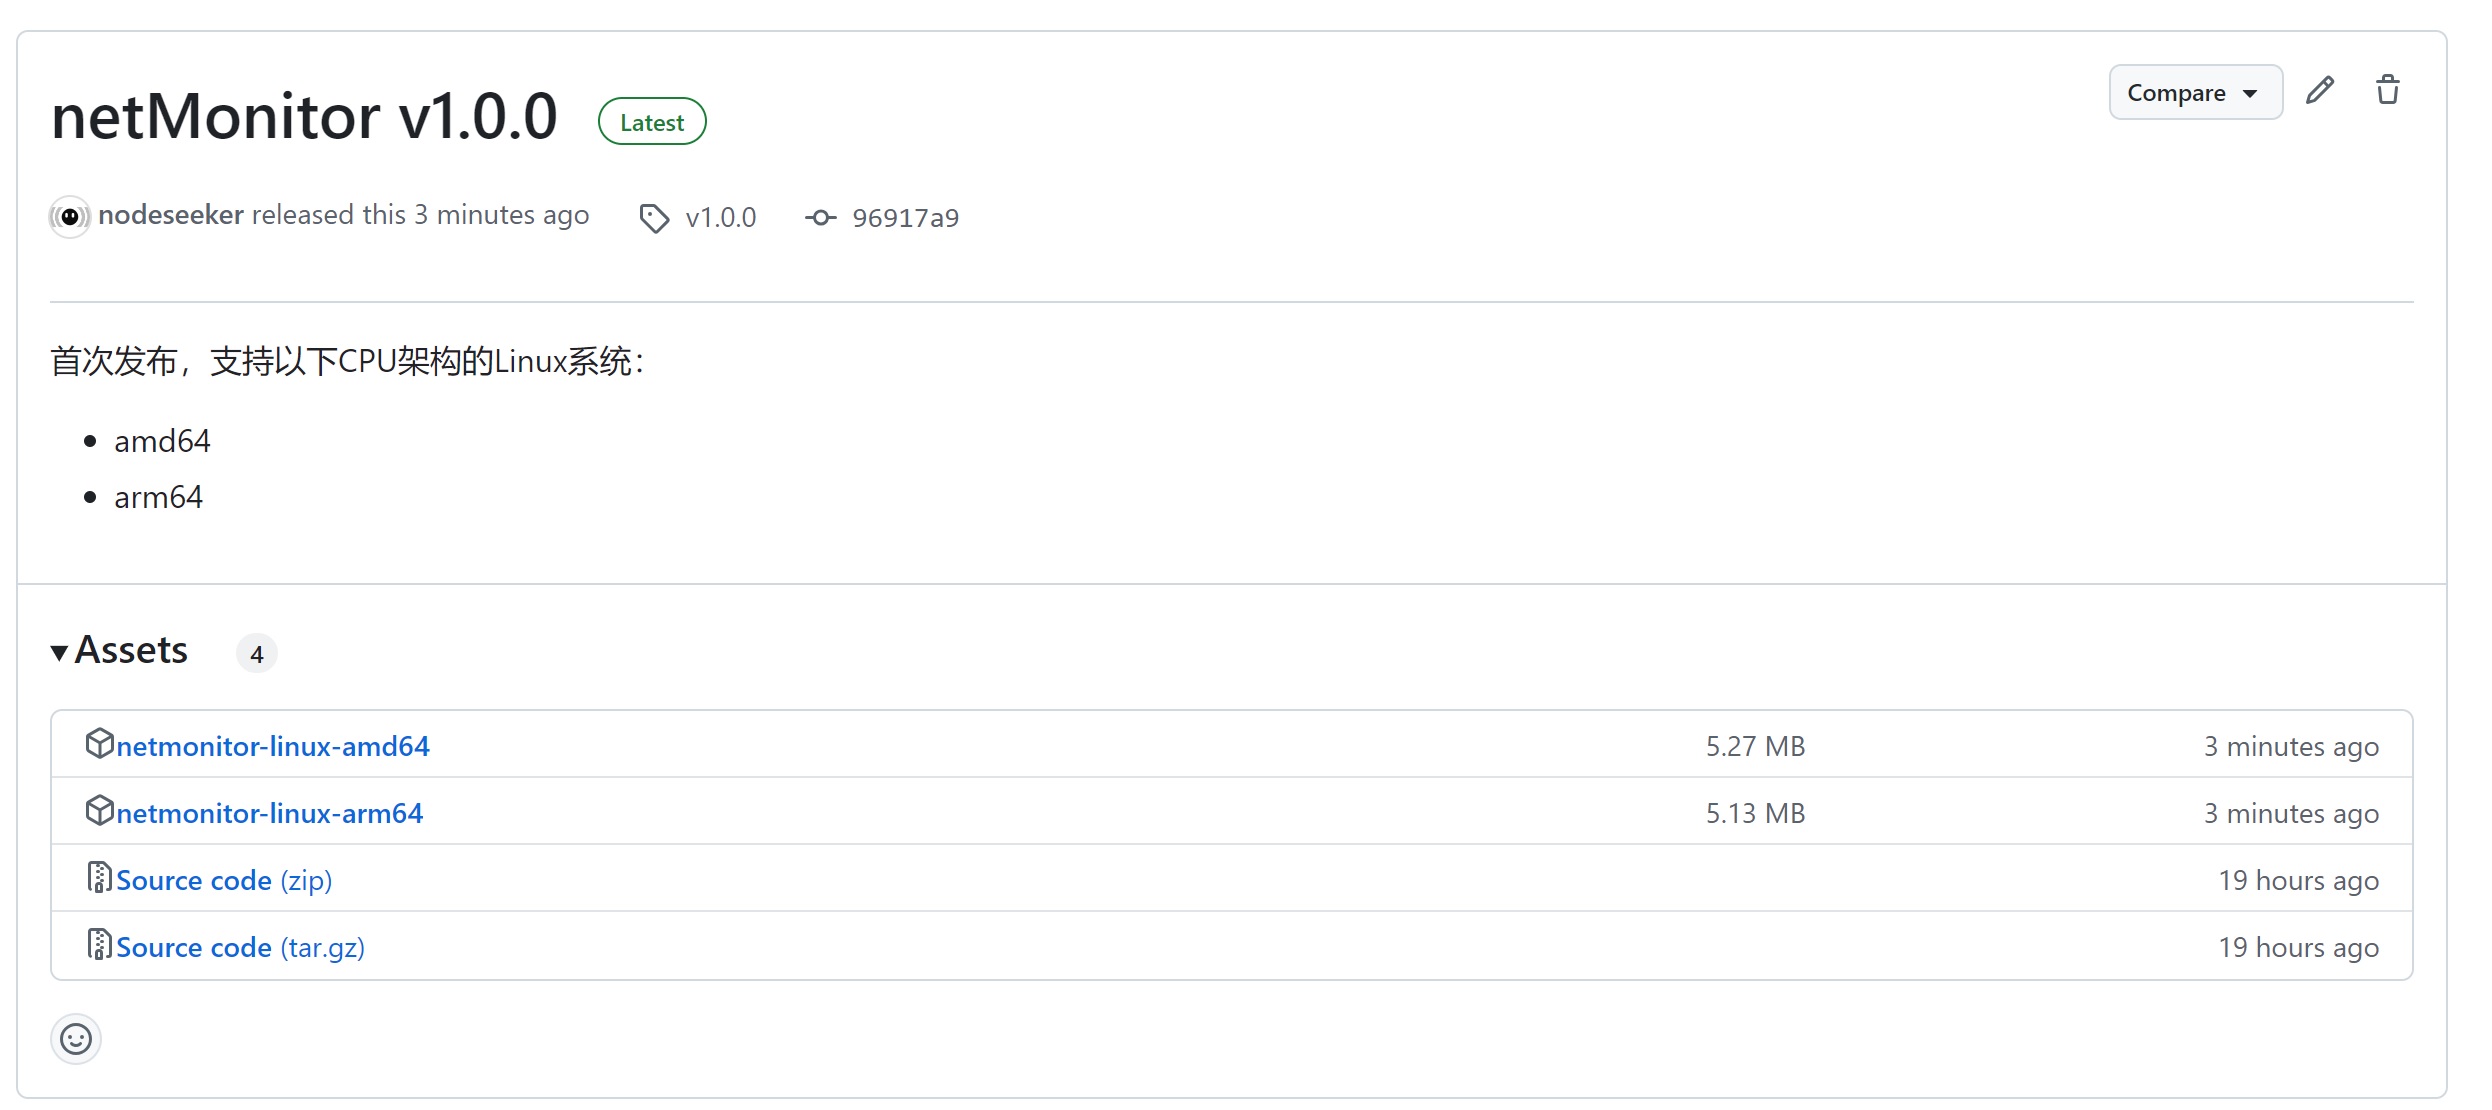
浏览器打开程序的发布页 https://github.com/nodeseeker/netMonitor/releases,在列表中找到对应CPU架构(如下图),比如x86_64的Linux系统,下载netmonitor-linux-amd64,而aarch64/arm64的Linux系统,则下载netmonitor-linux-arm64。
随后将程序重命名为netmonitor,Linux命令为mv netmonitor-linux-* netmonitor
新建一个文件夹用于储存程序和相关配置文件,以/opt/为例:
mkdir -p /opt/NetMonitor # 新建文件夹
mv netmonitor /opt/NetMonitor # 将持续移动到目标文件夹中
touch error.log # 新建文件用于储存可能出现的错误消息
touch output.log # 新建文件用于储存可能出现的日志信息
touch config.json # 新建配置文件
新建一个systemctl的文件:
touch /etc/systemd/system/netmonitor.service
向其写入以下内容,如果工作文件夹不是以上默认,需要进行对应的修改:
[Unit]
Description=Network Bandwidth Monitor
After=network.target

[Service]
WorkingDirectory=/opt/NetMonitor
ExecStart=/opt/NetMonitor/netmonitor -c /opt/NetMonitor/config.json
StandardOutput=file:/opt/NetMonitor/output.log
StandardError=file:/opt/NetMonitor/error.log
Restart=always
RestartSec=5

[Install]
WantedBy=multi-user.target
随后,设置开机自启并启动:
systemctl daemon-reload # 更新systemctl文件
systemctl enable netmonitor # 设置开机自启
systemctl start netmonitor # 启动程序
此外,还可以重启或者查看程序运行状态:
systemctl restart netmonitor # 重启程序
systemctl status netmonitor # 查看程序运行状态