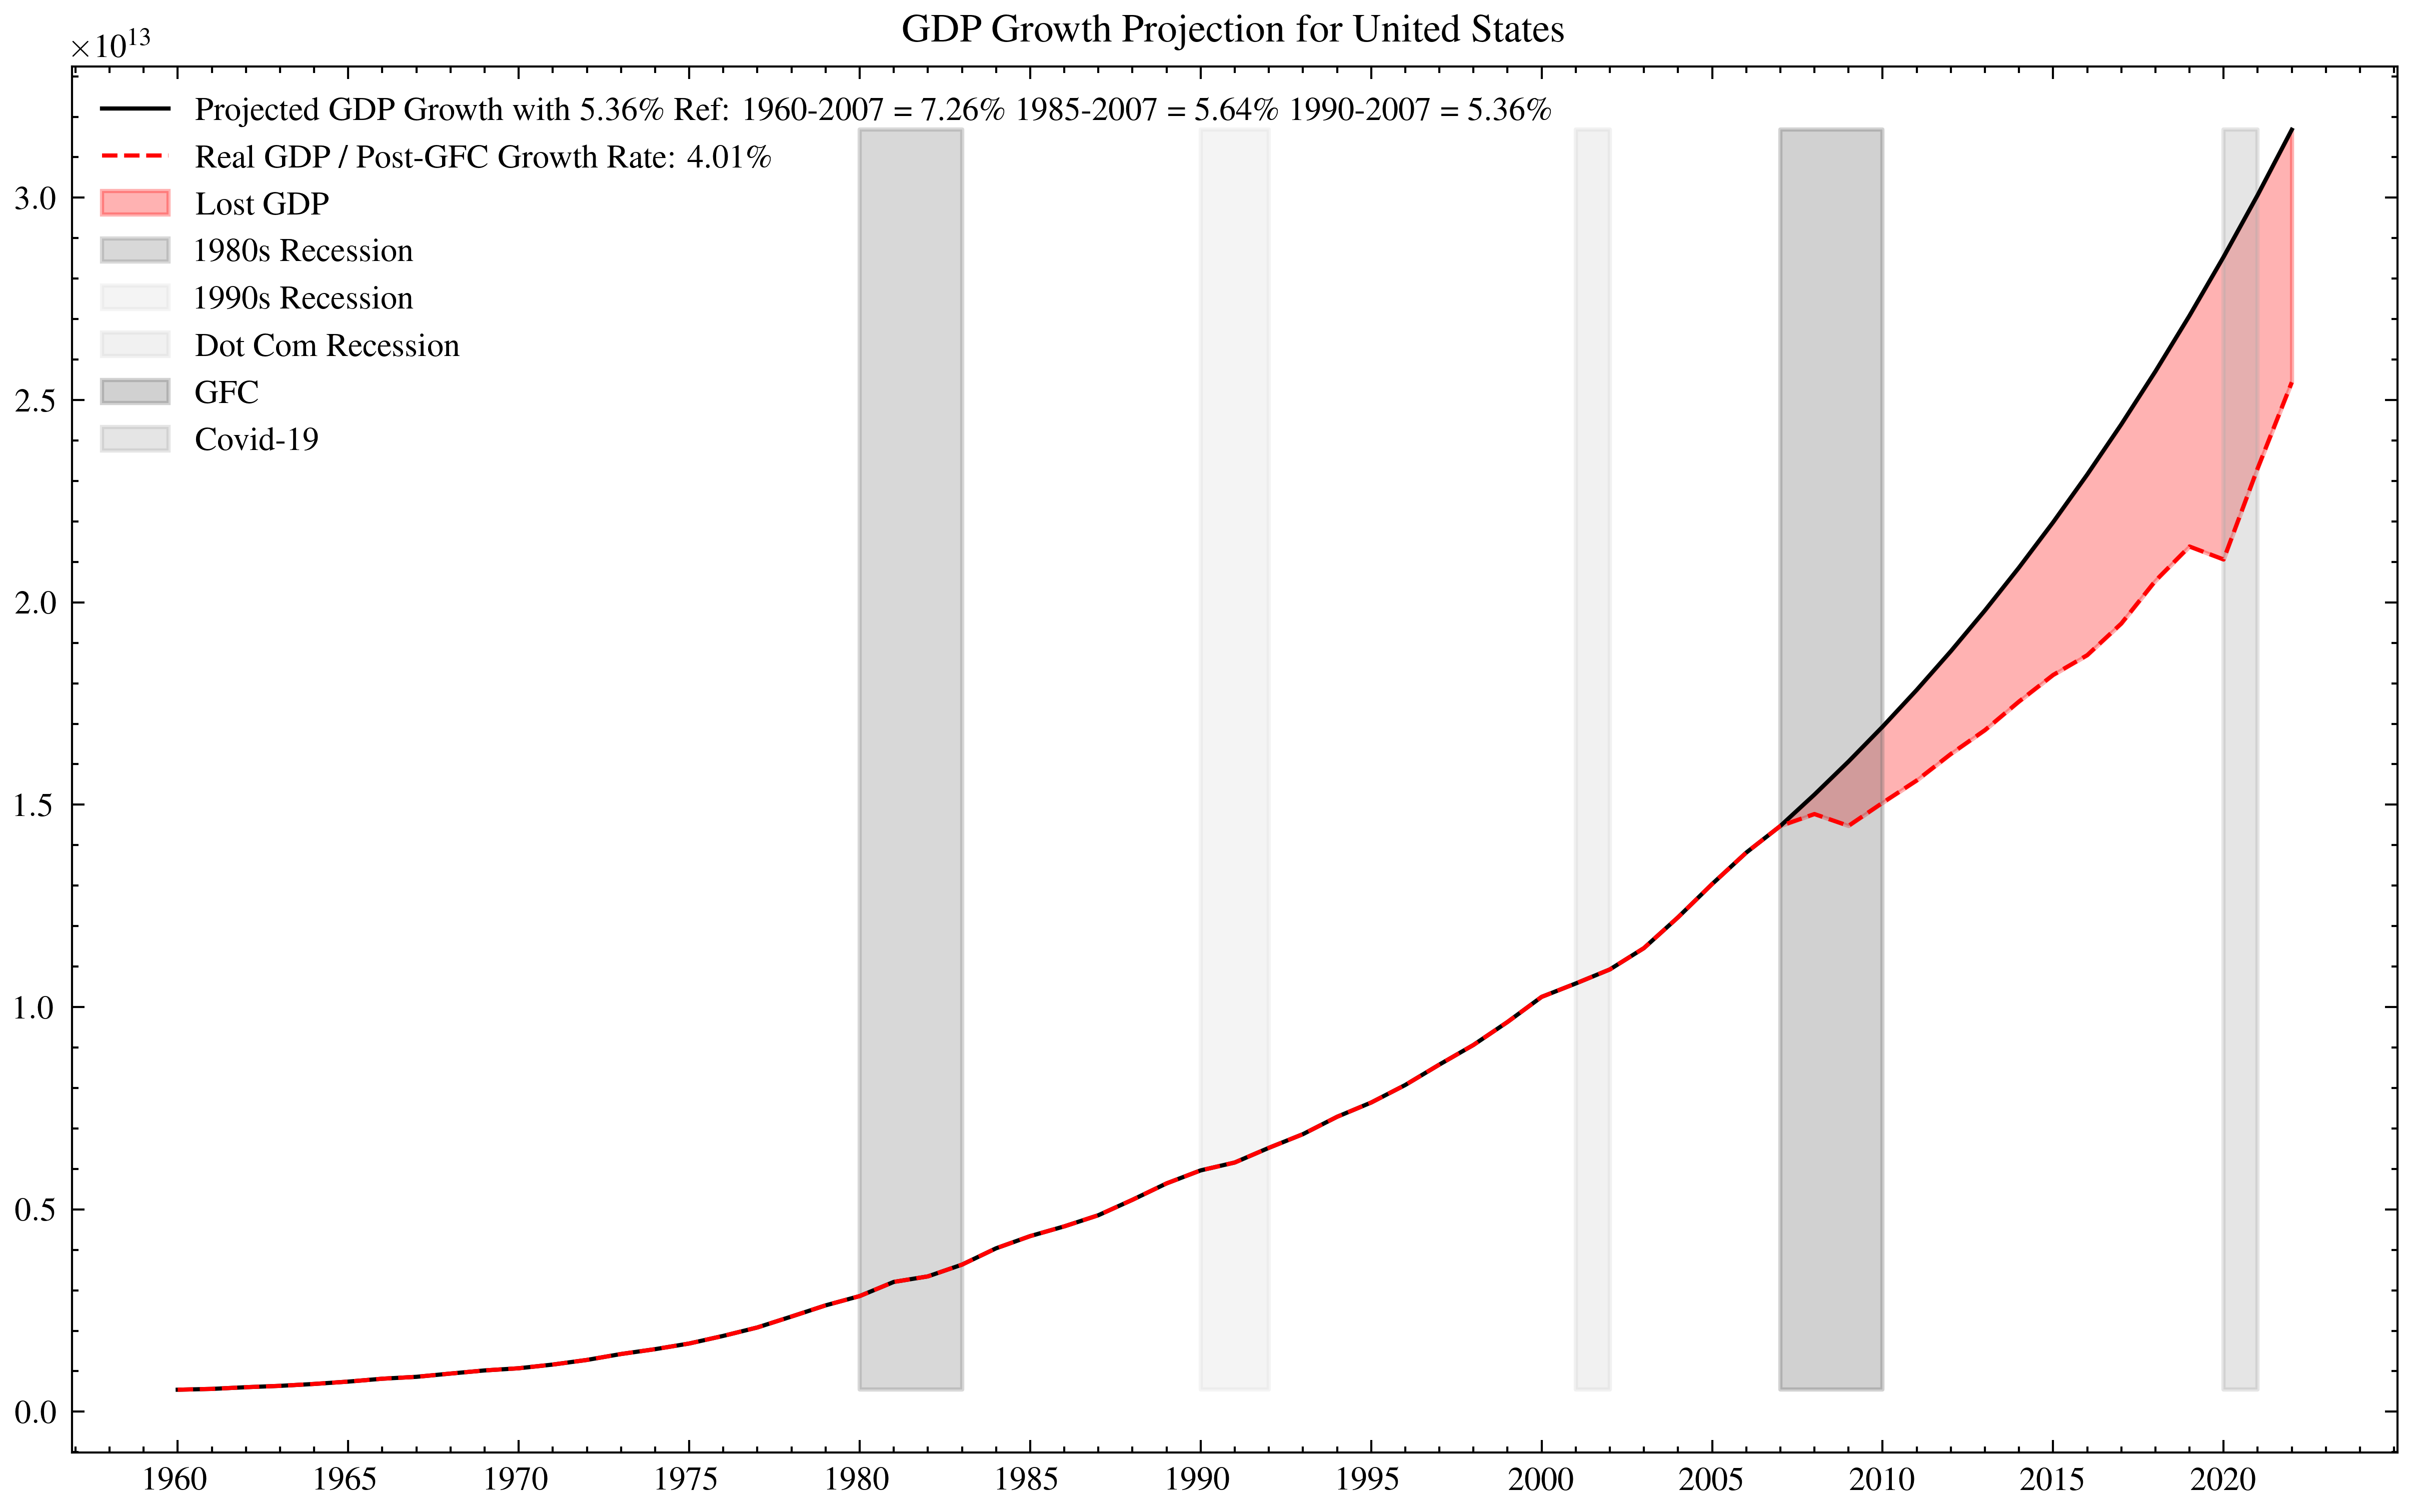
The [generate_projection_plots]function is designed to analyze and project the Gross Domestic Product (GDP) growth of a specified country. It leverages historical GDP data to calculate growth rates over selected periods and generates future GDP projections. The function also visualizes both historical and projected GDP data, highlighting the impact of major economic recessions.
- [country] (str): The name of the country for which the GDP projection is to be generated.
- [gr] (float, optional): The custom growth rate to be used for projections. Default is 0.04 (4%).
- [gr_type] (str, optional): Specifies the method to calculate the growth rate. Options include 'average', 'median', '85s', '90s', 'post07', 'set', and 'custom'. Default is 'average'.
- [num_periods] (int, optional): The number of future periods for which projections are to be made. Default is 15.
- [save_fig](bool, optional): If [True] saves the generated plot as a PNG file. Default is [True].
- Data Loading: Reads GDP data from an Excel file named
MKTP_GDP.xlsand isolates the data for the specified country. - Growth Rate Calculation: Depending on the [gr_type] calculates the growth rate using historical GDP data. This can be an average, median, specific to certain decades, or a user-defined custom rate.
- Projection Generation: Utilizes the calculated or specified growth rate to generate GDP projections for the specified number of future periods beyond 2007.
- Visualization: Plots the historical GDP data up to 2007 alongside the projected GDP data. It also visualizes the difference between projected and actual GDP data post-2007 if available and marks recession periods with shaded areas.
- Output: Optionally saves the plot as an image file and displays it.
generate_projection_plots("France", gr=0.04, gr_type='90s', num_periods=15, save_fig=True)This example generates and visualizes the GDP growth projection for France, using the average growth rate from the 1990s, over 15 future periods, and saves the plot as an image file.
- Ensure the Excel file
MKTP_GDP.xlsis correctly placed and accessible. - The function requires
pandas,matplotlib, andnumpylibraries. Ensure these are installed and imported in your environment. - The function is designed to handle missing data and incorrect country names gracefully, providing feedback for user correction.
