This project mainly aims to provide:
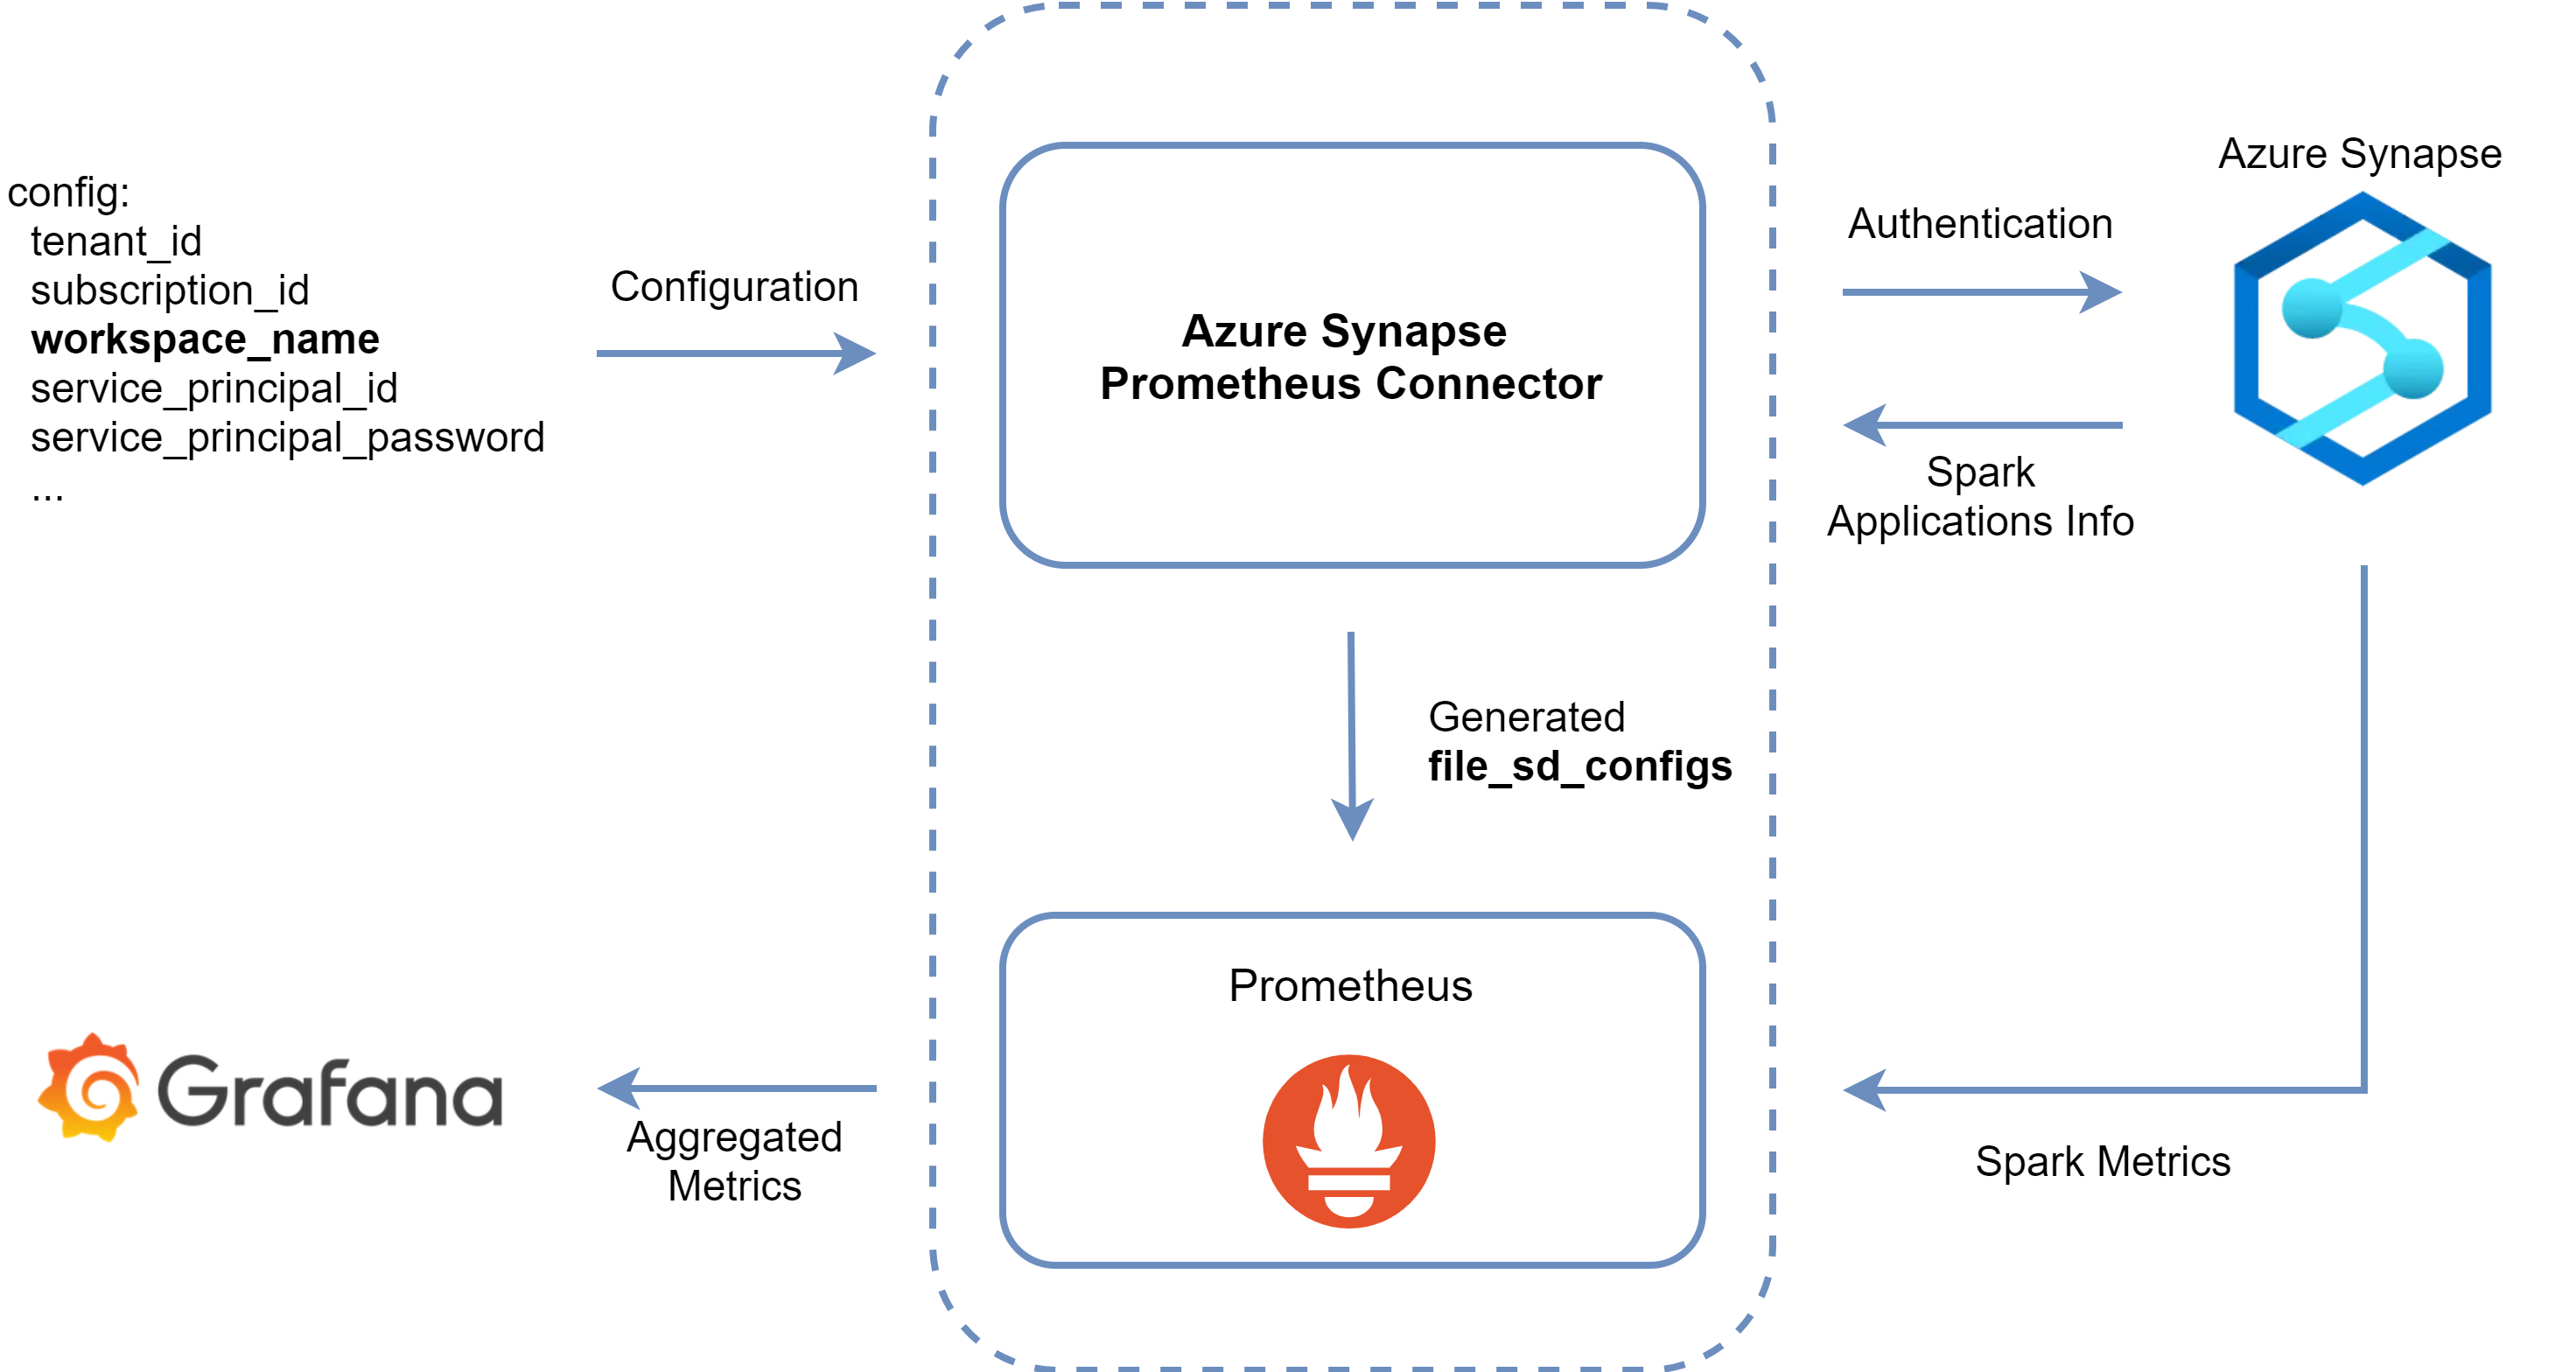
- Azure Synapse Apache Spark metrics monitoring for Azure Synapse Spark applications by leveraging Prometheus, Grafana and Azure APIs.
- Azure Synapse Prometheus connector for connecting the on-premises Prometheus server to Azure Synapse Analytics workspace metrics API.
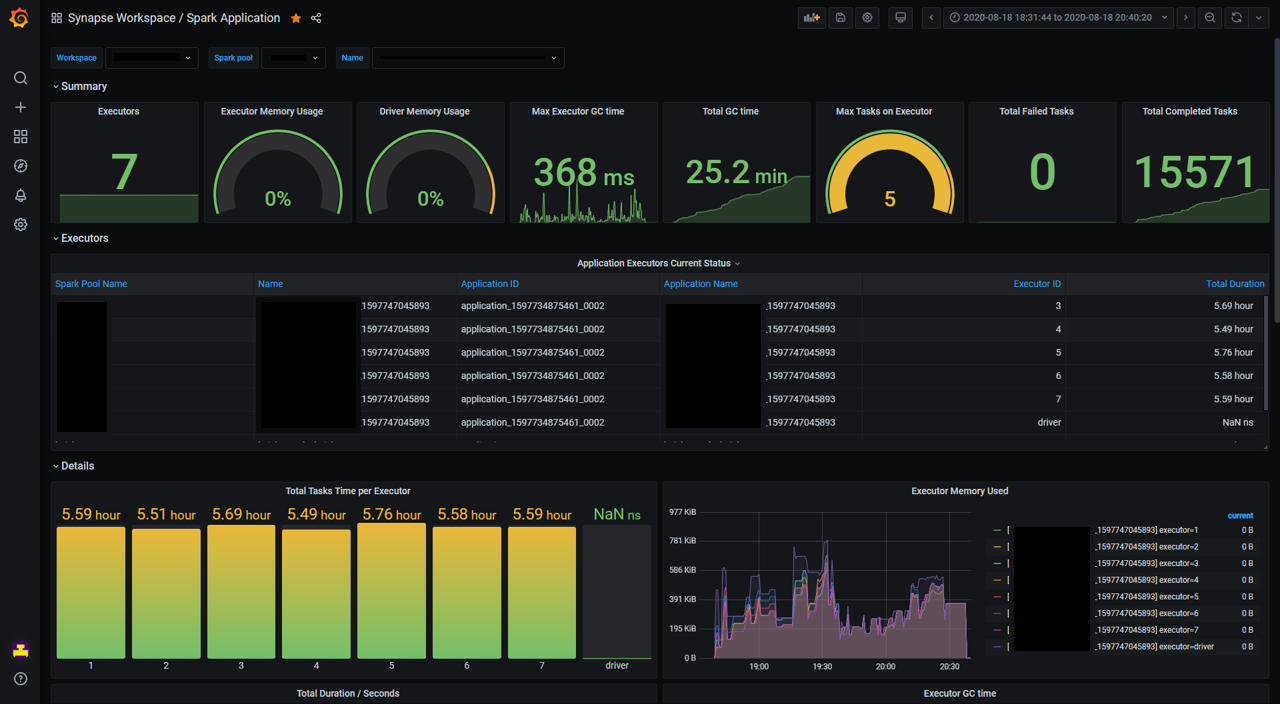
- Grafana dashboards for synapse spark metrics visualization.
- Helm chart for Prometheus and Grafana deployment on AKS, including the connector, Prometheus servers and Grafana dashboards for metrics users.
The dataflow:
Grafana dashboard screenshot:
Or just use the out-of-box Azure Cloud Shell, which includes all above tools.
-
Create a Azure Kubernetes (1.16+, or use Minikube instead)
az login
az account set --subscription "<subscription_id>"
az aks create --name <kubernetes_cluster_name> --resource-group <kubernetes_cluster_rg> --location eastus --node-vm-size Standard_D2s_v3
az aks get-credentials --name <kubernetes_cluster_name> --resource-group <kubernetes_cluster_rg>
-
Create a service principal and grant permission to synapse workspace
az ad sp create-for-rbac --name <service_principal_name>
The result should look like:
{
    "appId": "abcdef...",
    "displayName": "<service_principal_name>",
    "name": "http://<service_principal_name>",
    "password": "abc....",
    "tenant": "<tenant_id>"
}
Note down the appId, password, and tenant id.
- Login to your Azure Synapse Analytics workspace as Synapse Administrator
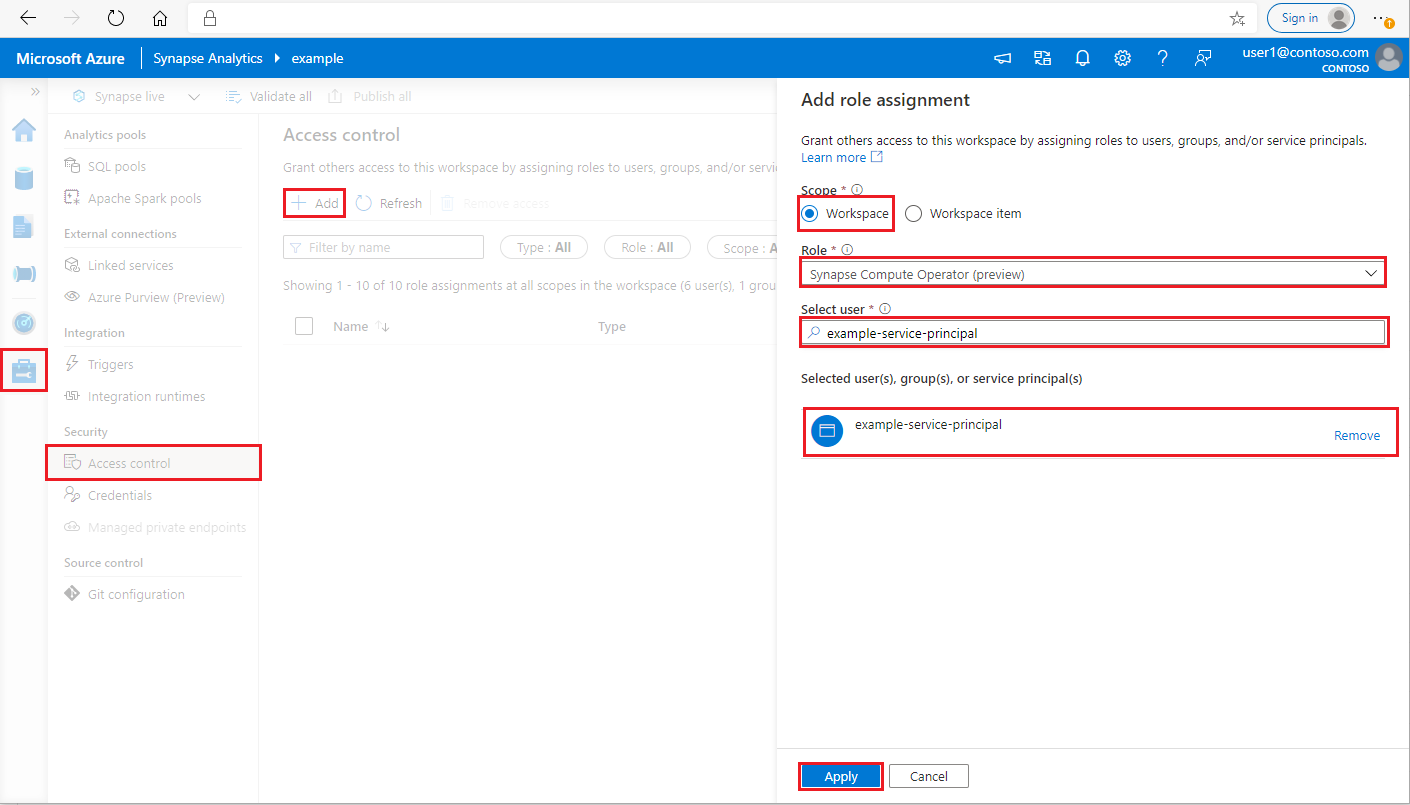
- In Synapse Studio, on the left-side pane, select Manage > Access control
- Click the Add button on the upper left to add a role assignment
- For Scope choose Workspace
- For Role choose Synapse Compute Operator
- For Select user input your <service_principal_name> and click your service principal
- Click Apply
Wait 3 minutes for permission to take effect.
Note: Make sure your service principal has at least a "Reader" role in your Synapse workspace. Go to Access Control (IAM) tab of the Azure portal and check the permission settings.
-
Install Synapse Prometheus Operator
Add synapse-prometheus-operator repo to Helm client
helm repo add synapse-charts https://github.com/microsoft/azure-synapse-spark-metrics/releases/download/helm-chart
Install by Helm client:
helm install spo synapse-charts/synapse-prometheus-operator --create-namespace --namespace spo \ --set synapse.workspaces[0].workspace_name="<workspace_name>" \ --set synapse.workspaces[0].tenant_id="<tenant_id>" \ --set synapse.workspaces[0].service_principal_name="<service_principal_app_id>" \ --set synapse.workspaces[0].service_principal_password="<service_principal_password>" \ --set synapse.workspaces[0].subscription_id="<subscription_id>" \ --set synapse.workspaces[0].resource_group="<workspace_resource_group_name>"- workspace_name: Synapse workspace name.
- subscription_id: Synapse workspace subscription id.
- workspace_resource_group_name: Synapse workspace resource group name.
- tenant_id: Synapse workspace tenant id.
- service_principal_name: The service principal name (or known as "appId")
- service_principal_password: The service principal password you just created.
For more details, please refer to config.example.yaml
-
Open Grafana and enjoy!
# Get password
kubectl get secret --namespace spo spo-grafana -o jsonpath="{.data.admin-password}" | base64 --decode ; echo
# Get service ip, copy & paste the external ip to browser, and login with username 'admin' and the password.
kubectl -n spo get svc spo-grafana
Find Synapse Dashboard on the upper left corner of the Grafana page (Home -> Synapse Workspace / Synapse Application), try to run a example code in Synapse Studio notebook and wait a few seconds for the metrics pulling.
Remove the operators.
# helm delete <release> -n <namespace>
helm delete spo -n spo
Remove the Kubernetes cluster.
az aks delete --name <kubernetes_cluster_name> --resource-group <kubernetes_cluster_rg>helm install spo ./synapse-prometheus-operator --create-namespace --namespace spo \
--set synapse.workspaces[0].workspace_name="<workspace_name>" \
--set synapse.workspaces[0].tenant_id="<tenant_id>" \
--set synapse.workspaces[0].service_principal_name="<service_principal_app_id>" \
--set synapse.workspaces[0].service_principal_password="<service_principal_password>" \
--set synapse.workspaces[0].subscription_id="<subscription_id>" \
--set synapse.workspaces[0].resource_group="<workspace_resource_group_name>"
cd synapse-prometheus-connector
docker build -t "synapse-prometheus-connector:${Version}" -f Dockerfile .This project welcomes contributions and suggestions. Most contributions require you to agree to a Contributor License Agreement (CLA) declaring that you have the right to, and actually do, grant us the rights to use your contribution. For details, visit https://cla.opensource.microsoft.com.
When you submit a pull request, a CLA bot will automatically determine whether you need to provide a CLA and decorate the PR appropriately (e.g., status check, comment). Simply follow the instructions provided by the bot. You will only need to do this once across all repos using our CLA.
This project has adopted the Microsoft Open Source Code of Conduct. For more information see the Code of Conduct FAQ or contact opencode@microsoft.com with any additional questions or comments.


