For the traces workshop please see Hands-On Tracing
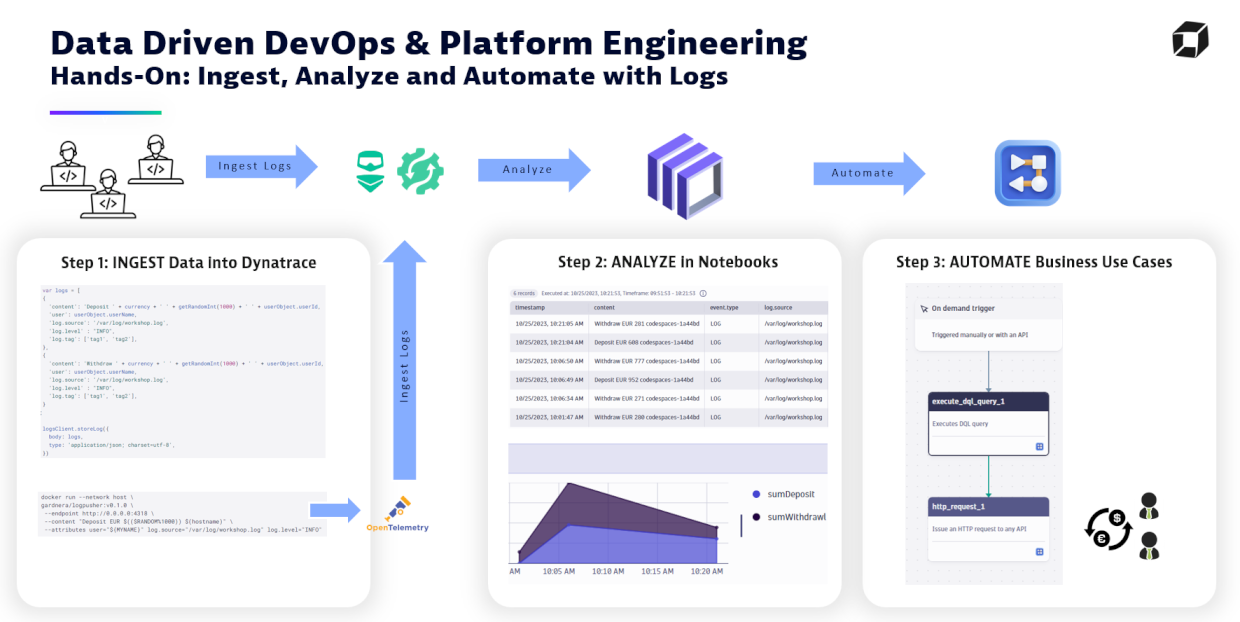
This is a tutorial material for the workshop series on Data Driven DevOps & Platform Engineering with Dynatrace.
Got feedback or questions?: devrel@dynatrace.com
The goal of this workshop is to educate on
- INGEST observability data (logs, traces, metrics ..) using OpenTelemetry, Log API or Dynatrace OneAgent
- ANALYZE and COLLABORATE on data using Dynatrace Notebooke
- AUTOMATE based on that this data
Click here to learn more about Dynatrace Log Management and Analytics capabilities
We have this Dynatrace Notebook that contains all step-by-step instructions that workshp attendees can do within the Dynatrace platform. You will either be given a link to this Notebook in the Workshop Environment or you can simply download the Notebook and Import it into your own Dynatrace Tenant!
For sending in data from outside the platform please follow the steps further down in this readme.
Some of our hands-on will require us to send in data from an external machine, e.g: your workstation, a virtual machine, a GitHub Codespace or GitPod.
We suggest that you first FORK this repository into your own GitHub Account
If you decide to use your own laptop or virtual machine then clone this repository to your local drive and then execute .devcontainer/on-create.sh
To make things easier we can just create a Codespace or use a service such as GitPod which will create a VM for you and will then execute the on-create.sh scripts automatically. Later on we will need to uniquly identify our log entries. There please export your name (can be real or made up) in the USER env variable - like this:
MYNAME="Ruler of OpenTelemetry"
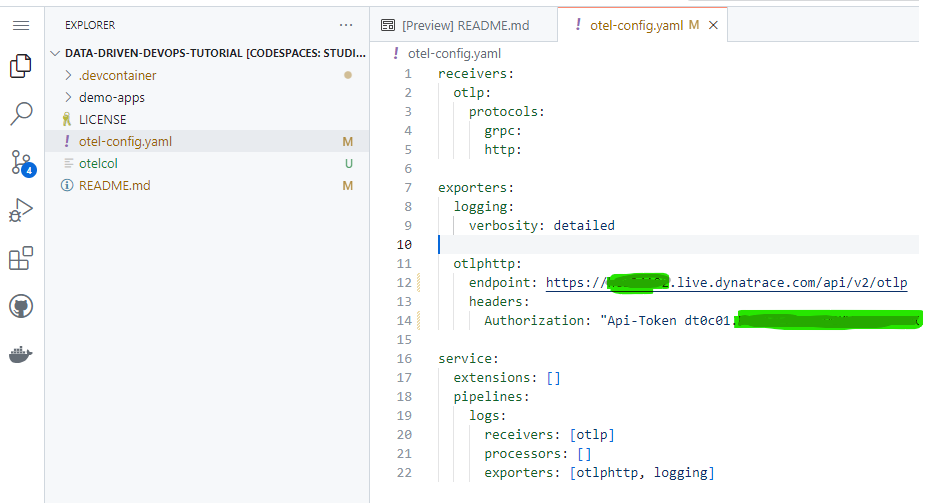
The tutorial uses an OpenTelemetry collector which we need to configure with the correct Dynatrace OTLP Endpoint. For this simply edit the otel-config.yaml file and specify the correct Dynatrace Tenant URL and also specify your OpenTelemetry Ingest Token.
You can either use your own Dynatrace Tenant and then create a token with the scopes: events.ingest,logs.ingest,metrics.ingest,openTelemetryTrace.ingest
OR you can use the data provided by your instructor in case you are doing this excercise as part of a Hands-on Dynatrace Workshop!
Simple launch the collector which was downloaded by the on-create.sh script like this:
./otelcol --config=otel-config.yaml
There are different ways to now send logs to the OpenTelemetry collector. Typically this is done by the application that you have instrumented with OpenTelemetry or you can use tools such as FluentD or FluentBit to capture logs and send them to the collector.
DISCLAIMER: Logpusher is just a tool for demo purposes In our hands-on we will use an open source helper tool that is called Logpusher from Adam Gardner.
The docker container from Logpusher has already been downloaded. We can now execute the following command that will create a log entry that matches the pattern of the hands-on you have probably aready done in the Dynatrace Notebook!
docker run --network host \
gardnera/logpusher:v0.1.0 \
 --endpoint http://0.0.0.0:4318 \
 --content "Deposit EUR $(($RANDOM%1000)) $(hostname)" \
 --attributes user="${MYNAME}" log.source="/var/log/workshop.log" log.level="INFO"

docker run --network host \
gardnera/logpusher:v0.1.0 \
 --endpoint http://0.0.0.0:4318 \
 --content "Withdraw EUR $(($RANDOM%1000)) $(hostname)" \
 --attributes user="${MYNAME}" log.source="/var/log/workshop.log" log.level="INFO"


