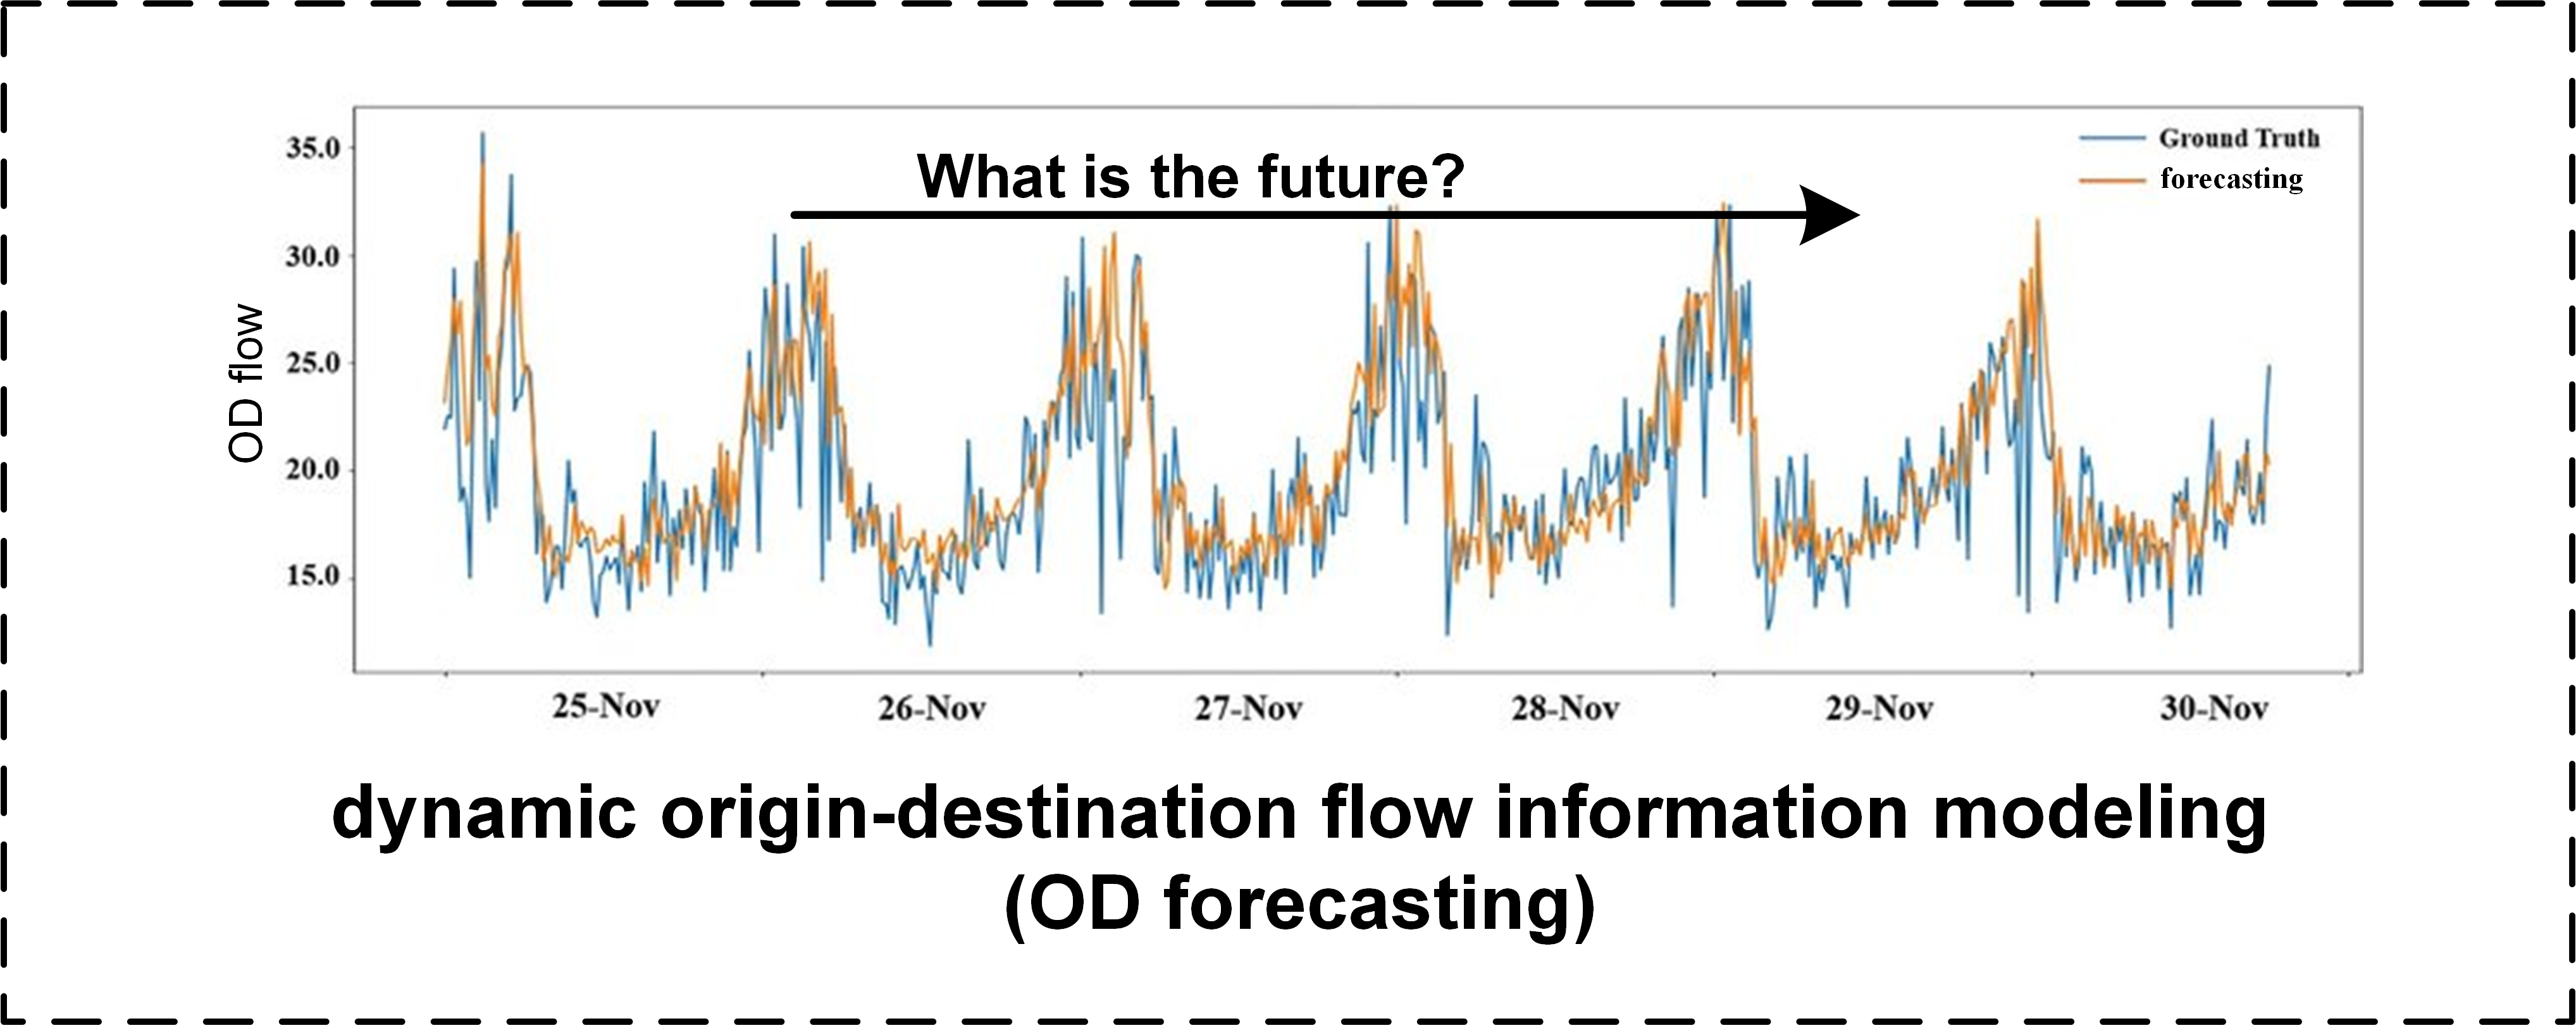
Problem Definition. Given a historical dataset of OD flows
dgl==1.1.0
matplotlib==3.1.1
numpy==1.21.6
pandas==1.1.5
Pillow==9.5.0
scikit_learn==0.24.2
scipy==1.3.1
tensorflow==2.12.0
tf_slim==1.1.0
torch==1.13.1
torch_geometric==2.3.1
tqdm==4.62.3
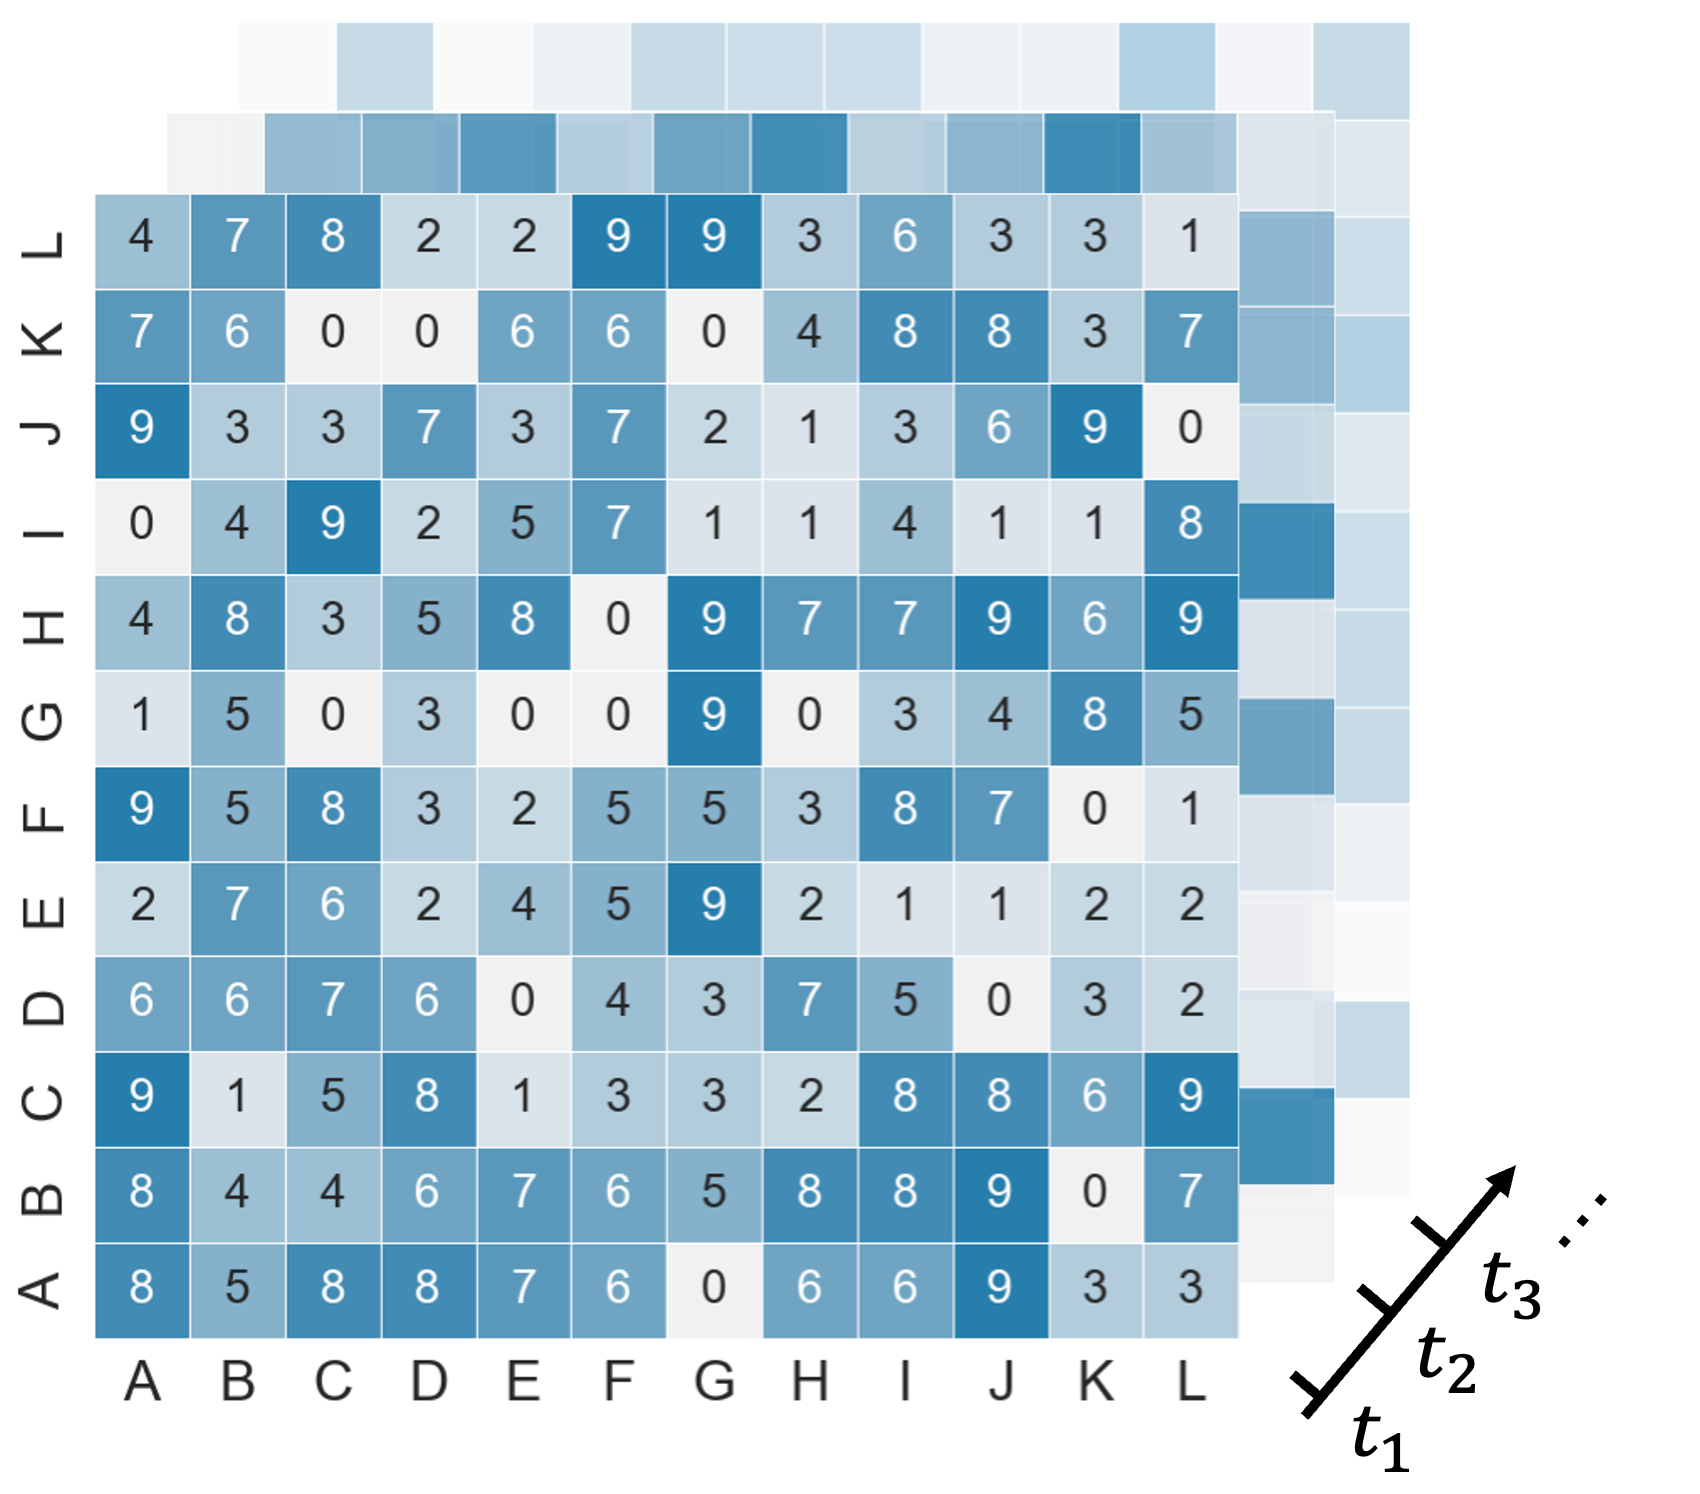
Firstly, divide the area to be studied into several grids on the map.
The first data description method is to divide time into discrete time intervals, count the OD flow at each time interval, and record it as an OD matrix. In every slot,
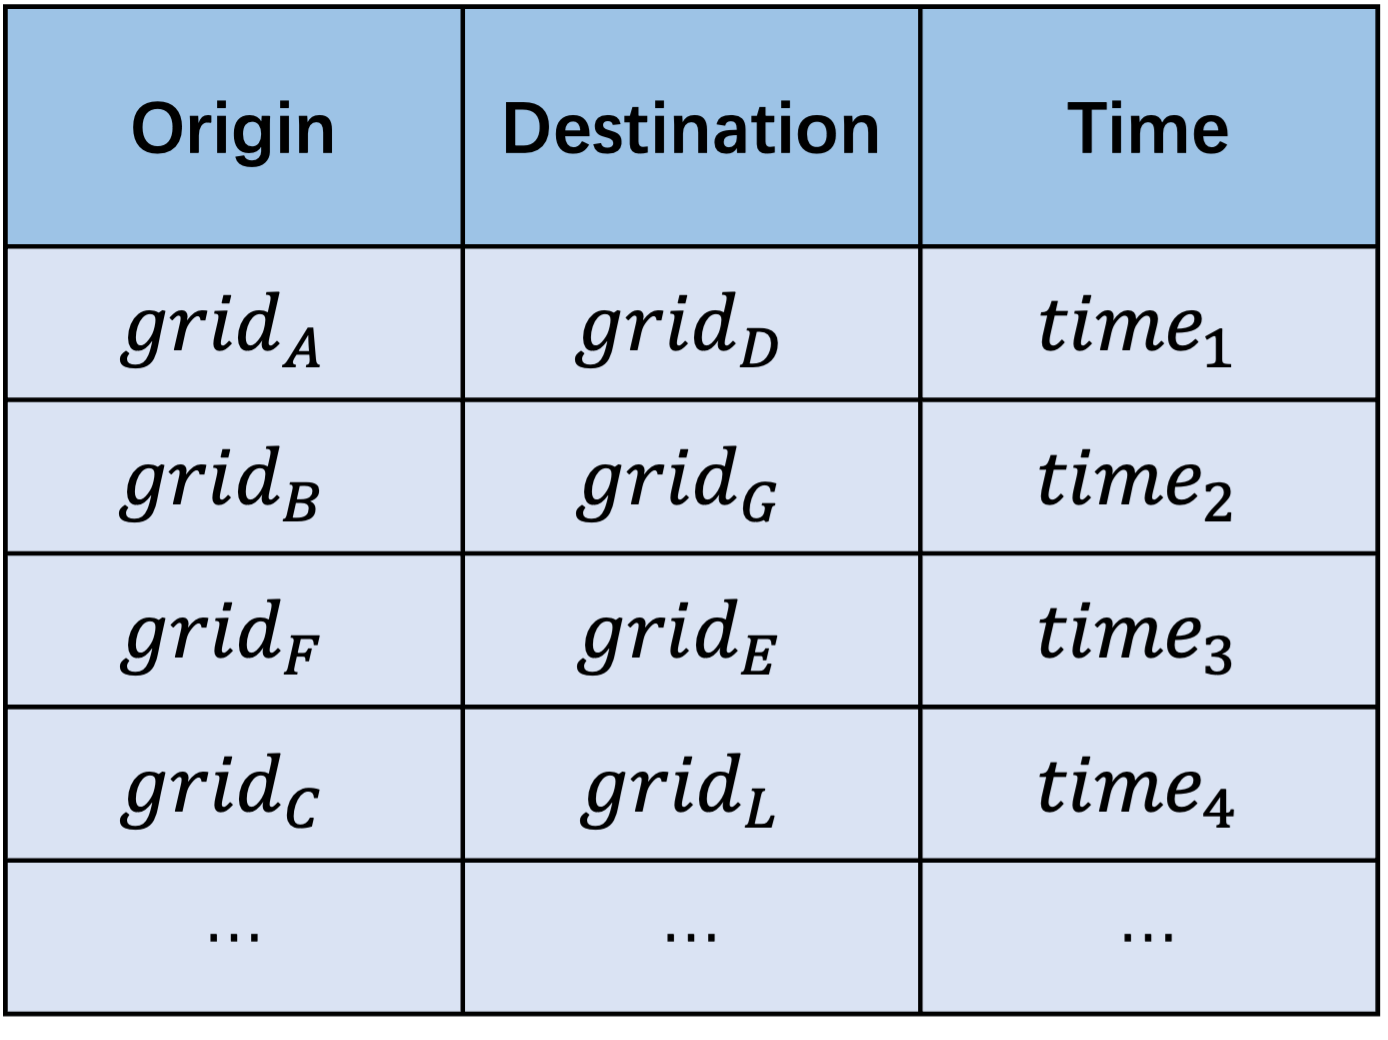
The second data description method is to record the starting point, ending point, and departure time (arrival time) of each OD flow.
| model | Spatial Topology Construction | Spatial Feature Modeling | Temporal Modeling | Learning |
|---|---|---|---|---|
| GEML | grids as nodes geo-adjacency graph POI-similarity graph |
GCN | LSTM | multi-task learning |
| MPGCN | regions as nodes distance-based graph POI-similarity graph OD flow-based graph |
2DGCN | LSTM | MSELoss |
| Gallet | regions as nodes OD flow-based graph distance-based graph |
spatial attention | temporal attention | MSELoss |
| gMHC-STA | region-pairs as nodes fully-connected graph |
GCN + spatial attention | self-attention | MSELoss |
| ST-VGCN | region-pairs as nodes OD flow-based graph |
GCN + gated mechanism | GRU | MSELoss |
| MVPF | stations as nodes distance-based graph |
GAT | GRU | MSELoss |
| Hex D-GCN | hexagonal grids as nodes taxi path-based dynamic graph |
GCN | GRU | MSELoss |
| CWGAN-GP | OD matrix as an image | CNN | CNN | GAN-based training |
| SEHNN | stations as nodes geo-adjacency graph |
GCN | LSTM | VAE-based training |
| HC-LSTM | grids as nodes OD flow-based graph in/out flow as an image OD matrix as an image |
CNN + GCN | LSTM | MSELoss |
| ST-GDL | regions as nodes distance-based graph |
CNN + GCN | CNN | MSELoss |
| PGCN | region pairs as nodes OD flow-based graph |
GCN + gated mechanism | none | probabilistic inference with Monte Carlo |
| MF-ResNet | OD matrix as an image | CNN | none | MSELoss |
| TS-STN | stations as nodes OD flow-based graph |
temporally shifted graph convolution |
LSTM + attention | Partially MSELoss |
| DMGC-GAN | regions as nodes geo-adjacency graph OD flow-based graph in/out flow-based graph |
GCN | GRU | GAN-based training |
| DNEAT | regions as nodes geo-adjacency graph OD flow-based graph |
attention | attention | MSELoss |
| CAS-CNN | OD matrix as image | CNN | channel-wise attention | masked MSELoss |
| ST-ED-RMGC | region pairs as nodes fully-connected graph geo-adjacency graph POI-based graph disntance-based graph OD flow-based graph |
GCN | LSTM | MSELoss |
| HSTN | regions as nodes geo-adjacency graph in/out flow-based graph |
GCN | GRU+Seq2Seq | MSELoss |
| BGARN | grid clusters as nodes distance-based graph OD flow-based graph |
GCN + attention | LSTM | MSELoss |
| HMOD | regions as nodes OD flow-based graph |
random walk for embedding | GRU | MSELoss |
| STHAN | regions as nodes geo-adjacency graph POI-based graph OD flow-based graph |
convolution by meta-paths + attention | GRU | MSELoss |
| ODformer | regions as nodes | 2D-GCN within Transformer | none | MSELoss |
| CMOD | stations as nodes passengers as edges |
multi-level information aggregation | multi-level information aggregation | continous time forecasting |
| MIAM | stations as nodes railway-based graph |
GCGRU | Transformer | online forecasting |
| DAGNN | regions as nodes fully-connected graph |
subgraph + GCN | TCN | MSELoss |
| model | RMSE | NRMSE | MAE | MAPE | sMAPE |
|---|---|---|---|---|---|
| LSTNet | 24.5363 | 0.5161 | |||
| GCRN | 120.2321 | 24.5363 | 0.5161 | ||
| GEML | 113.8526 | 39.5888 | 3.1885 | ||
| MPGCN | 1.1421 | ||||
| PGCN | |||||
| ST-GDL | |||||
| Gallet | 1081.1332 | 355.7162 | 0.6623 | ||
| Hex D-GCN | |||||
| BGARN | 52.2182 | 10.3148 | 0.5017 | ||
| CMOD | |||||
| AEST |


