This repo provides a demonstration of how bootsector/kernel development can done using Visual Studio. When properly configured, it is possible to have instantaneous F5 debugging against your C, C++ and assembly source files.
In order to utilize Visual Studio as a development environment for operating system development, you must first install the following pre-requisites
- Visual Studio 2015+
- VisualGDB (paid software, see below)
- NASM 2.11.08
- i686-elf-tools
- QEMU 2.8.50.0
- An assembly syntax highlighter, such as AsmHighlighter (though you might have to compile it yourself)
The versions of NASM and QEMU to use are not suggestions. If you wish to use a newer version, I recommend at least verifying you can set breakpoints and step through assembly and C/C++ code with the recommended versions before upgrading
Install QEMU to C:\Program Files (x86)\qemu, NASM to C:\Program Files (x86)\nasm and extract i686-elf-tools to C:\Program Files (x86)\i686-elf-tools (such that the path to your GCC is C:\Program Files (x86)\i686-elf-tools\bin\i686-elf-gcc.exe)
Unfortunately, in order to do operating system development in Visual Studio you will require the third-party add-in VisualGDB. Unlike all of the other software on this list, VisualGDB is not free. You can download a 30-day trial of VisualGDB from their website to demonstrate the principles outlined in this repo.
The first time you launch Visual Studio after installing VisualGDB you may be prompted to configure the VISUALGDB_DIR environment variable (which you should do) as well as whether you want to utilize their Clang-based IntelliSense engine (you can disable all of the options on this prompt). If you are interested in purchasing VisualGDB, my impression is that you will need the Custom VisualGDB edition.
This process has been successfully tested with Visual Studio 2015 + VisualGDB 5.1, Visual Studio 2017 + VisualGDB 5.2 and Visual Studio 2019 + VisualGDB 5.4.
Included in this repo is a sample Visual Studio project capable of debugging into a bootsector and kernel written in assembly and C respectively. Before investigating whether this these steps may be of any use to you, consider opening the VSKernelDev sample solution, adding a few breakpoints in random places (e.g. boot_sect.asm, protected_mode.asm, kernel.c) and observing whether you can actually compile, debug and step through the code in a manner you would expect.
Note that there are a few "gotchas" to consider when compiling and debugging your operating system; please see the Important Considerations section below for more info.
Once you are satisfied this is a form of operating system development you think will work for you, proceed to creating your own solution using the Simple or Step By Step guides below.
- In Visual Studio create a new VisualGDB solution using the Custom Project Wizard. If prompted to configure the custom project's settings, click Finish to leave these unconfigured.
- Once you have created your project, replace the default -Debug.vgdbsettings/-Release.vgdbsettings files with the ones found under this repo (after renaming them to match names of the files you are replacing)
- Start developing your operating system!
If you wish to tweak some of the parameters in the VisualGDB config file this repo provides, the Configuration (Step By Step) section below details how all of the required settings are configured.
- In Visual Studio create a new VisualGDB solution using the Custom Project Wizard. If prompted to configure the custom project's settings, click Finish to leave these as their defaults (we will configure them one by one below)
- Right click your project in Solution Explorer and select VisualGDB Project Properties
-
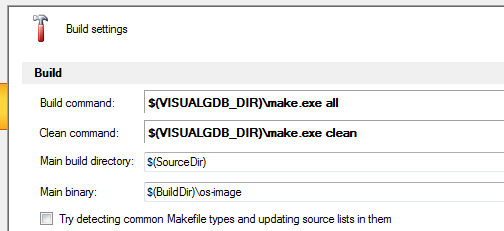
On the Build Settings tab, next to Build command: click Customize and fill in the following details
- Command:
$(VISUALGDB_DIR)\make.exe - Arguments:
all - Working directory:
$(SourceDir)
- Command:
-
Next to Clean Command: click Customize and fill in the following details
- Command:
$(VISUALGDB_DIR)\make.exe - Arguments:
clean - Working directory:
$(SourceDir)
- Command:
-
In the Main binary: field enter the
$(BuildDir)\<image>whereis the name of the file your
Makefilegenerates that contains your entire operating system. e.g. $(BuildDir)\os-imageThe configuration steps outlined in this tutorial assume that all of your output files will be emitted in the most "convenient" place possible (the same place as your source files, the root of your project, etc). If you are interested in having your output files be emitted to a single directory, you should investigate this after you have the basic configuration working.
-
Untick the Try detecting common Makefile types and updating source lists in them option. To begin with we would like to control everything ourselves; you can explore re-enabling options like this once we have the basic configuration working
If you have successfully completed these steps, your Build Settings should look like the following
-
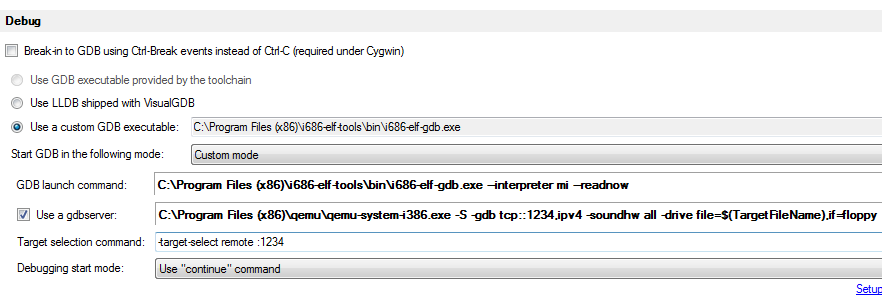
On the Debug settings tab, deselect Break-in to GDB using Ctrl-Break events instead of Ctrl-C (required under Cygwin)
-
Next to Use a custom GDB executable: click Customize and fill in the following details
- GDB debugger executable:
C:\Program Files (x86)\i686-elf-tools\bin\i686-elf-gdb.exe
- GDB debugger executable:
-
Next to
GDB launch command:click Customize and fill in the following details- Arguments:
--interpreter mi --readnow - Working directory:
$(ProjectDir)
- Arguments:
-
Tick the Use a gdbserver: option then click Customize and fill in the following details
- Command:
C:\Program Files (x86)\qemu\qemu-system-i386.exe - Arguments:
-S -gdb tcp::1234,ipv4 -soundhw all -drive file=$(TargetFileName),if=floppy - Working directory:
$(ProjectDir)
-
In the Target selection command: field enter
-target-select remote :1234 -
Change the Debugging start mode: to Use "continue" command
If you have successfully completed these steps, your Build Settings should look like the following
- On the IntelliSense Settings tab, under Clang IntelliSense set the IntelliSense engine: to Use native Visual Studio IntelliSense engine
-
On the GDB settings tab, untick Support 'step into new instance' through breakpoint in:
mainWe don't need a breakpoint in any kind of main function, but if you want one at a later point you can re-enable this and change the function name to the real entrypoint of your kernel or something.
-
On the GDB startup commands tab, under The following GDB commands will be run AFTER selecting a target: enter the following
symbol-file kernel.elf
add-symbol-file boot_sect.elf 0x7c00
directory $(RemoteSourceDir)/src
These will load the symbols for your kernel and bootsector respectively, allowing you to debug through the sourcecode in your debugger.
If you have all of your source under a
src/subdirectory, it appears that NASM may cause all *.asm files but the main one to be resolved using relative, instead of absolute paths, thus resulting in GDB being unable to find them when attempting to set breakpoints. Specifyingdirectory $(RemoteSourceDir)/srcadds thesrc/folder as an additional search location for GDB to use when resolving breakpoint locations. If you're not using asrc/folder, then you likely don't need this line
If you've successfully completed these steps you should be all ready to start developing your operating system using Visual Studio
- When you modify an assembly file and recompile, it doesn't seem to automatically detect such files are modified; as such you may need to force rebuild instead, or investigate how to get your make system detect changes to assembly files
- When stepping through assembly code, until you switch to 32-bit protected mode you may have issues with your source files not always lining up with where the debugger is currently at. This seems to be an unavoidable consequence of trying to debug 16-bit code; once you start debugging 32-bit assembly or C/C++ however it all seems to be fine
- When you terminate QEMU, GDB will detect the process was terminated but won't actually end the debug session (as such you'll need to hit the Stop button yourself). If you know how to workaround this, please let me know!
- If you try and create a
Makefilein Solution Explorer with no file extension Visual Studio will probably add a .cpp to the end of it again and move it under the Source files filter. You will probably want to remove the extension again and maybe move it under the project root, outside the Source files filter - Remember that in C++ projects, folders in Solution Explorer simply represent "filters" rather than actual folders; as such as you start organizing your files remember to place your new files under the actual folder they belong in, along with organizing them under the correct filter
- QEMU versions newer than the stipualted version may experience errors when the provided version of GDB 8.0 attempts to attach to them. If you wish to use a newer QEMU version, you will need to investigate whether modifying your QEMU command line arguments or compiling a newer GDB version resolves this issue
- NASM versions newer than the stipulated version may not generate symbol files properly, resulting in breakpoints in
%include'd assembly files always hitting the last line of the file. If you wish to use a newer NASM version, you will need to investigate whether modifying your NASM command line arguments or compiling a newer GDB version resolves this issue

