This example demonstrates the "outbox pattern", an approach for letting services communicate in an asynchronous and reliable fashion. It accompanies this post on the Debezium blog.
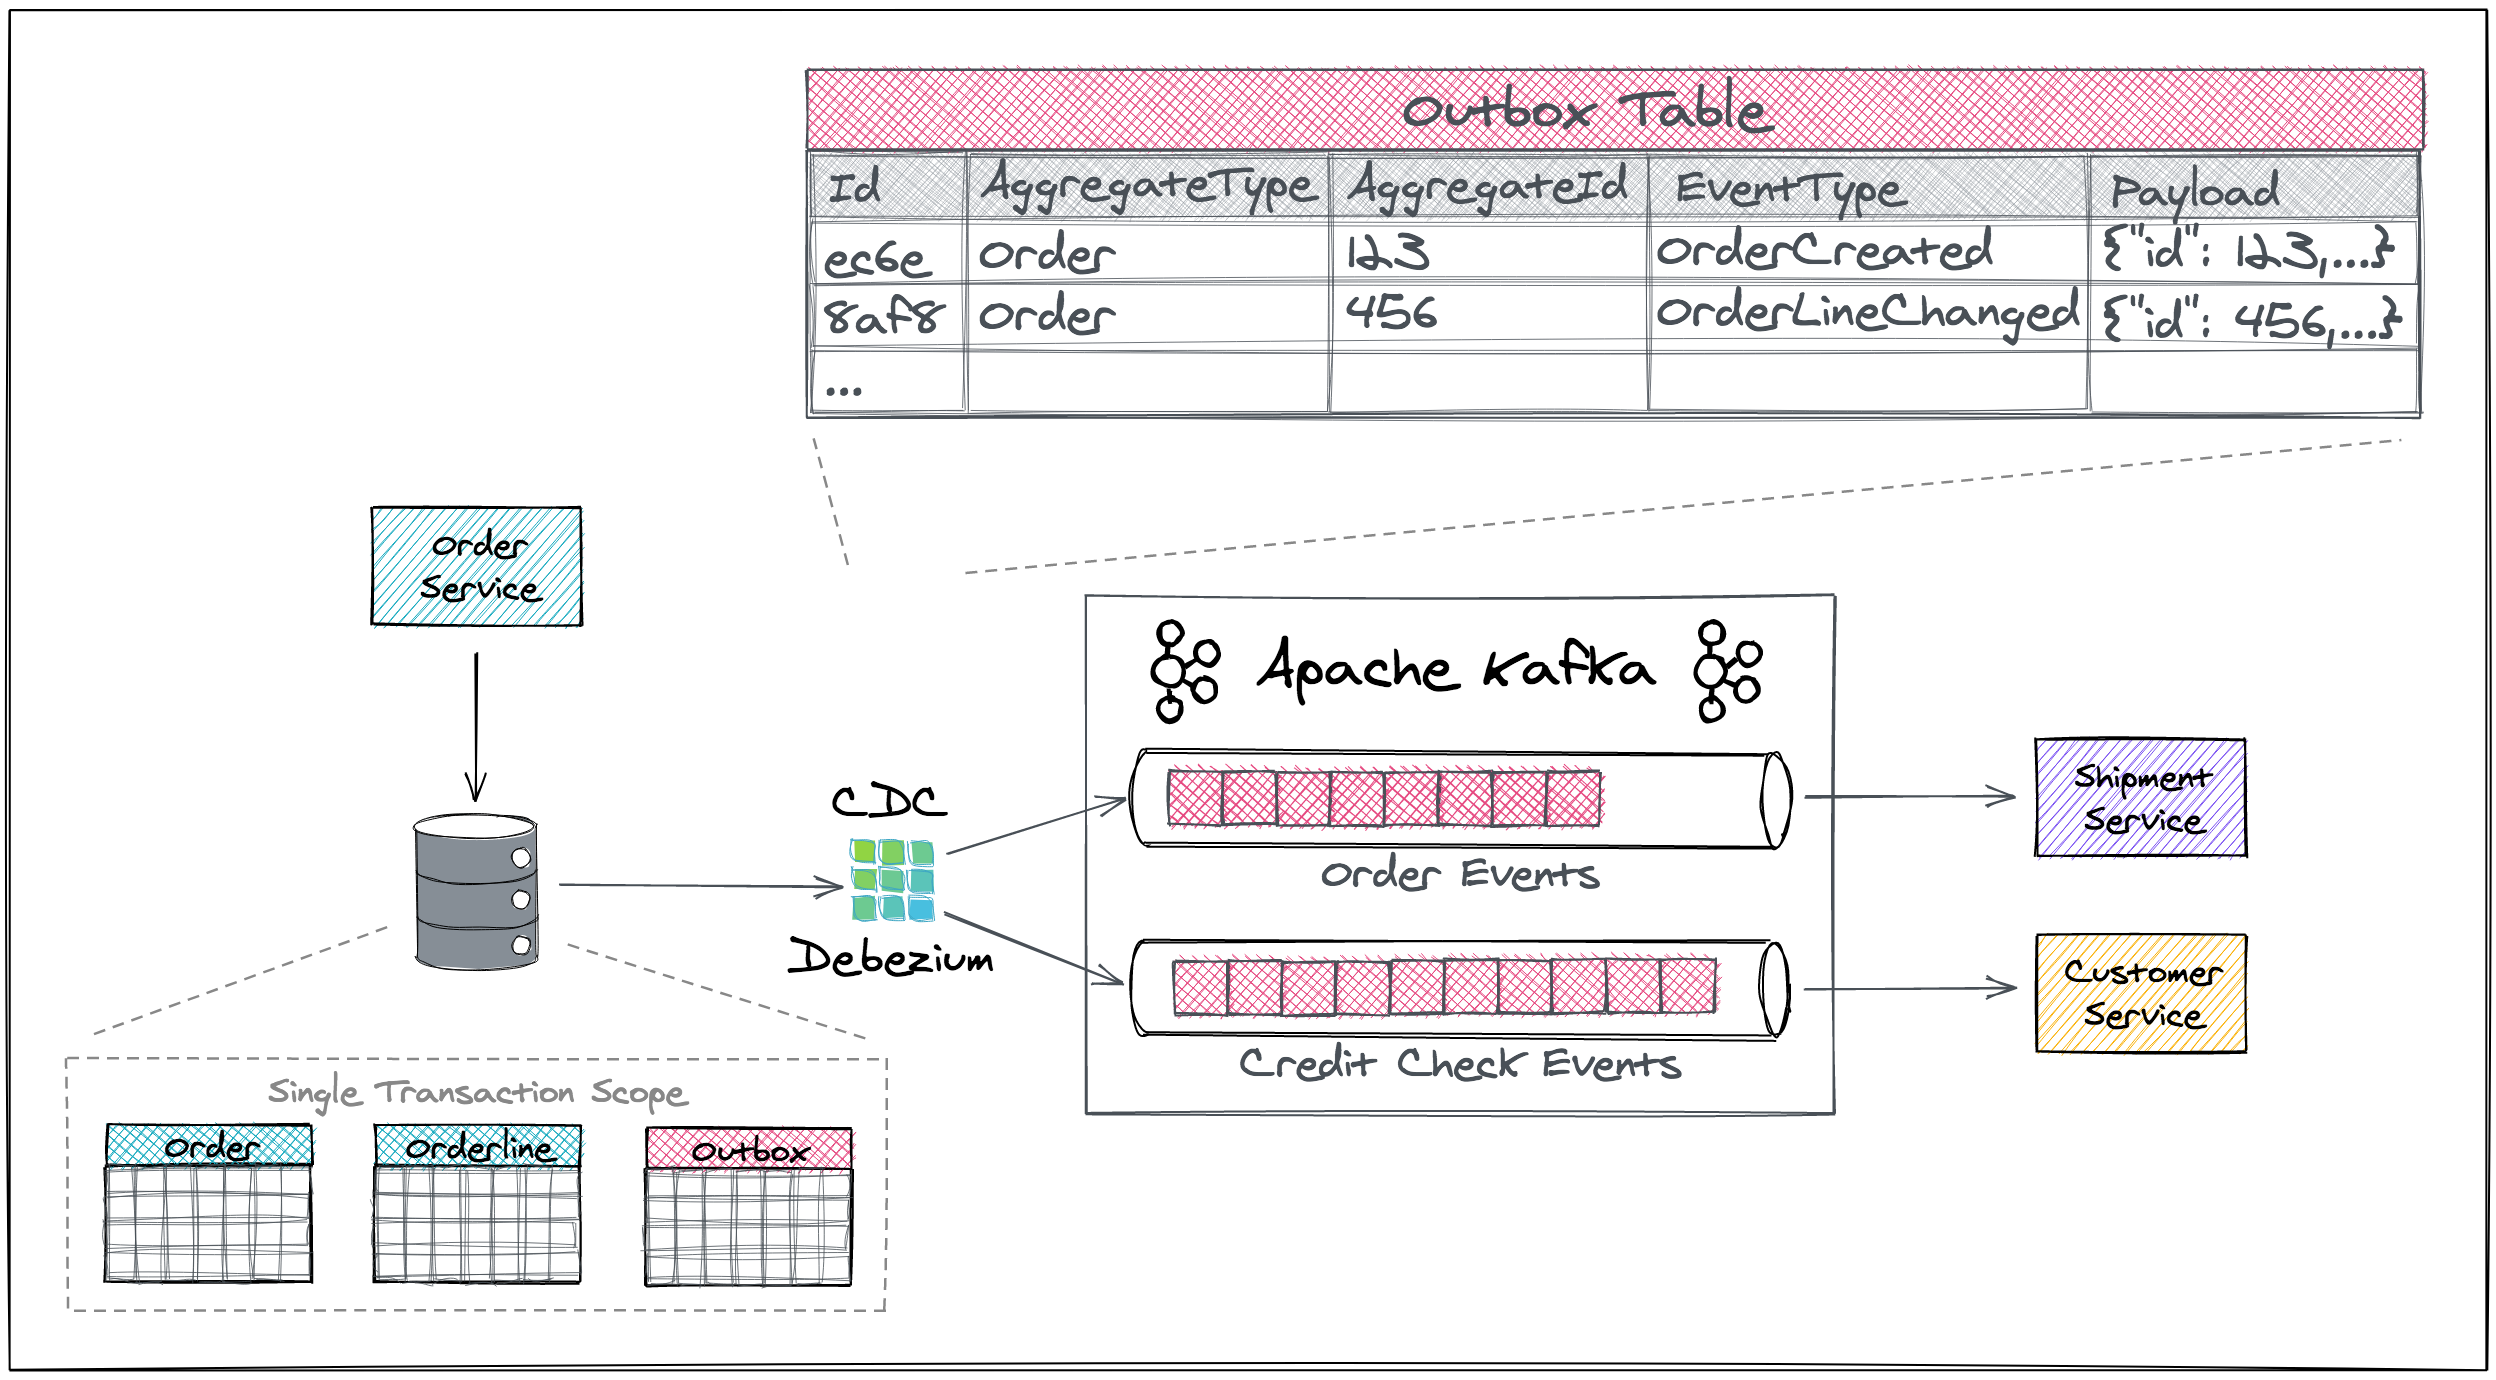
The sending service ("order-service") produces events in an "outbox" event table within its own local database. Debezium captures the additions to this table and streams the events to consumers via Apache Kafka. The receiving service ("shipment-service") receives these events (and would apply some processing based on them), excluding any duplicate messages by comparing incoming event ids with already successfully consumed ids.
Both services are implemented using the Quarkus stack. This allows building a native binary of each service, resulting in significantly less memory usage and faster start-up than the JVM-based version.
The overall solution looks like so:
Prepare the Java components by first performing a Maven build.
$ mvn clean install -PnativeThis illustrates the usage of Quarkus' native profile mode where the quarkus-maven-plugin will generate not only JVM-based artifacts but also native images.
The native profile can be omitted if native image artifacts aren't required.
Setup the necessary environment variables
$ export DEBEZIUM_VERSION=1.8
$ # optionally, enable the native build
$ export QUARKUS_BUILD=native
The DEBEZIUM_VERSION specifies which version of Debezium artifacts should be used.
The QUARKUS_BUILD specifies whether docker-compose will build containers using Quarkus in JVM or Native modes.
The default is jvm for JVM mode but native can also be specified to build Quarkus native containers.
Start all components:
$ docker-compose up --buildThis executes all configurations set forth by the docker-compose.yaml file.
It's important to note that sometimes the order or shipment service may fail to start if the dependent database takes longer than expected to initialize.
If that happens, simply re-execute the command again, and it will start the remaining services.
Register the connector that to stream outbox changes from the order service:
$ http PUT http://localhost:8083/connectors/outbox-connector/config < register-postgres.json
HTTP/1.1 201 CreatedPlace a "create order" request with the order service:
$ http POST http://localhost:8080/orders < resources/data/create-order-request.jsonCancel one of the two order lines:
$ http PUT http://localhost:8080/orders/1/lines/2 < resources/data/cancel-order-line-request.jsonExamine the events produced by the service using kafkacat:
$ docker run --tty --rm \
    --network outbox_default \
    quay.io/debezium/tooling:1.2 \
    kafkacat -b kafka:9092 -C -o beginning -q \
    -f "{\"key\":%k, \"headers\":\"%h\"}\n%s\n" \
    -t Order.events | jq .
Examine that the receiving service process the events:
$ docker-compose logs shipment-service(Look for "Processing '{OrderCreated|OrderLineUpdated}' event" messages in the logs)
Getting a session in the Postgres DB of the "order" service:
$ docker run --tty --rm -i \
        --network outbox_default \
        quay.io/debezium/tooling:1.2 \
        bash -c 'pgcli postgresql://postgresuser:postgrespw@order-db:5432/orderdb'
E.g. to query for all purchase orders:
select * from inventory.purchaseorder po, inventory.orderline ol where ol.order_id = po.id;Query for all outbox events:
select id, aggregatetype, aggregateid, type, timestamp, left(payload, 100) from inventory.outboxevent;Getting a session in the Postgres DB of the "shipment" service:
$ docker run --tty --rm -i \
        --network outbox_default \
        quay.io/debezium/tooling:1.2 \
        bash -c 'pgcli postgresql://postgresuser:postgrespw@shipment-db:5432/shipmentdb'
E.g. to query for all shipments:
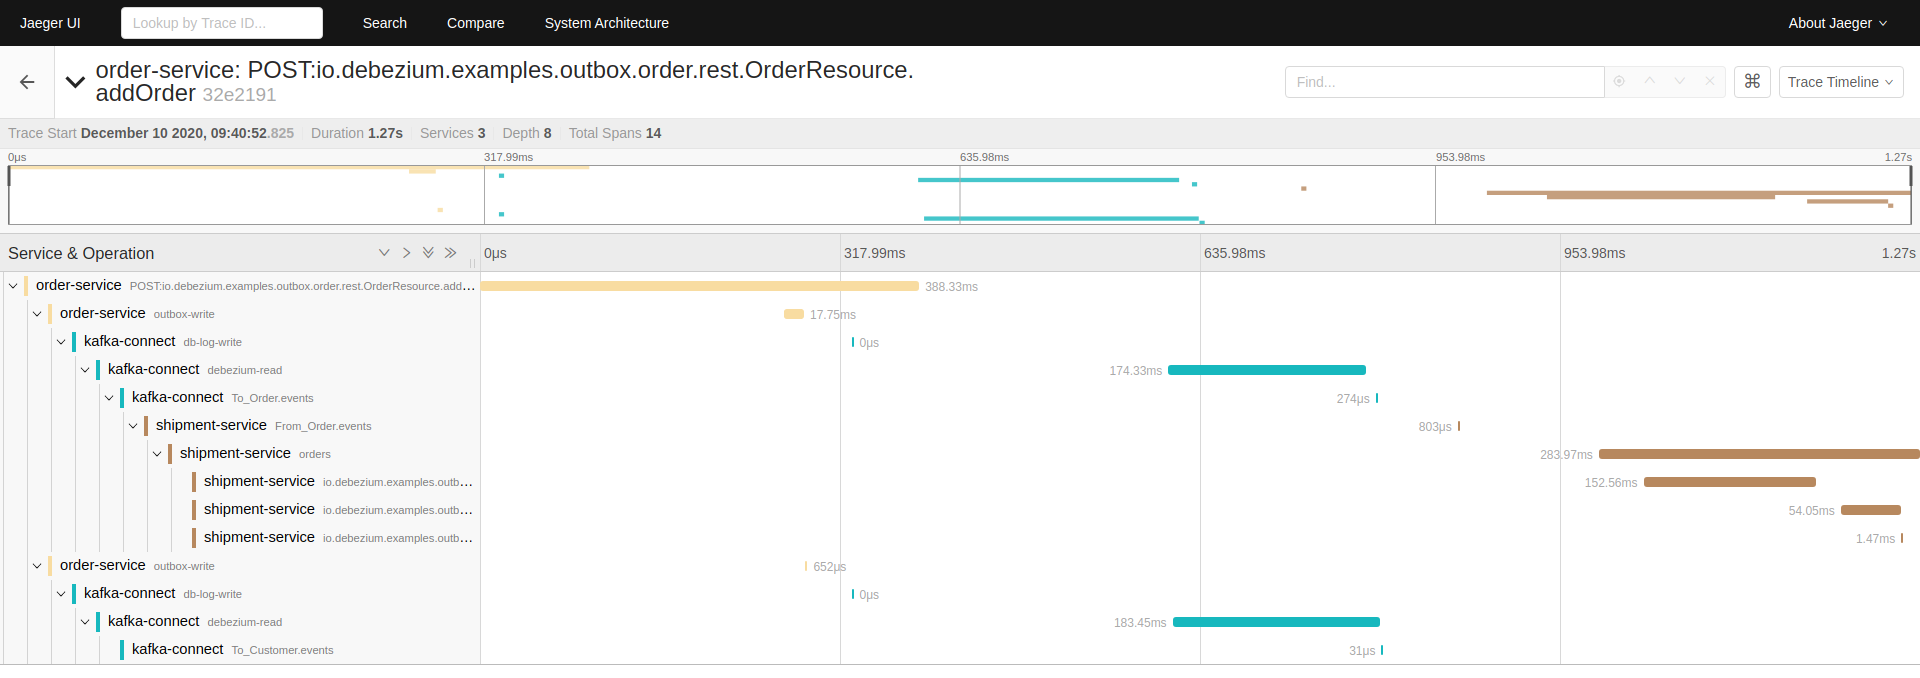
select * from inventory.shipment;The example enables support for tracing via the OpenTracing specification.
One of the components deployed is the Jaeger server that collects and presents tracing information.
Go to the local Jaeger UI and when you select a trace for the order-service service, you should see a trace diagram similar to the one below:
Start all components:
$ docker-compose up --build --scale order-service=0$ mvn compile quarkus:dev \
"-Dquarkus.datasource.jdbc.url=jdbc:postgresql://localhost:5433/orderdb?currentSchema=inventory" \
"-Dquarkus.debezium-outbox.remove-after-insert=false"
