- Introduction
- Quickstart
- Start the containers
- Check the status of MongoDB Sink Kafka Connector
- Start Grafana-Mongo Proxy
- Start data ingestion
- Start Spark ReadStream Session
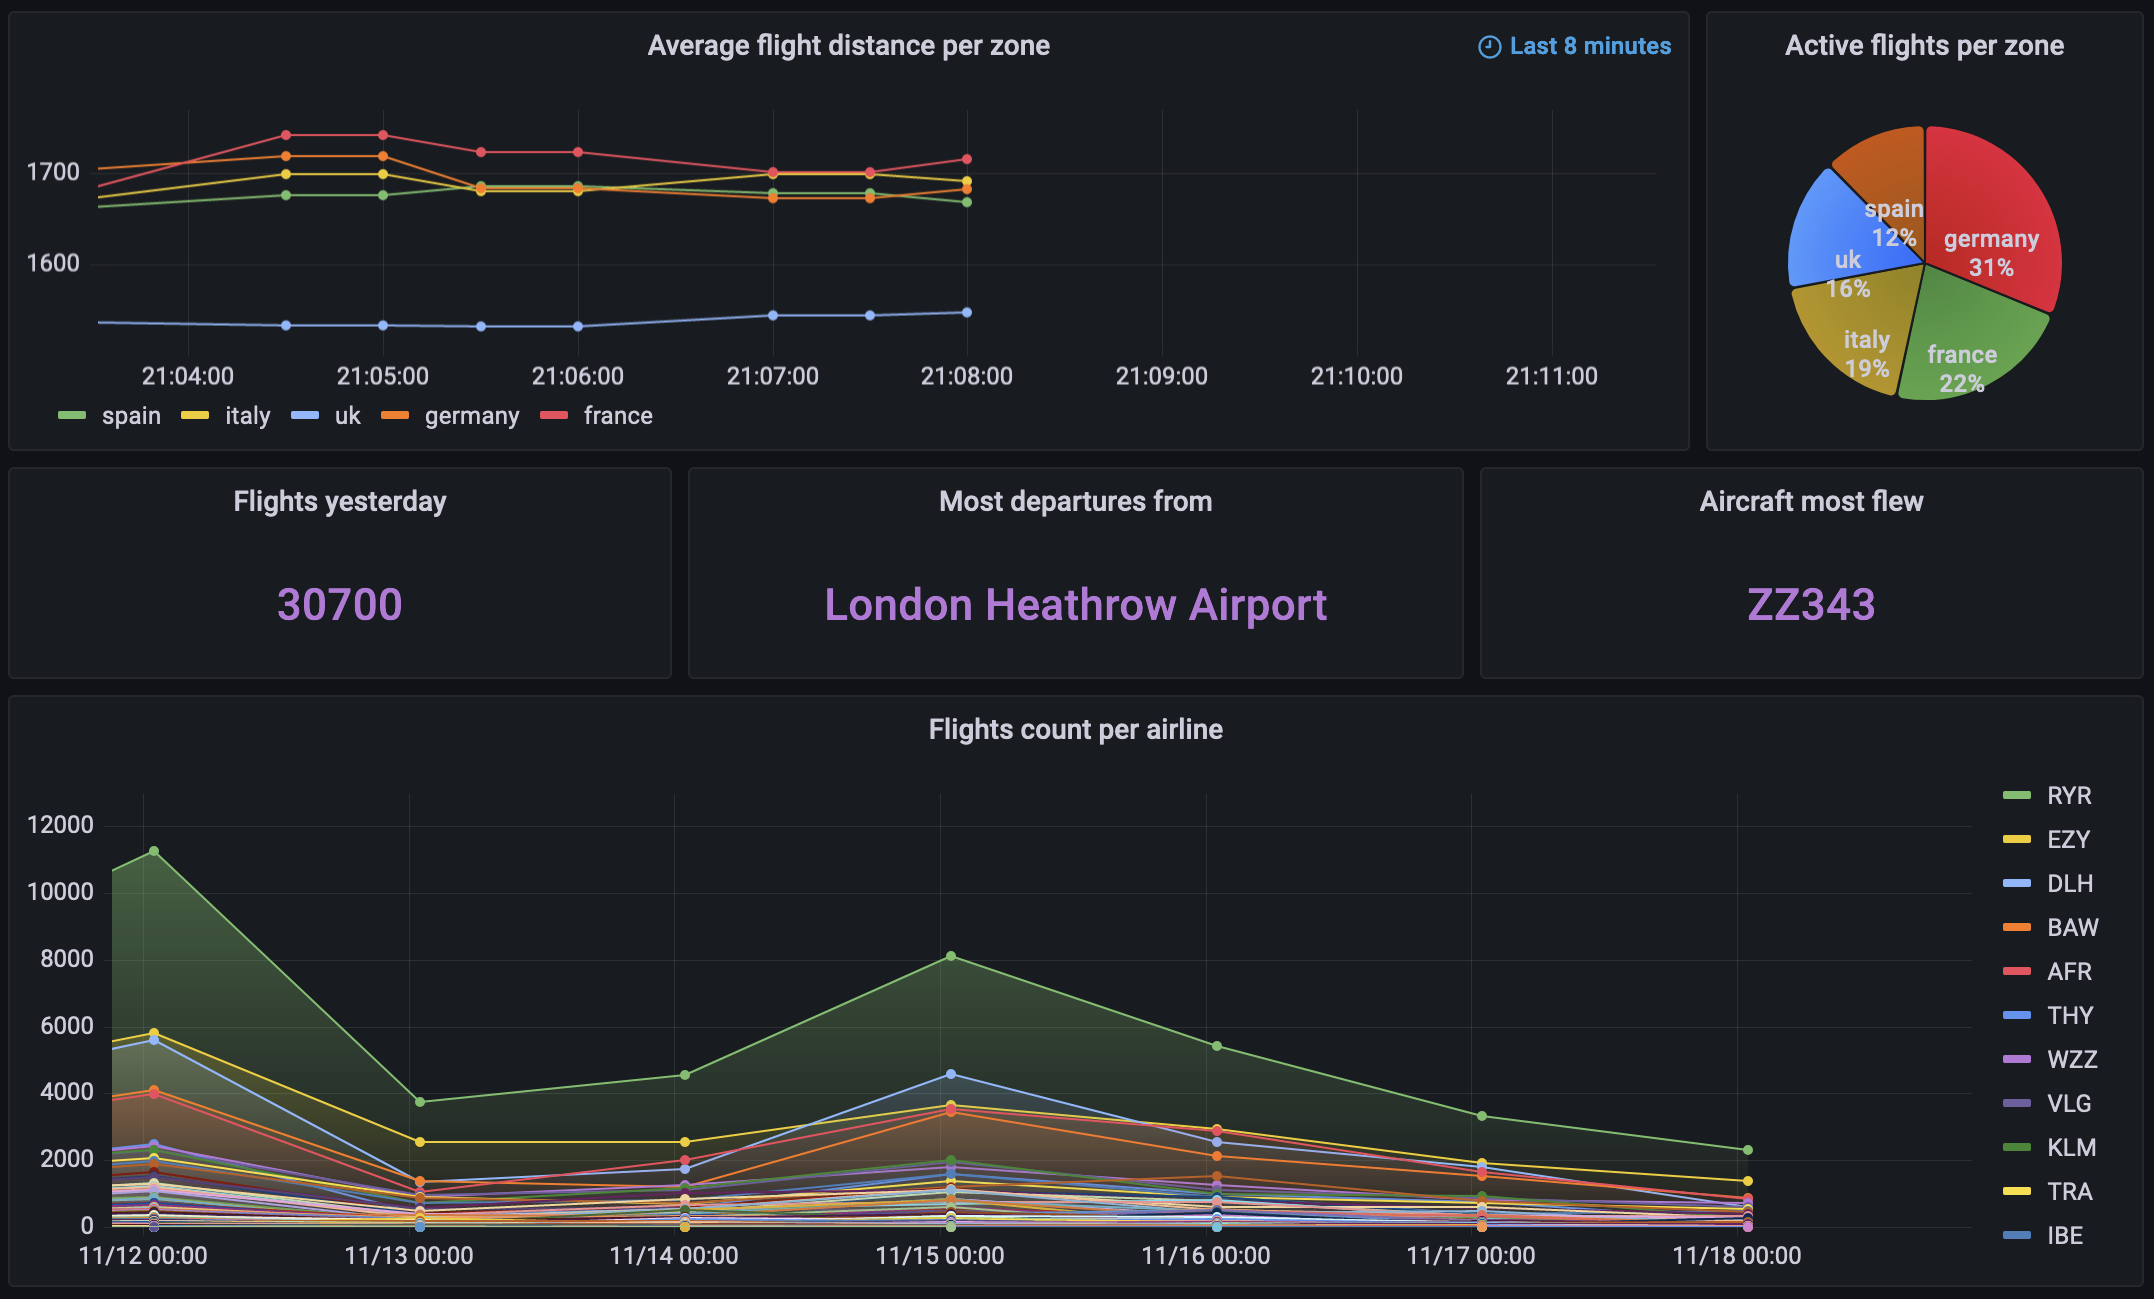
- Access dashboard in Grafana
- Stop the streaming
- Shutdown the containers
- Monitoring
- Kafka Cluster
- Kafka-Mongo Connector
- Spark Jobs
- MongoDB
- Components
- Troubleshooting
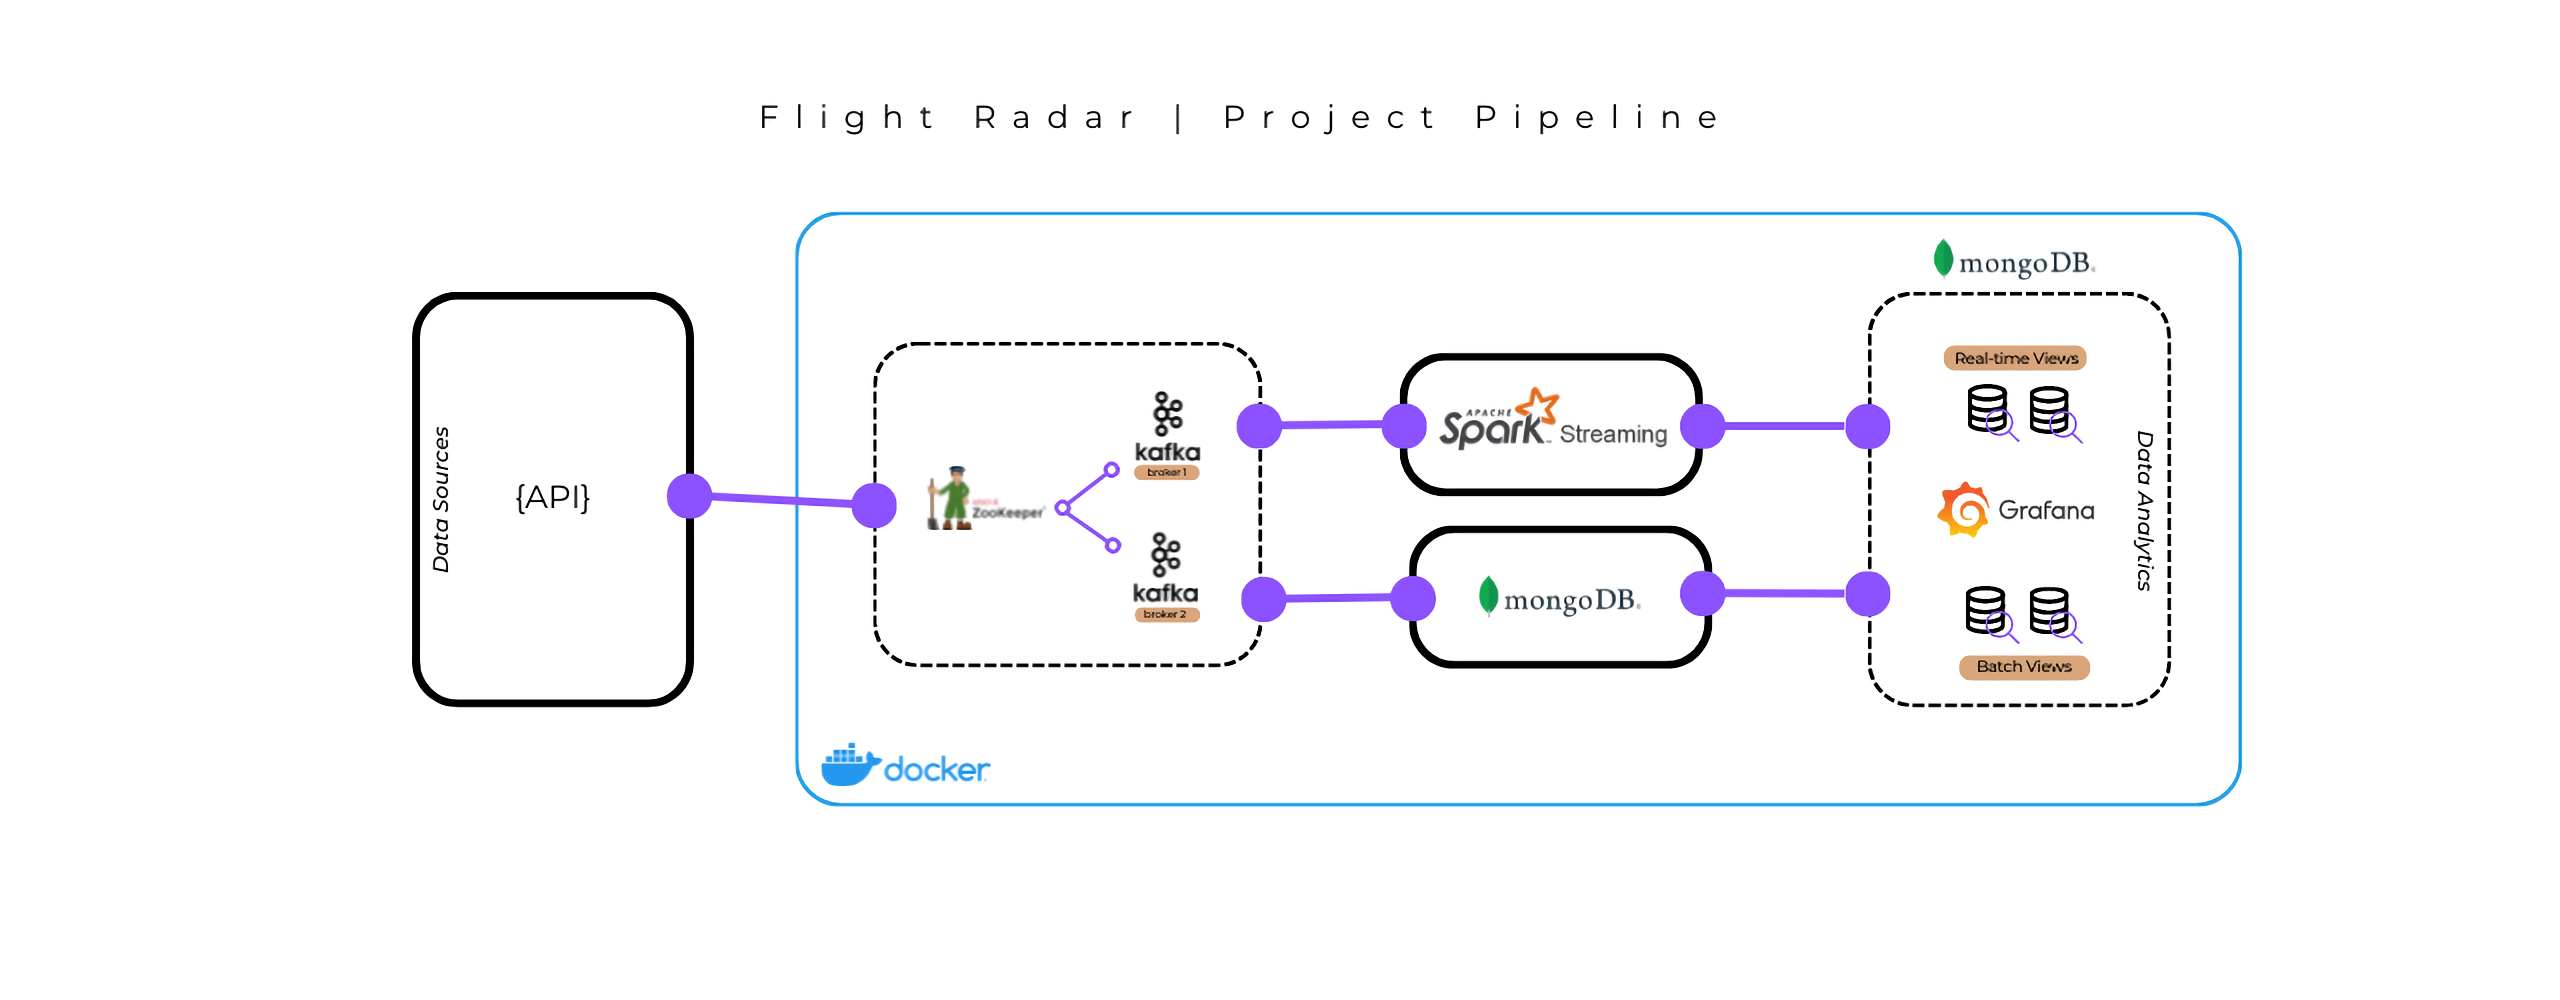
The following project has been developed with the goal of implementing current leading technologies in both batch and real-time data management and analysis.
The data source is FlightRadar24, a website that offers real-time flight tracking services. Through an API it is possible to obtain information, in real time, regarding flights around the globe. The developed dashboard allows the user to obtain general information about past days flights, in addition to real-time analytics regarding live air traffic in each zone of interest.
The real-time characteristic of the chosen data source motivates the need to set up an architecture that can cope with the large number of data arriving in a short period of time. The architecture developed make possible the ability to store data and at the same time analyze it in real time. The pipeline consists of several stages, which use current technologies for Real-Time Data Processing.
All of this was developed in a Docker environment to enable future testing and a total replication of the project.
Note: Due to file size limits imposed by Github, collections regarding flights and real-time data has been uploaded empty.
Warning: It's recommended having at least 5GB Docker memory allocated. If not, change it in the settings.
Prepare yourself three active terminals placed in the project folder.
In the first one:
- Start the containers
> docker compose up -dWait about 30 seconds and run the following command:
- Check status of MongoDB Sink Kafka Connector
> curl localhost:8083/connectors/mongodb-connector/status | jqOUTPUT
{
"name": "mongodb-connector",
"connector": {
"state": "RUNNING",
"worker_id": "connect:8083"
},
"tasks": [
{
"id": 0,
"state": "RUNNING",
"worker_id": "connect:8083"
},
{
"id": 1,
"state": "RUNNING",
"worker_id": "connect:8083"
}
],
"type": "sink"
}Make sure you have installed jq, otherwise remove it from the command or install it.
If everything is running go ahead with the steps, otherwise wait about 10 more seconds and retry. If the error persists, see Troubleshooting section.
- Start Grafana-Mongo Proxy
> docker exec -d grafana npm run server- Start data ingestion
In the second terminal:
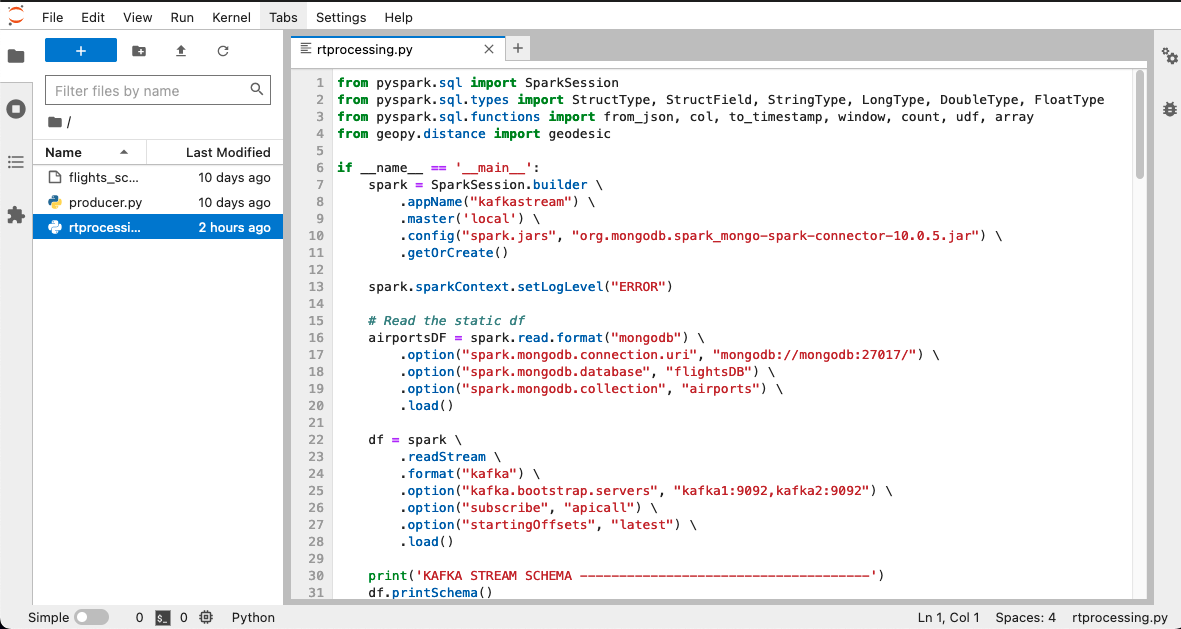
> docker exec -it jupyter python producer.py- Start Spark ReadStream Session
In the third terminal:
> docker exec -it jupyter spark-submit --packages org.apache.spark:spark-sql-kafka-0-10_2.12:3.3.1,org.mongodb.spark:mongo-spark-connector:10.0.5 rtprocessing.py-
Access the dashboard in Grafana at localhost:3000 | admin@password
-
Stop the streaming
Whenever you want to stop data generation and processing, simply hit ctrl+c in each active terminal.
- Shutdown the containers
To end the session type in the first terminal:
> docker-compose down- KAFKA CLUSTER
We need first to execute some commands to enable JMX Polling.
> docker exec -it zookeeper ./bin/zkCli.sh
$ create /kafka-manager/mutex ""
$ create /kafka-manager/mutex/locks ""
$ create /kafka-manager/mutex/leases ""
$ quit
After that we can access the Kafka Manager UI at localhost:9000. Click on Cluster and Add Cluster. Fill up the following fields:
- Cluster Name = <insert a name>
- Cluster Zookeeper Hosts = zookeeper:2181
Tick the following:
- ✅ Enable JMX Polling
- ✅ Poll consumer information
Leave the remaining fields by default.
Hit Save.
- KAFKA-MONGO CONNECTOR
To check the status of the connector and the status of related tasks, execute the following command.
> curl localhost:8083/connectors/mongodb-connector/status | jqIf everything is working properly you should see a bunch of Running.
Make sure you have installed jq, otherwise remove it from the command or install it.
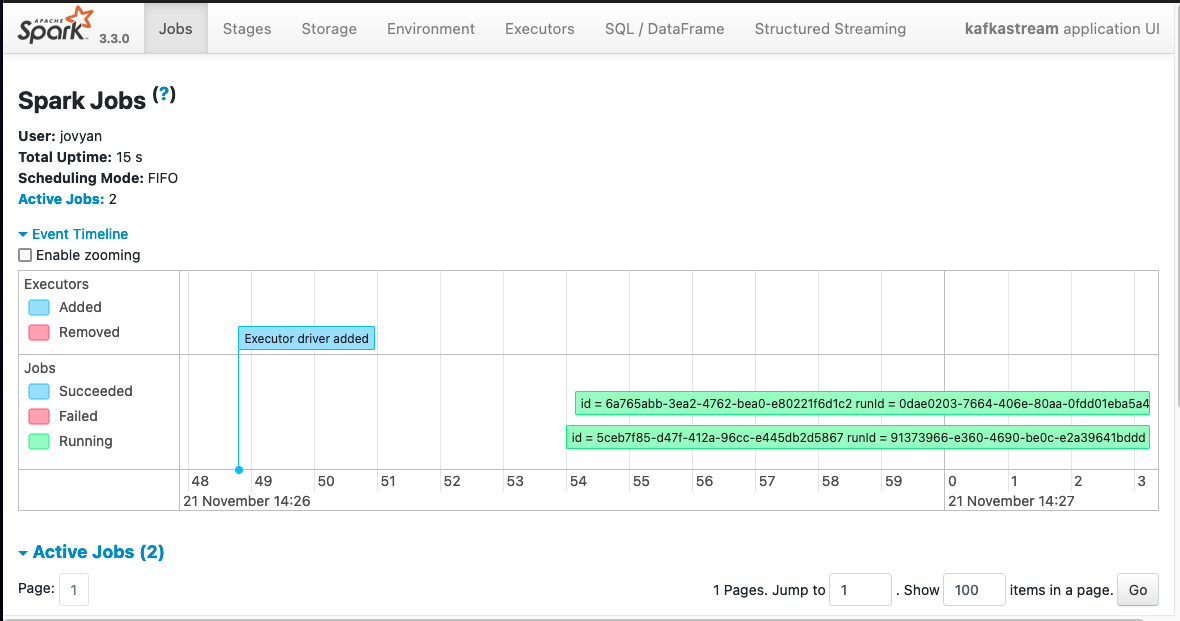
- SPARK JOBS
To view the activity of spark jobs, access at localhost:4040/jobs/.
- MONGODB
You can interact with the db and related collections in Mongo through two options:
1. MongoDB Compass UI
2. > docker exec -it mongodb mongo 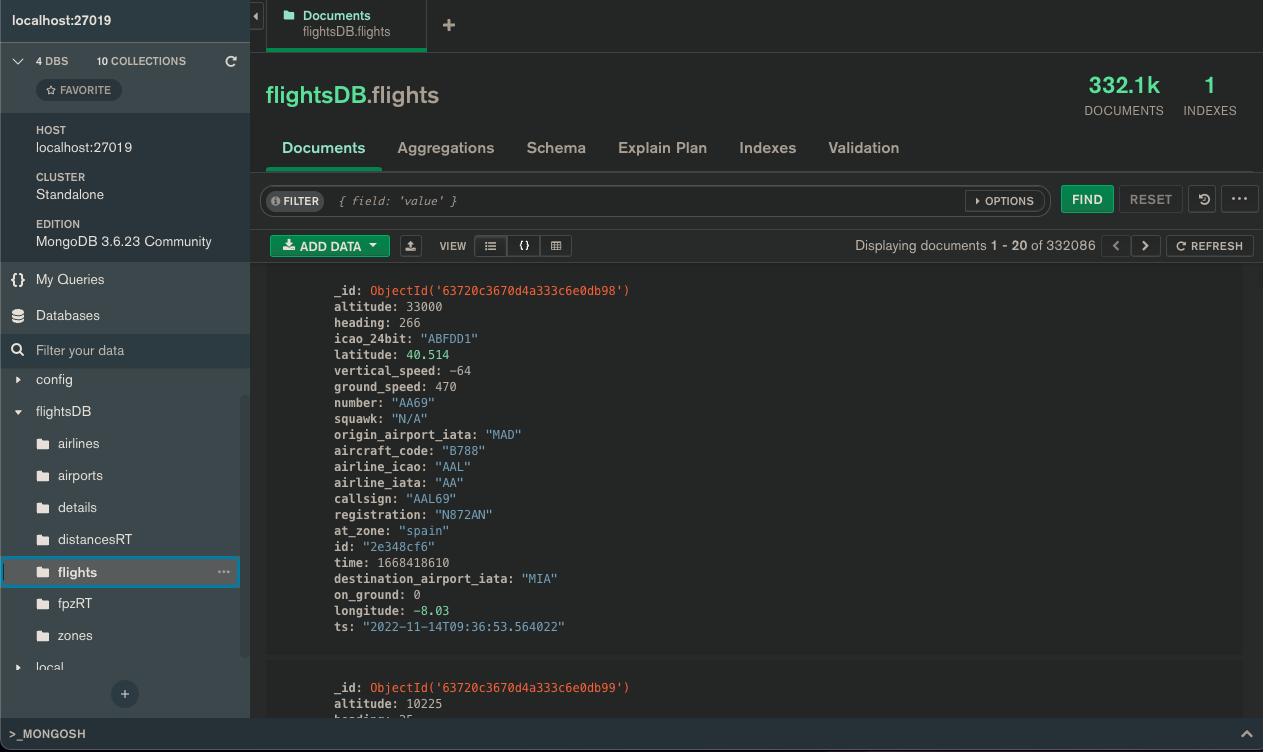 |
 |
 |
|
API
The project is based on data obtained from the JeanExtreme002/FlightRadarAPI, an unofficial API for FlightRadar24 written in Python.
CONTAINERS
| Container | Image | Tag | Internal Access | Access from host at | Credentials |
|---|---|---|---|---|---|
| Zookeeper | wurstmeister/zookeeper | latest | zookeeper:2181 | ||
| Kafka1 | wurstmeister/kafka | kafka1:9092 | |||
| Kafka2 | wurstmeister/kafka | kafka2:9092 | |||
| Kafka Manager | hlebalbau/kafka-manager | stable | localhost:9000 | ||
| Kafka Connect | confluentinc/cp-kafka-connect-base | ||||
| Jupyter | custom [Dockerfile] | localhost:8889 | token=easy | ||
| MongoDB | mongo | 3.6 | mongodb:27017 | localhost:27019 | |
| Grafana | custom [Dockerfile] | localhost:3000 | admin@password |
KAFKA CONNECT
To enable Kafka messages sink in Mongo has been included the official MongoDB Kafka connector, providing both Sink and Source connectors, in the folder specified in the plugin_path.
GRAFANA
To enable MongoDB as a data source for Grafana, it has been necessary to create a custom image based on the official one, grafana/grafana-oss, that would integrate the connector. The connector used is the unofficial one from JamesOsgood/mongodb-grafana.
The datasource and the dashboard are provisioned as well.
MongoDB Sink Kafka Connector
If when curling the state of the connector one of the following error persist:
curl: (52) Empty reply from server{
"error_code": 404,
"message": "No status found for connector mongodb-connector"
}then, in the first case, you can try to:
> docker restart kafka_connectWait about 30 seconds and retry curling.
In the second case:
> curl -X POST -H "Content-Type: application/json" --data @./connect/properties/mongo_connector_configs.json http://localhost:8083/connectorsand retry curling.


