PerfJ is a wrapper of linux perf for java programs.
In order to profile java programs, you need a profiler that can sample stack traces. There has historically been two types of profilers:
System profilers:like Linux perf, which shows system code paths (eg, JVM GC, syscalls, TCP), but not Java methods.JVM profilers:like hprof, LJP, and commercial profilers. These show Java methods, but usually not system code paths.
Ideally, we need a profile result that does it all: system and Java code paths. Apart from convenience, it also shows system code-paths in Java context, which can be crucial for understanding a profile properly.
The problem is getting a system profiler to understand Java methods and stack traces. If you try Linux perf_events, for example, you'll see hexadecimal numbers and broken stack traces, as it can't convert addresses into Java symbols, and can't walk the JVM stack.
There are two specific problems:
- The JVM compiles methods on the fly (just-in-time: JIT), and doesn't expose a traditional symbol table for system profilers to read.
- The JVM also uses the frame pointer register (RBP on x86-64) as a general purpose register, breaking traditional stack walking.
Thanks to Brendan Gregg's patch. We will have an option to turn on the preservation of frame pointer on JDK 8u60+.
This project is based on Johannes Rudolph's work at here. I just make it more convenient to use.
PerfJ can produce flame graph through Brendan Gregg's FlameGraph tool as well.
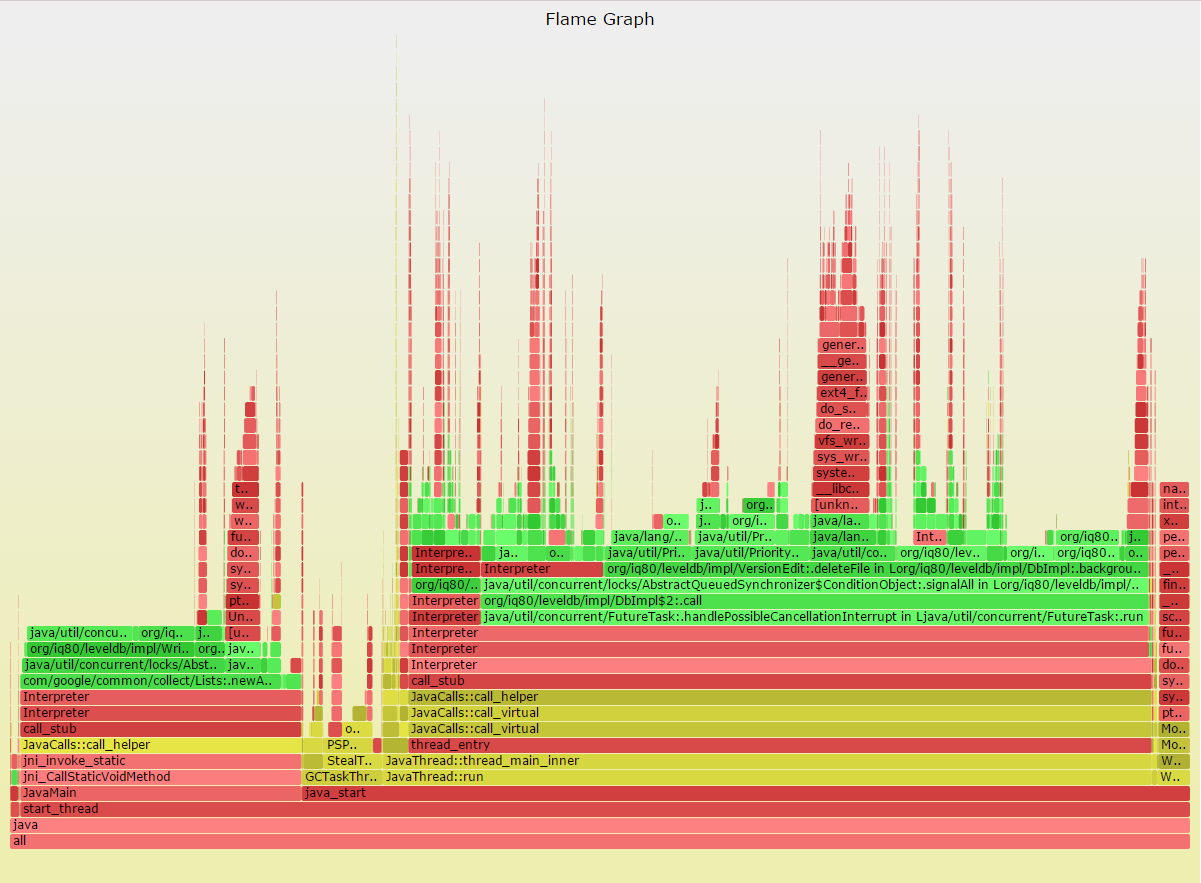
Below is an example shows the hotspot of a pure java leveldb program. Green is Java layer, yellow is JVM layer, and red is system layer(native user-level, or kernel). Longer bar means higher cpu percentage.
There is a raw interactive SVG image [here] (http://blog.minzhou.info/perfj/perfj.svg).
- Linux x86_64
- perf
- JDK 8u60+ / JDK9 ( haven't been released yet, however, there is an Early Access Release)
Before starting building PerfJ, make sure gcc is already installed.
checkout the source from github
git clone https://github.com/coderplay/perfj.git
and run below in the future building
cd perfj
./gradlew releaseTarGz
Before install PerfJ, you should install Linux perf first
To install perf on centos/redhat/fedora linux system
yum install perf.x86_64
To install perf on for ubuntu linux system
apt-get install linux-tools-common linux-tools-generic linux-tools-`uname -r`
then download perfj-*.tgz from the [release page] (https://github.com/coderplay/perfj/releases), untar it
tar zxvf perf-*.tgz
Check the [wiki pages] (https://github.com/coderplay/perfj/wiki)
This library is licensed under GPLv2. See the LICENSE file.
