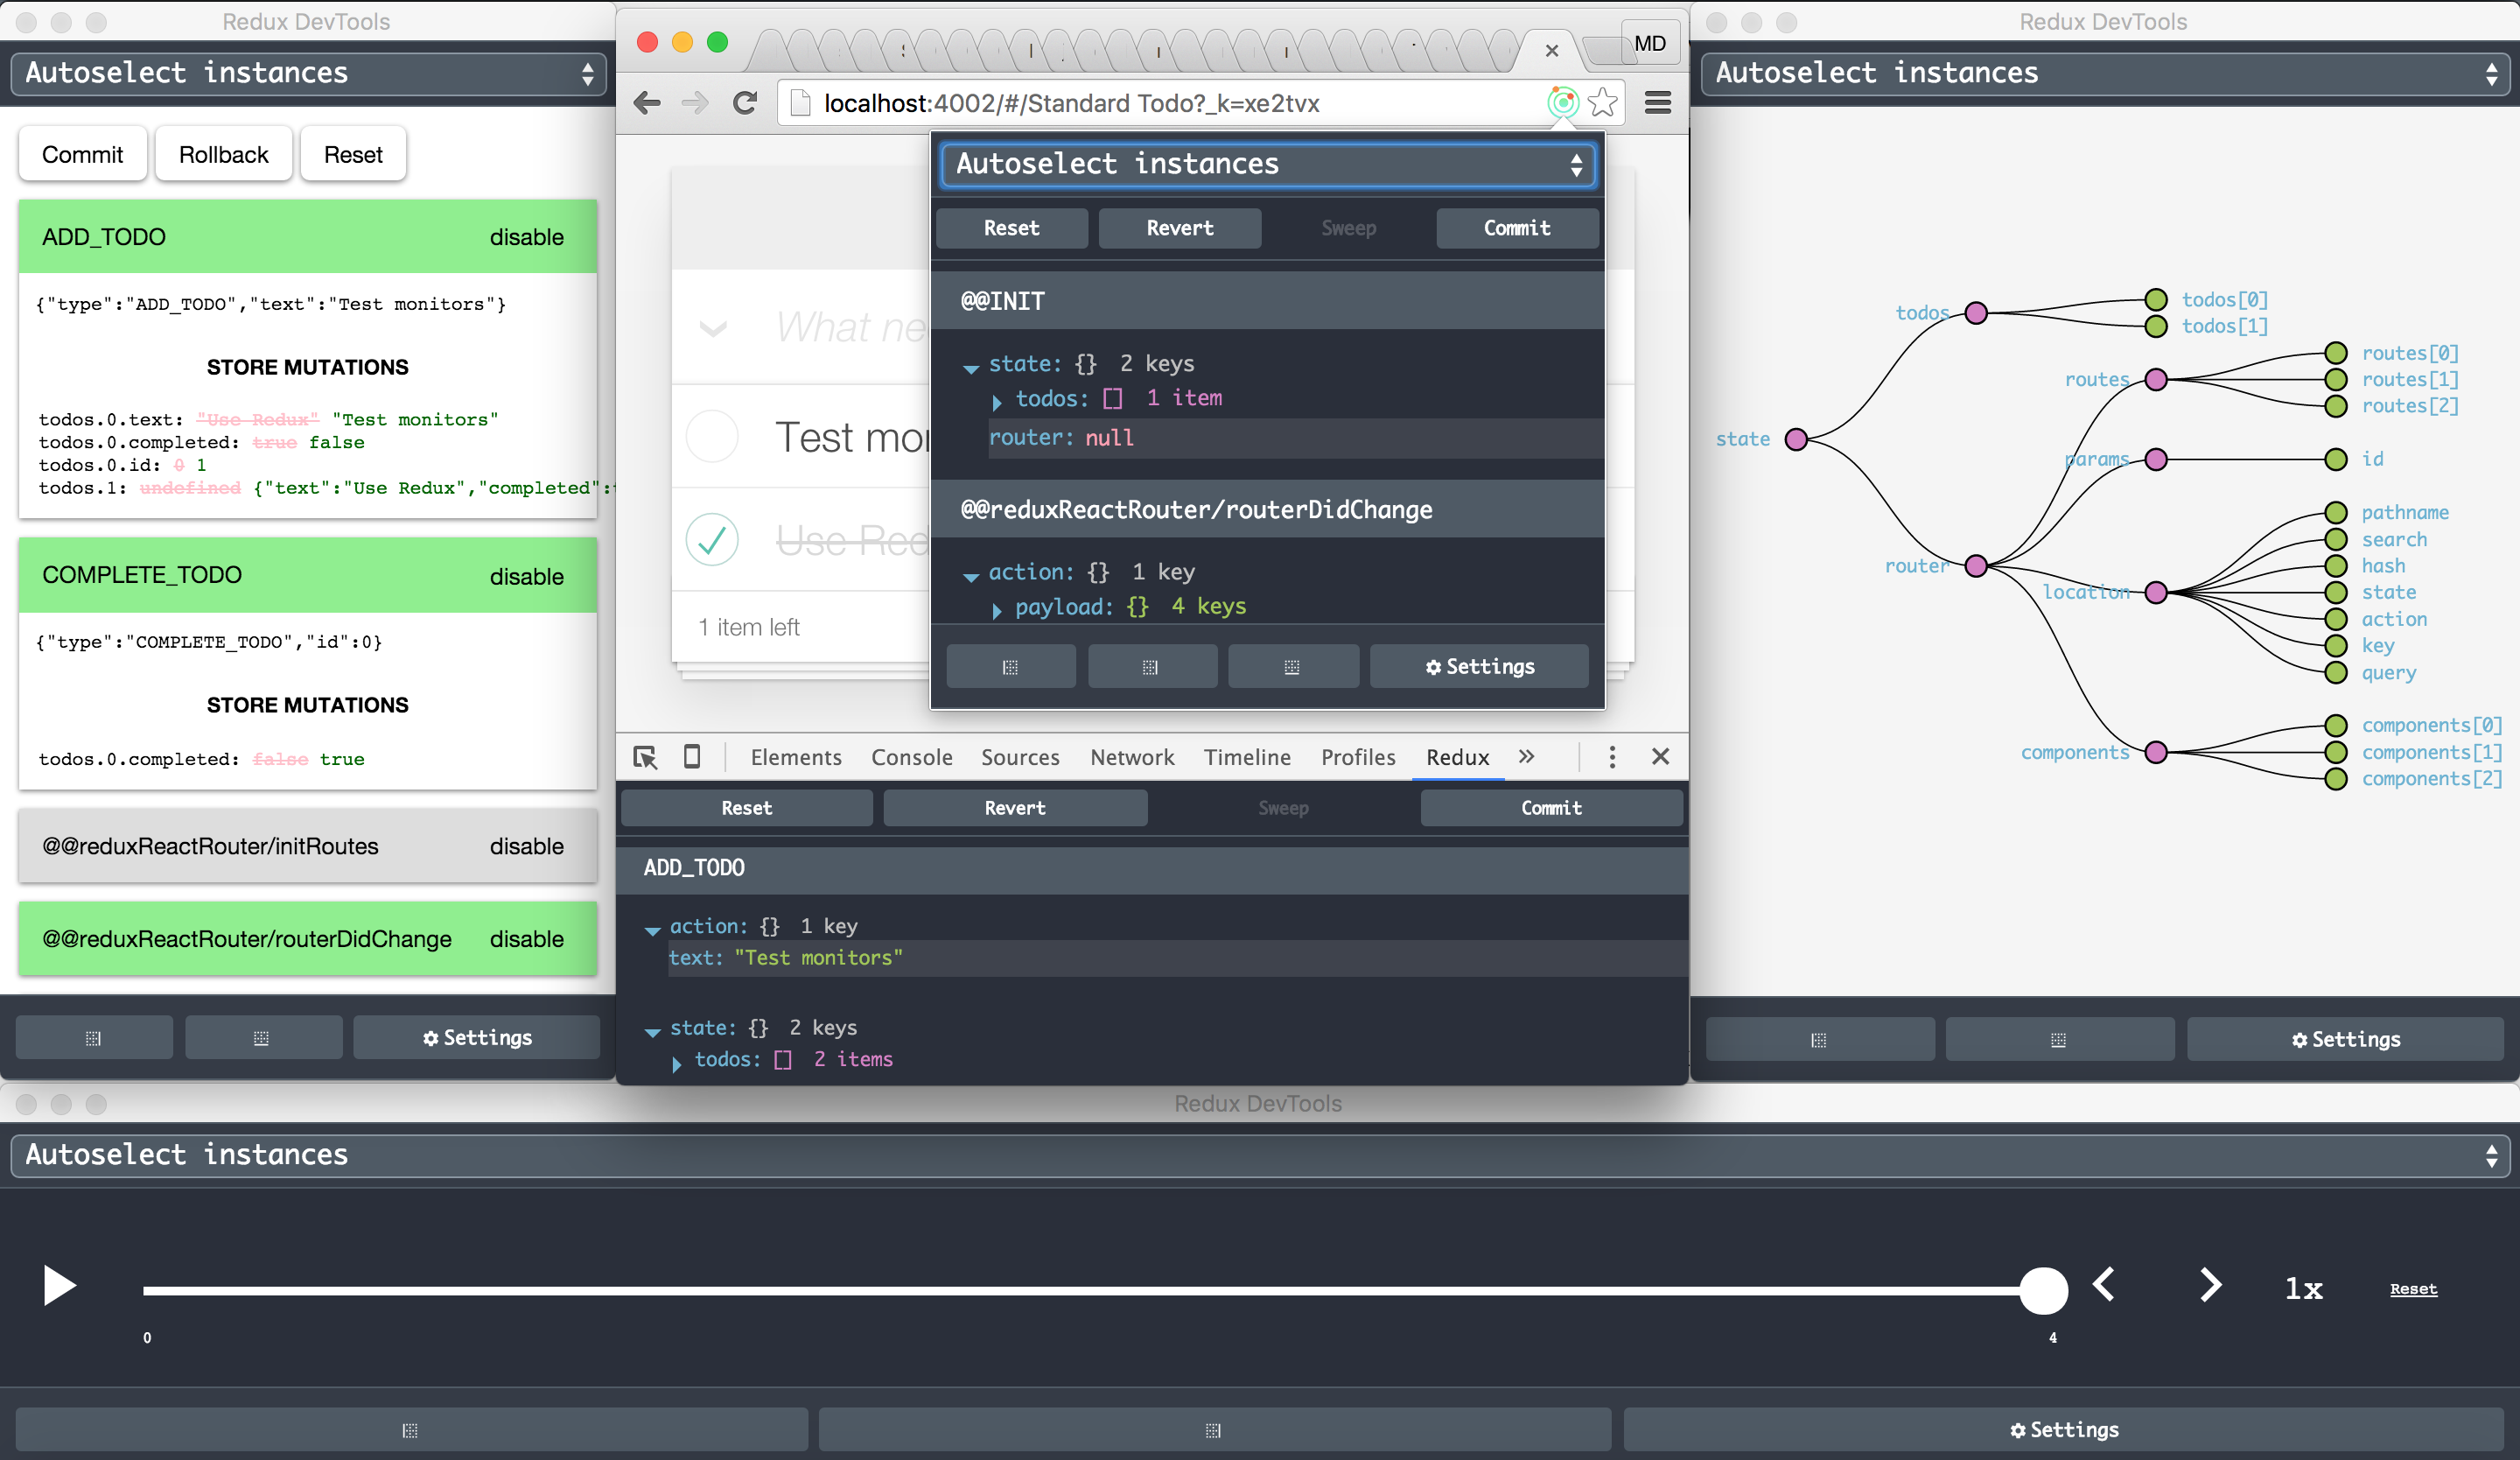
If you do not know what Redux DevTools is, see Dan's React Europe talk!
- Simple implementation (only 1 line of code without importing anything!).
- Having DevTools even in production without any drawbacks.
- Keeping the DevTools up to date (Chrome extension is updated automatically).
- Having Redux DevTools in a page without window (Chrome extensions’ background page).
- Using DevTools remotely for Chrome Mobile.
- from Chrome Web Store
- or build it with
npm i & npm run build:extensionand load the extension's folder./build/extension - or run it in dev mode with
npm i & npm startand load the extension's folder./dev.
-
Redux
Just update your configureStore:const finalCreateStore = compose( applyMiddleware(thunk), ... )(createStore);
becomes
const finalCreateStore = compose(
  applyMiddleware(thunk),
  ...
  window.devToolsExtension ? window.devToolsExtension() : f => f
)(createStore);
or for universal (isomorphic) apps
const finalCreateStore = compose(
  applyMiddleware(thunk),
  ...
  typeof window === 'object' && typeof window.devToolsExtension !== 'undefined' ? window.devToolsExtension() : f => f
)(createStore);
You can use it together with vanilla Redux DevTools as a fallback, but not both simultaneously:
window.devToolsExtension ? window.devToolsExtension() : DevTools.instrument()
-
With Redux@^3.1 it's even easier
export default function configureStore(initialState) {
  const store = createStore(reducer, initialState, compose(
    applyMiddleware(thunk),
    window.devToolsExtension ? window.devToolsExtension() : f => f
  ));
  return store;
}
or if you don't have other store enhancers and middlewares:
export default function configureStore(initialState) {
  const store = createStore(reducer, initialState,
    window.devToolsExtension ? window.devToolsExtension() : undefined
  );
  return store;
}
-
Freezer
Just use supportChromeExtension fromfreezer-redux-devtools/freezer-redux-middleware.
window.devToolsExtension([config])
- config arguments (optional)
- name (string) - the instance name to be showed on the monitor page. Default value is
document.title.
- name (string) - the instance name to be showed on the monitor page. Default value is
Open these urls to test the extension:
- Counter
- TodoMVC
- Redux Form
- Redux Router
- Implemented with FreezerJS
- Implemented in a Chrome app and extension
Also you may run them from ./examples folder (on port 4001 and 4002 by default).
- Test the extension with Counter or TodoMVC demo.
- Reload the extension on the extensions page (
chrome://extensions/). - If something goes wrong, open an issue or tweet me: @mdiordiev.
On the options page you may enable actions filtering and specify either actions to be hidden or shown in DevTools. If the latter is specified, other than those actions will be hidden.
On the options page you may enable the extension to be injected in all pages or you may specify the pages urls to be injected in. Use regex values and new line as a separator.
Right click on the page and open it from the context menu.
Just add ?debug_session=<session_name> to the url.
Unlike web apps, Chrome extension doesn't inject anything in other chrome extensions or apps, so you have to do it by yourself to allow debugging. Just add:
<script src="chrome-extension://lmhkpmbekcpmknklioeibfkpmmfibljd/js/inject.bundle.js"></script>
To include it in a chrome extension's content script follow the example.
window.devToolsExtension.open();To enable chrome panels feature in Chrome, type in chrome://flags/#enable-panels in the url bar and click on "enable" under "enable panels". Make sure to click on "relaunch now " at the bottom of the page, to take effect.
You may open DevTools in a new window (by opening context menu with right mouse click), from popup (clicking on the browser action button) or from Chrome dev panel. If you still, for some reason, want to include it directly in your page, load the following url in iframe: chrome-extension://lmhkpmbekcpmknklioeibfkpmmfibljd/window.html. You'd probably include it in a docker or in a resizeable component.
Just find Redux DevTools on the extensions page (chrome://extensions/) and click the Options link to customize everything. The errors notifying is enabled by default, but it works only when the store enhancer is called (in order not to show notifications for any sites you visit). In case you want notifications for a non-redux app, init it explicitly by calling window.devToolsExtension.notifyErrors() (probably you'll check if window.devToolsExtension exists before calling it).
Of course, it is not possible to inject extension's script there and to communicate directly. To solve this we use Remote Redux DevTools. Just find Remote button or press Alt+Shift+arrow up for remote monitoring.
Use Cmd+Ctrl+Arrows for OSX and Alt+Shift+Arrows for Windows, Linux and ChromeOS. Arrow down, left and right indicate the position of the DevTools window. Use arrow up to open Remote monitoring to communicate with Remote Redux DevTools. To change the shortcuts, click "Keyboard shortcuts" button on the bottom of the extensions page (chrome://extensions/).
- Built with our browser-redux boilerplate.
- Includes Dan Abramov's redux-devtools.
- Inspired from Taylor Hakes' work.
- The logo icon made by Keith Yong .
- Examples from Redux.
- Chrome extension.
- Firefox extension.
- Safari extension (simplified).
