Prediction and visualization of RNA modification stoichiometry in direct RNA sequencing datasets from per-read information
- General Description
- De novo prediction of RNA modified sites
- RNA modification stoichiometry estimation using Nanopolish resquiggling (not recommended)
- RNA modification stoichiometry estimation using Tombo resquiggling (recommended)
- Visualization of per-read current intensities at individual sites
- Citation
- Contact
- NanoRMS predicts modification stoichiometries by classifying reads into modified/unmodified, based on their per-read features (current intensity, dwell time and/or trace).
- NanoRMS can be run in single mode (1sample) or paired mode (2 samples).
- NanoRMS can run both unsupervised (e.g. KMEANS, Aggregative Clustering, GMM) and supervised machine learning algorithms (e.g. KNN, Random Forest). The later will require pairwise samples where one of the conditions is a knockout.
- NanoRMS can predict stoichiometry from Nanopolish resquiggled reads or from Tombo resquiggled reads. The latter is the recommended option.
Please note that we are using a modified version of EpiNano that was specifically developed for nanoRMS.
Firstly, we need to create a dictionary file from the reference fasta file
java -jar epinano_RMS/picard.jar CreateSequenceDictionary REFERENCE=reference.fasta OUTPUT= reference.fasta.dict
Requires python3
python3 epinano_RMS/epinano_rms.py -R <reference_file> -b <bam_file> -s epinano_RMS/sam2tsv
Example using test data:
python3 epinano_RMS/epinano_rms.py -R test_data/yeast_rRNA_ref -b test_data/wt_sorted.bam -s epinano_RMS/sam2tsv
Prediction of pseudouridine sites on mitochondrial ribosomal RNAs using three biological replicates:
Rscript predict_singleSample.R <epinanofile_rep1> <epinanofile_rep2> <epinanofile_rep3>
Example using test data:
Rscript predict_singleSample.R wt_epinano.csv sn3_epinano.csv sn36_epinano.csv
Single sample de novo RNA modification prediction has been tested for predicting pseudouridine RNA modifications in mitochondrial rRNAs, and the novel predicted sites were afterwards validated using CMC-based probing followed by sequencing), validating 2 out of the 2 sites that were predicted in all 3 biological replicates.
Using identified pseudouridine base-calling error signatures, nanoRMS can predict RNA modifications de novo in single samples, as long as if the stoichiometry of modification is sufficiently high (i.e. to be distinguished from background base-calling error of direct RNA sequencing).
Rscript predict_twoSample_transcript.R <epinanofile_rep1_normal> <epinanofile_rep1_heatshock> <epinanofile_rep2_normal> <epinanofile_rep2_heatshock>
Example using test data:
Rscript predict_twoSample_transcript.R ncRNA_normal_rep1_epinano.csv ncRNA_heatshock_rep1_epinano.csv ncRNA_normal_rep2_epinano.csv ncRNA_heatshock_rep2_epinano.csv
This version is deprecated. If you still wish to use it, you can find the details and code here
TO BE COMPLETED
Firstly, generate a collapsed Nanopolish event align output, by collapsing all the multiple observations for a given position from a same read.
python3 per_read_mean.py <event_align_file>
Example using test data:
python3 per_read_mean.py test_data/data1_eventalign_output.txt
Secondly, create 15-mer windows of per-read current intensities centered in positions of interest
The output of Nanopolish event align generated in the previous step is used as input in this script.
Rscript --vanilla nanopolish_window.R positions_file <input_table> <label>
Example using test data:
Rscript --vanilla nanopolish_window.R test_data/positions test_data/data1_eventalign_output.txt_processed_perpos_mean.csv data1
Rscript --vanilla density_nanopolish.R <window_file1> <window_file2> <window_file3(optional)> <window_file4(optional)>
Example using test data:
Rscript --vanilla nanopolish_density_plot.R test_data/sn34_window_file.tsv test_data/wt_window_file.tsv
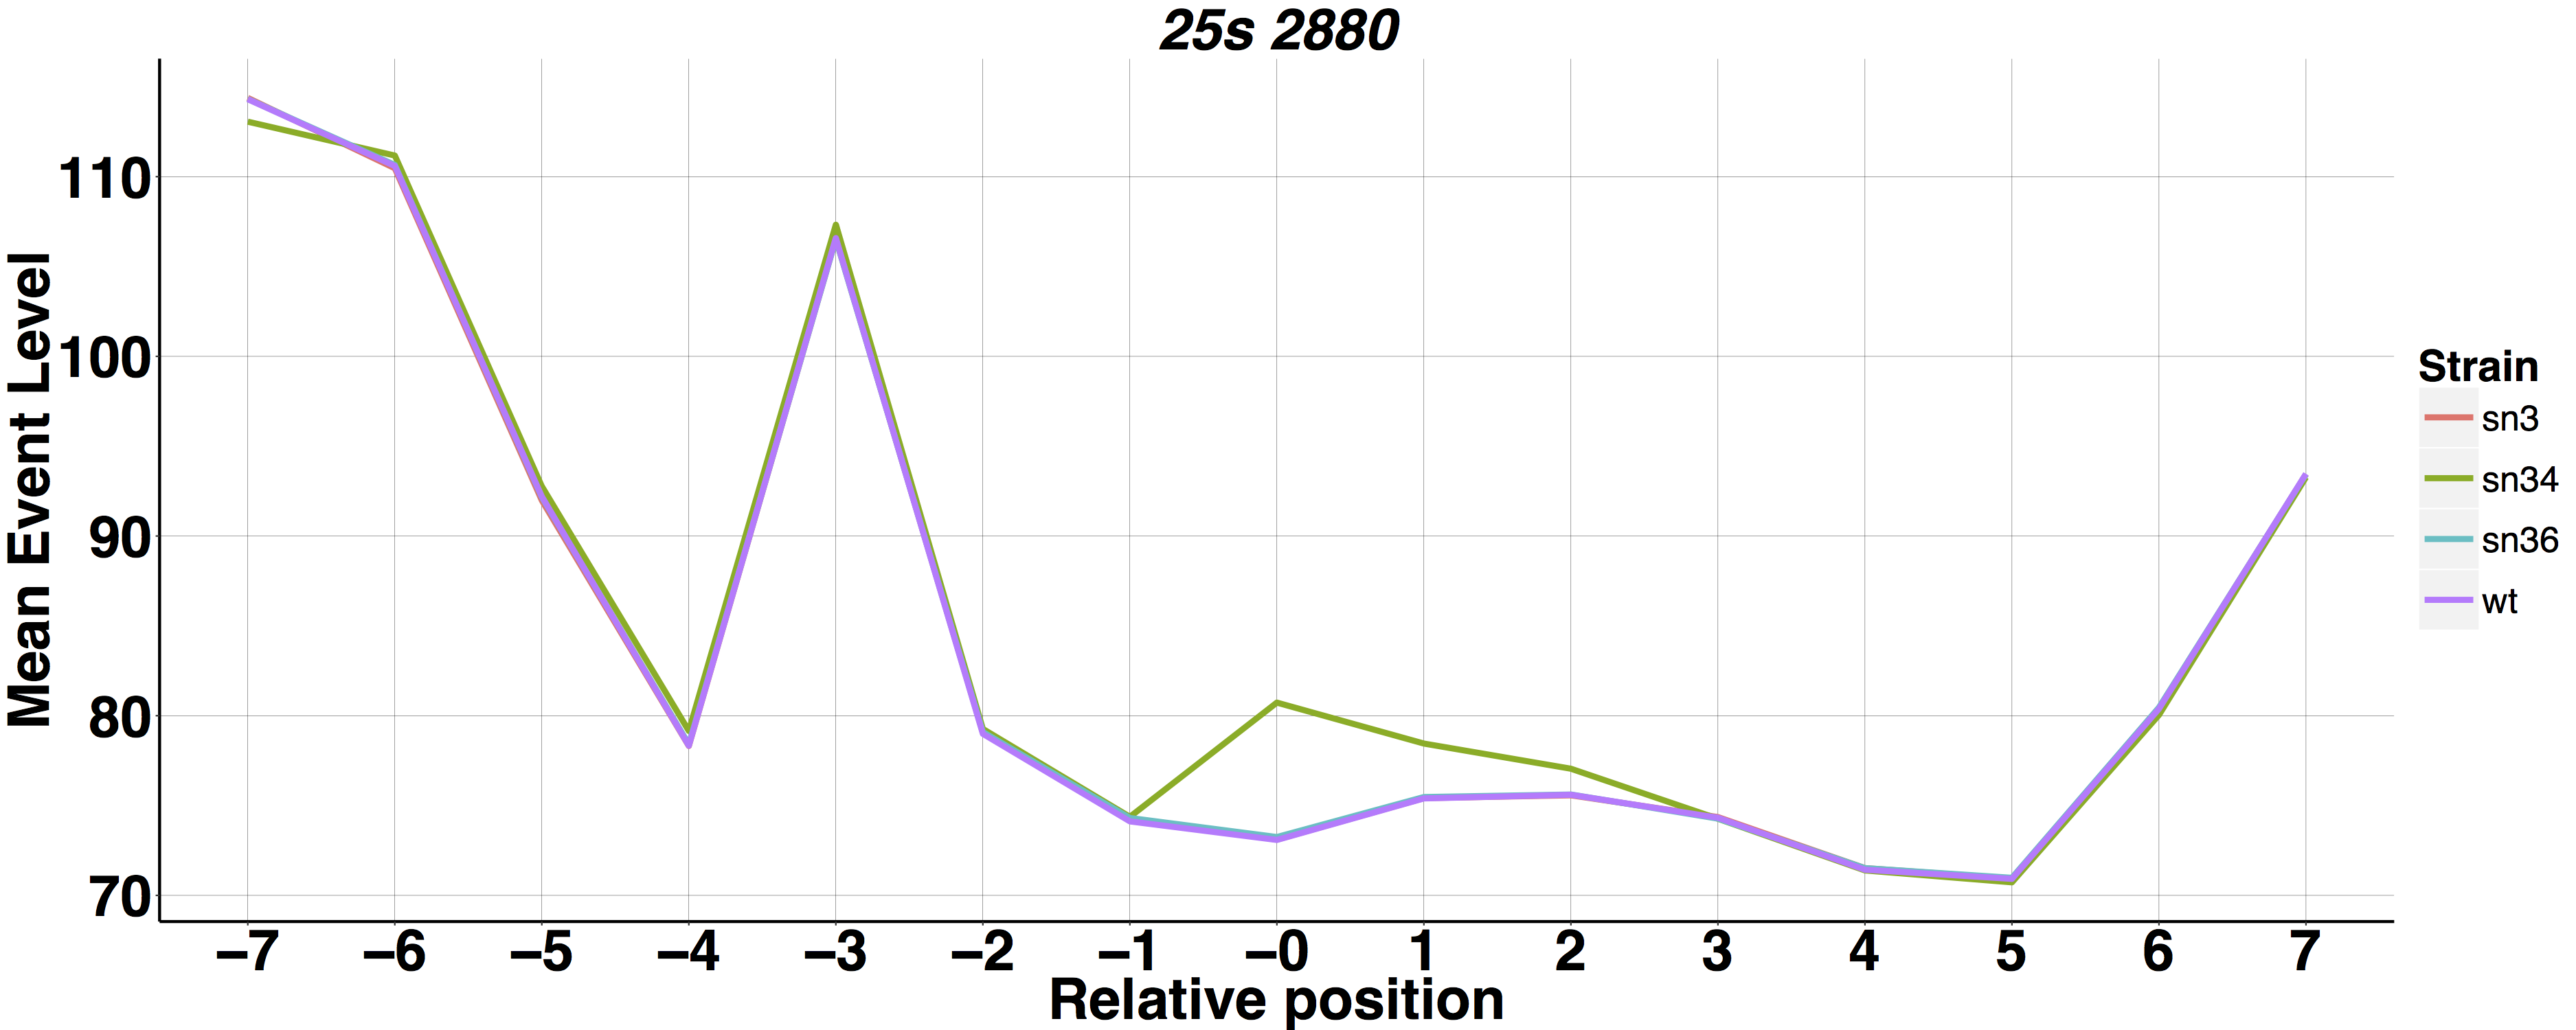
Rscript --vanilla nanopolish_meanlineplot.R <window_file1> <window_file2> <window_file3(optional)> <window_file4(optional)>
Example using test data:
Rscript --vanilla nanopolish_meanlineplot.R test_data/sn34_window_file.tsv test_data/wt_window_file.tsv
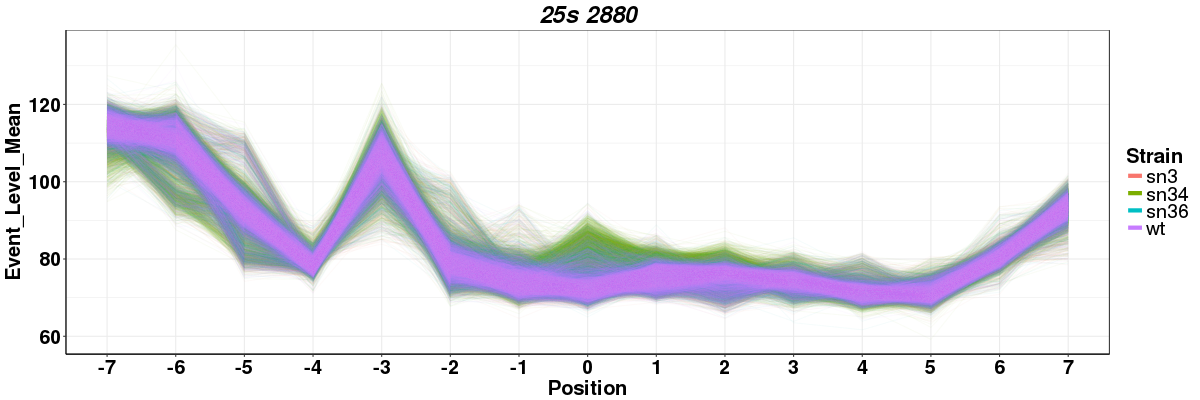
Rscript --vanilla nanopolish_perreadlineplot.R <window_file1> <window_file2> <window_file3(optional)> <window_file4(optional)>
Example using test data:
Rscript --vanilla nanopolish_perreadlineplot.R test_data/sn34_window_file.tsv test_data/wt_window_file.tsv
Rscript --vanilla nanopolish_pca.R <window_file1.tsv> <window_file2.tsv> <window_file3.tsv(optional)> <window_file4.tsv(optional)>
Example using test data:
Rscript --vanilla nanopolish_pca.R test_data/sn34_window_file.tsv test_data/wt_window_file.tsv
Begik O*, Lucas MC*, Ramirez JM, Milenkovic I, Cruciani S, Vieira HGS, Medina R, Liu H, Sas-Chen A, Mattick JS, Schwartz S and Novoa EM. Decoding ribosomal RNA modification dynamics at single molecule resolution. bioRxiv 2020. doi: https://doi.org/10.1101/2020.07.06.189969
Please open an issue in the GitHub repo if you have any questions/doubts/suggestions about how to use this software. Thanks!


