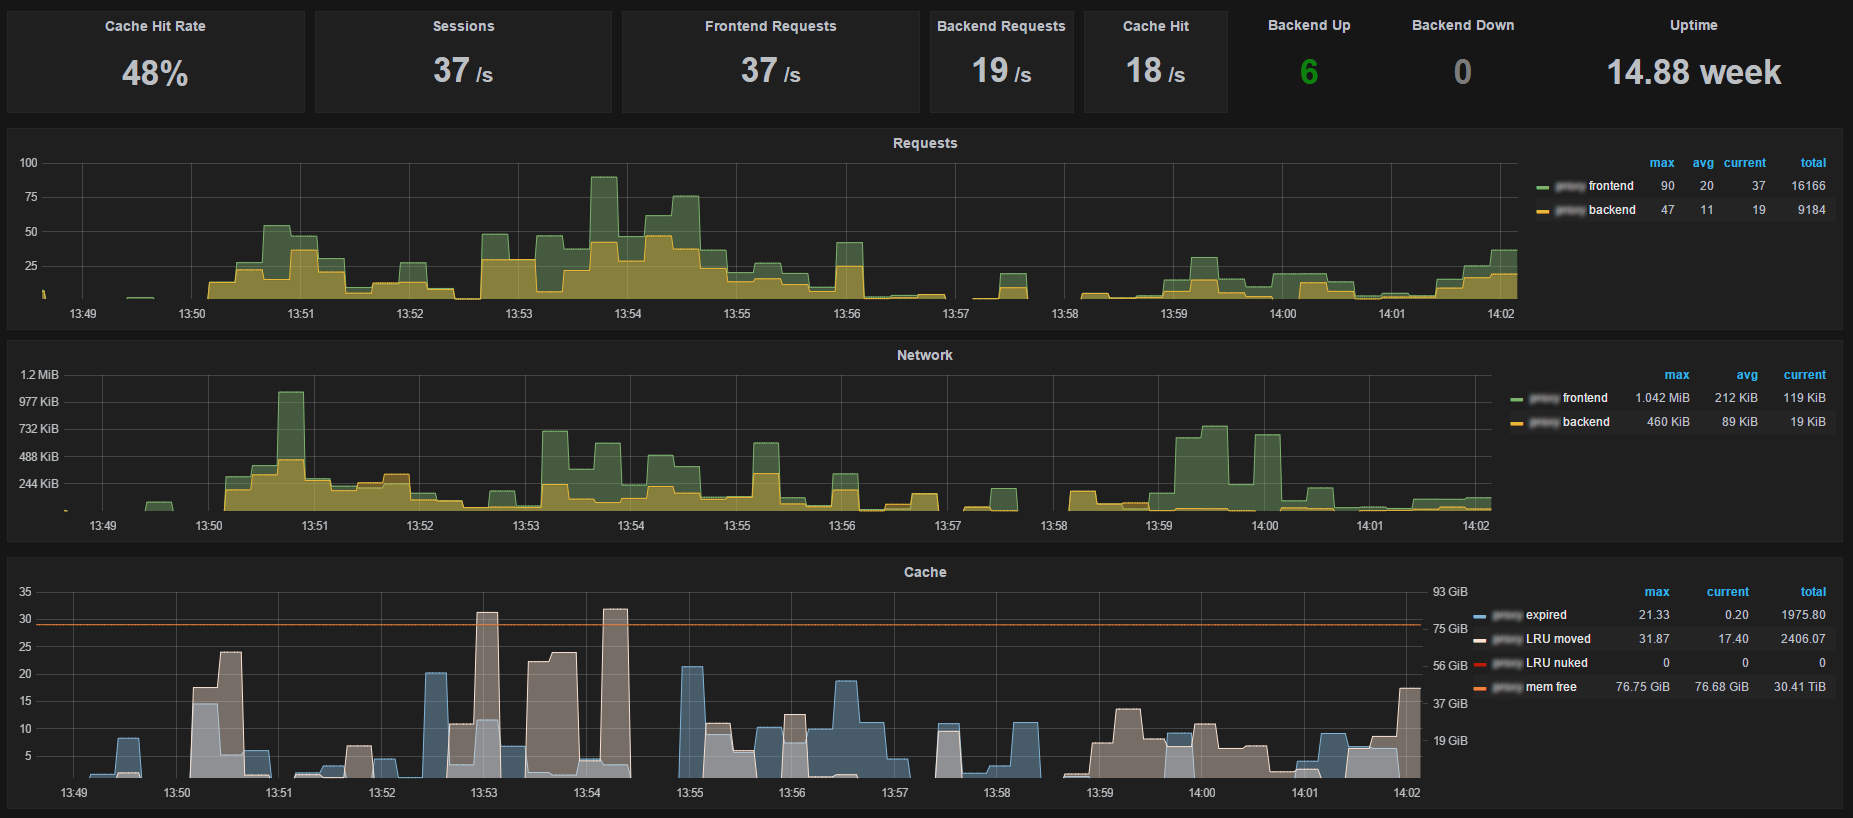
Scrapes the varnishstat -j JSON output on each Prometheus collect and exposes all reported metrics. Metrics with multiple backends or varnish defined identifiers (e.g. VBE.*.happy SMA.*.c_bytes LCK.*.creat) and other metrics with similar structure (e.g. MAIN.fetch_*) are combined under a single metric name with distinguishable labels. Vanish naming conventions are preserved as much as possible to be familiar to Varnish users when building queries, while at the same time trying to following Prometheus conventions like lower casing and using _ separators.
Handles runtime Varnish changes like adding new backends via vlc reload. Removed backends are reported by varnishstat until Varnish is restarted.
Advanced users can use -n -N, they are passed to varnishstat.
Tested to work against Varnish 4.1.0, 4.0.3 and 3.0.5. Missing category groupings in 3.x like MAIN. are detected and added automatically for label names to be consistent across versions, assuming of course that the Varnish project does not remove/change the stats.
I won't make any backwards compatibility promises at this point. Your built queries can break on new versions if metric names or labels are refined. If you find bugs or have feature requests feel free to create issues or send PRs.
make
./varnish_exporter <flags>
make test
You can deploy this exporter using the lswith/varnish-exporter Docker image.
For example:
docker pull lswith/varnish-exporter

docker run -d -p 9131:9131 -v /var/lib/varnish:/var/lib/varnish lswith/varnish-exporter -N /var/lib/varnish/_.vsm