- Conditional breakpoints, function breakpoints, logpoints,
- Hardware data access breakpoints (watchpoints),
- Launch debuggee in integrated or external terminal,
- Disassembly view with instruction-level stepping,
- Loaded modules view,
- Python scripting,
- HTML rendering for advanced visualizations,
- Workspace-level defaults for launch configurations,
- Remote debugging,
- Reverse debugging (experimental, requires a compatible backend).
For full details please see User's Manual.
The primary focus of this project are the C++ and Rust languages, for which CodeLLDB includes built-in visualizers for
vectors, strings, maps, and other standard library types.
That said, it is usable with most other compiled languages whose compiler generates compatible debugging information,
such as Ada, Fortran, Kotlin Native, Nim, Objective-C, Pascal, Swift
and Zig.
- Linux with glibc 2.18+ for x86_64, aarch64 or armhf,
- MacOS X 10.10+ for x86_64 and 11.0+ for arm64,
- Windows 10 for x86_64.
CodeLLDB supports AArch64, ARM, AVR, MSP430, RISCV, X86 architectures and may be used to debug on embedded platforms via remote debugging.
- CodeLLDB User's Manual - how to use this extension.
- Debugging in VS Code - if you are new to VSCode debugging.
- LLDB Tutorial - all of LLDB's CLI commands and scripting features may be used in CodeLLDB.
- Wiki pages - troubleshooting and other tips and tricks.
- Discussions - for questions and discussions.
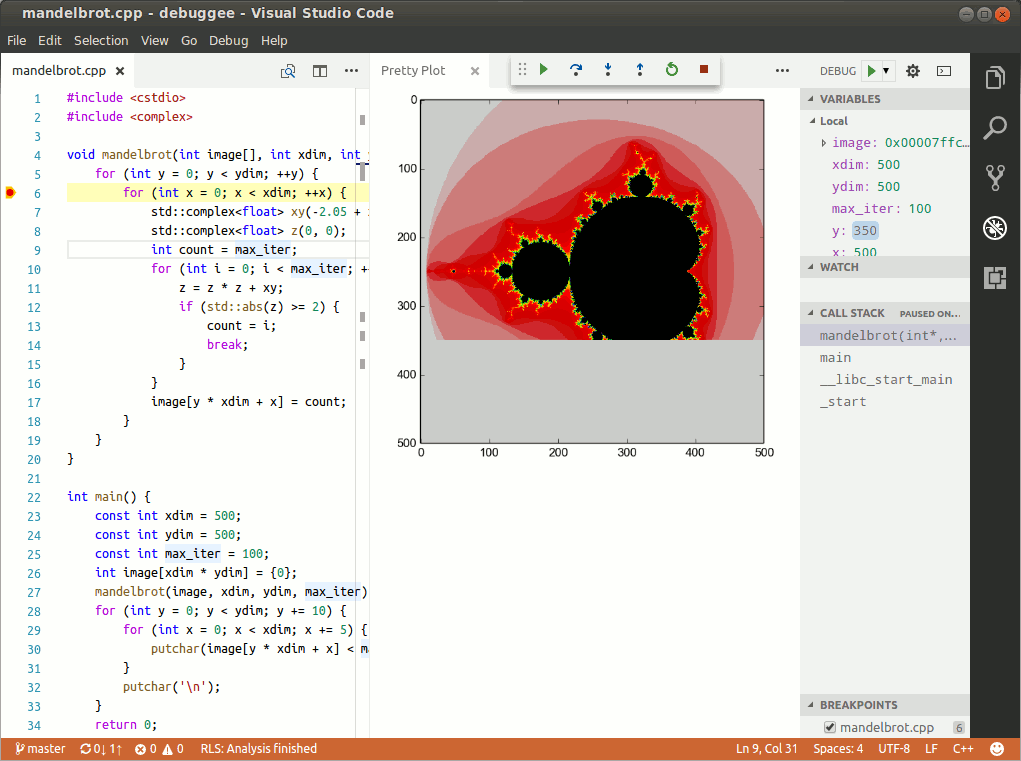
C++ debugging with data visualization (Howto):

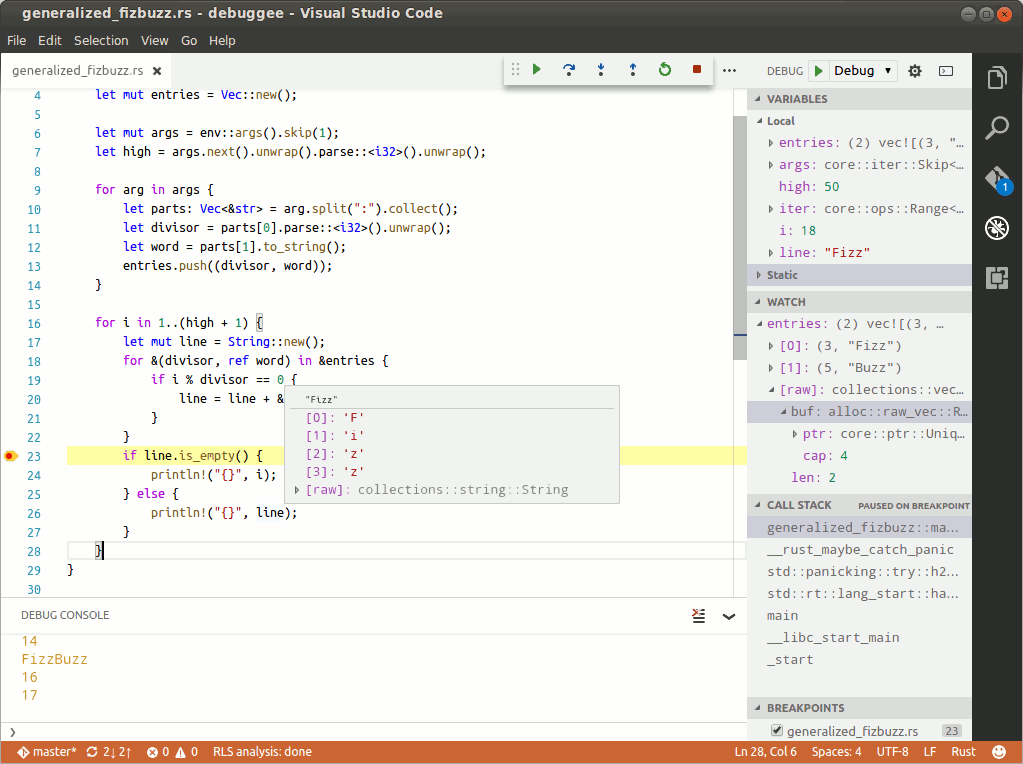
Rust debugging:
