drawRDF是一款开源的绘图软件,旨在从gromacs (https://www.gromacs.org/) 的gmx rdf命令获得的xvg文件直接绘制径向分布函数图像与配位数图像。目前drawRDF的最新版本为drawRDF_1.1
目录下drawRDF_1.1.py为drawRDF_1.1软件的python源代码,drawRDF_1.1.exe为其的可执行文件。双击drawRDF_1.1.exe就可以运行该软件。运行该软件后,首先会看到以下的内容:
Draw radial distribution function or coordination number curve from xvg file produced by gromacs
Version 1.1, release date: 2024-Jul-29
Programmed by Jian Zhang (jian_zhang@cug.edu.cn)

Please input the path of xvg file and enter 'q' to perform the next step.
随后,逐个拉进需要绘图的xvg文件,按q回车即可结束文件载入,如下图所示。
Draw radial distribution function or coordination number curve from xvg file produced by gromacs
Version 1.1, release date: 2024-Jul-29
Programmed by Jian Zhang (jian_zhang@cug.edu.cn)

Please input the path of xvg file and enter 'q' to perform the next step.
C:\Users\89732\Desktop\office-automation\ts\rdf-CL-1.4.xvg
Please input the path of xvg file and enter 'q' to perform the next step.
C:\Users\89732\Desktop\office-automation\ts\rdf_cn.xvg
Please input the path of xvg file and enter 'q' to perform the next step.
C:\Users\89732\Desktop\office-automation\ts\rdf-CL-0.xvg
Please input the path of xvg file and enter 'q' to perform the next step.
q
随后,出现下面的菜单选项:
The number of Radial distribution curve: 2
The number of Cumulative Number RDF curve: 1
0  Whether to turn on the legend: False
1  The dpi of output picture: 300
2  The color of curve in output picture: #0C5DA5, #00B945, #FF9500
3  The path of style sheets: ./style/no-latex.mplstyle, ./style/my.mplstyle
4  The label of curves: CL \ CL \ name OW
5  The position of label: best
6  The range of x-axis: (0,1)
d  Start to draw picture
s  Save the picture
q  Exit program
最上面两行用于说明传入的xvg文件中数据为径向分布函数和配位数曲线文件的个数。
- 按
0: 选择是否开启每一条曲线的图例,默认不开启 - 按
1: 选择输出图片的分辨率,默认300 - 按
2: 设置每一条曲线颜色的十六进制码,默认的颜色有#0C5DA5,#00B945,#FF9500,#FF2C00,#845B97,#474747和#9e9e9e - 按
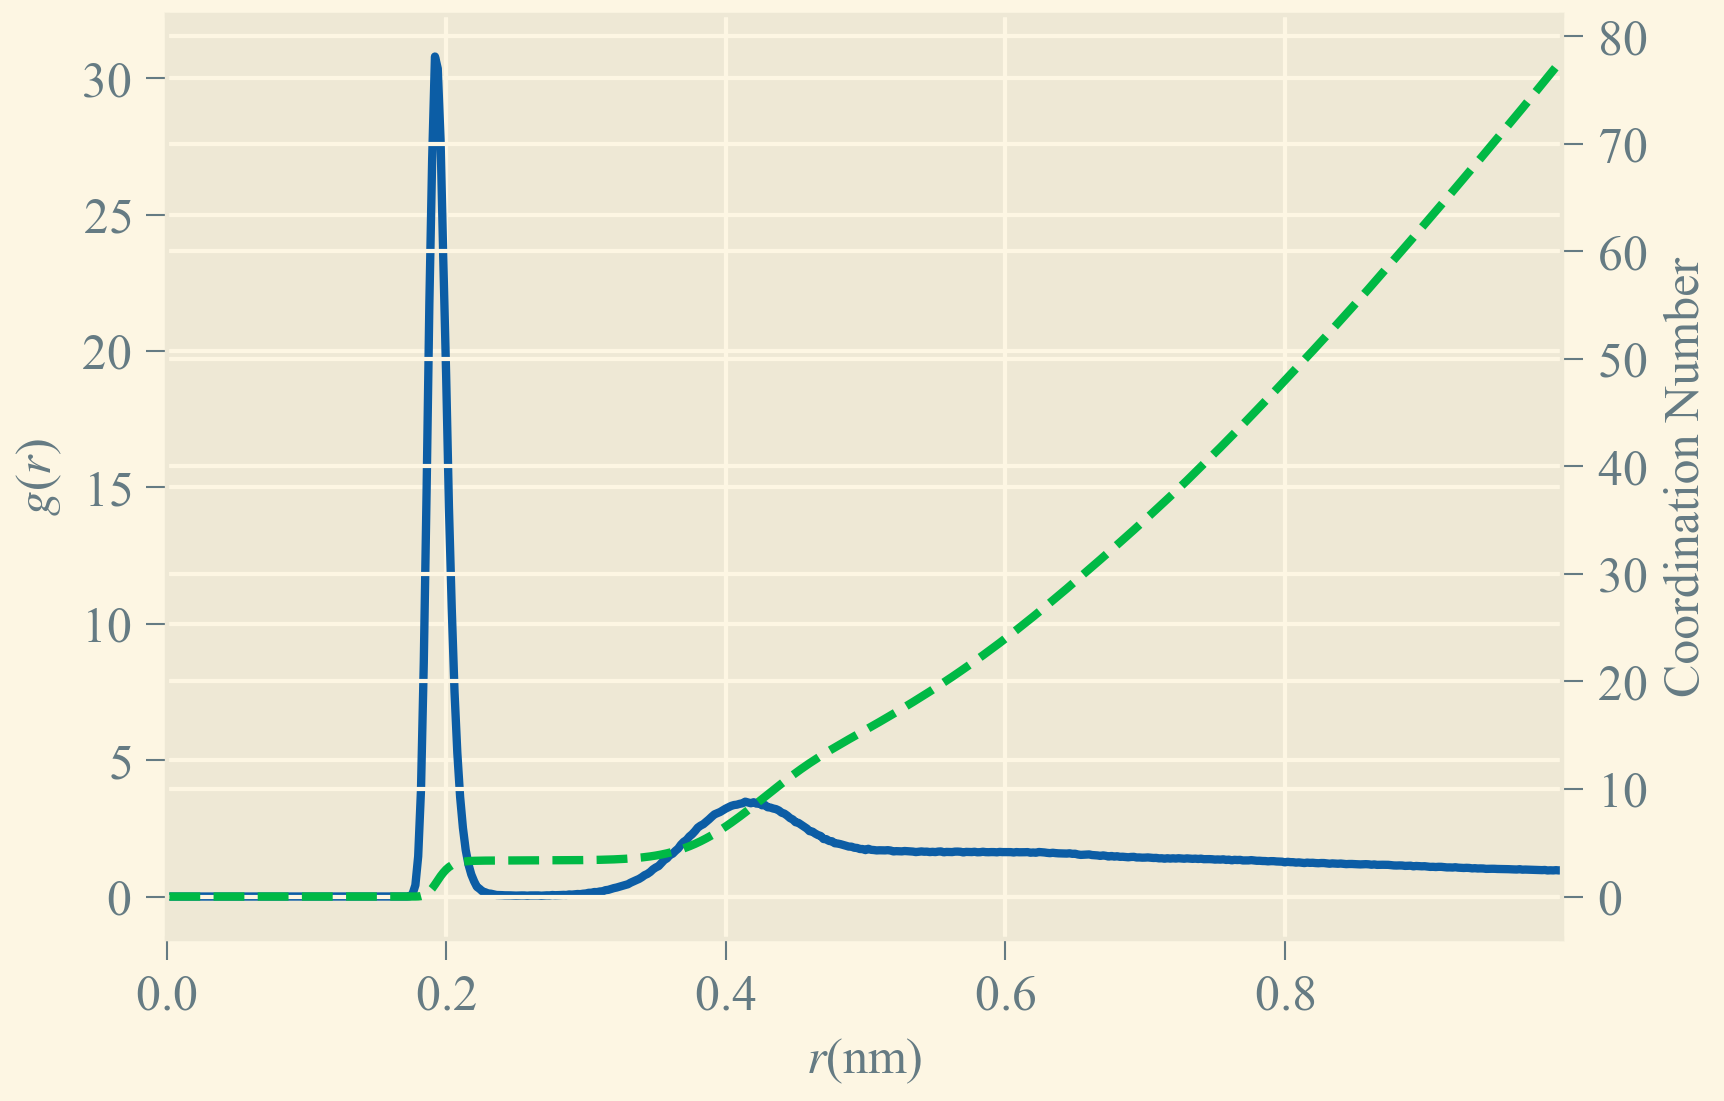
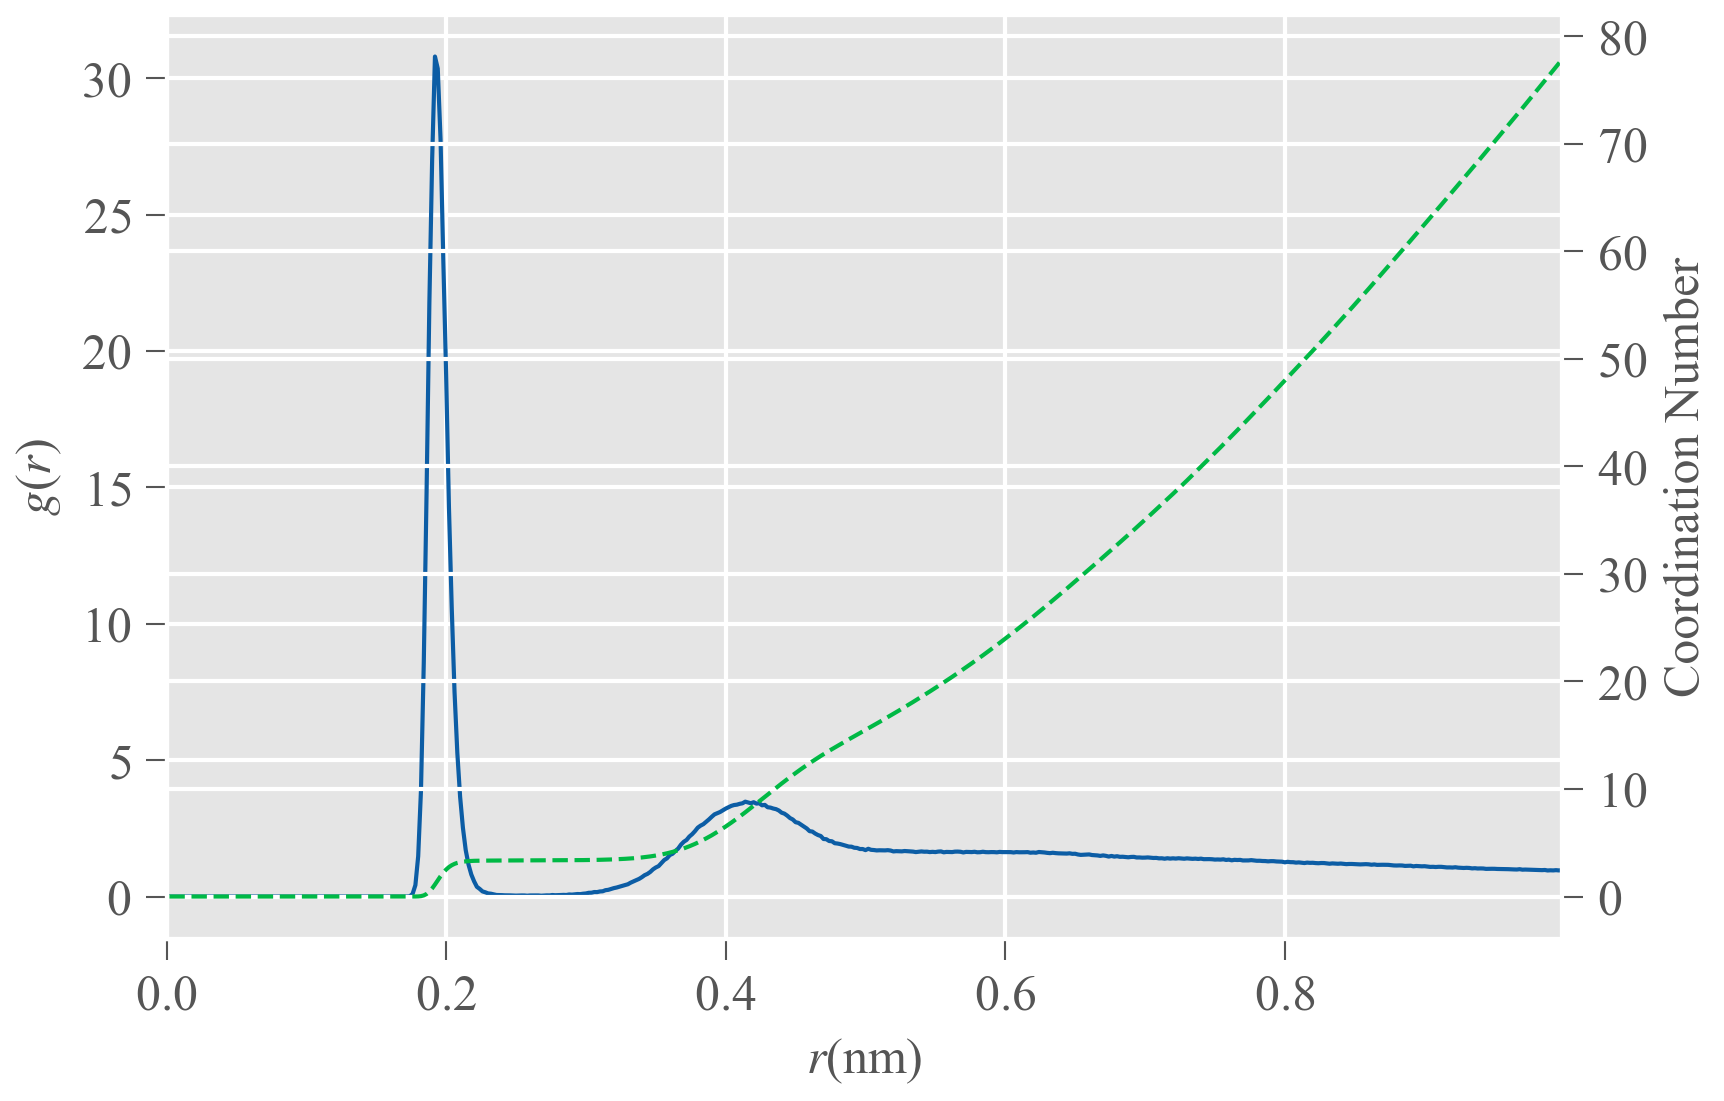
3: 设置作图格式文件路径,默认为./style/no-latex.mplstyle和./style/my.mplstyle - 按
4: 设置每一条曲线的图例,只有当0选项为True时,该设置才起作用,默认值直接从xvg文件中相关字段提取 - 按
5: 设置图例的位置,可选的位置有best,upper right,upper left,lower left和lower right,默认为best - 按
6: 设置x轴的范围,默认范围为(0, 1) - 按
d: 根据上述的作图设置将绘制的图片展示在界面上,不保存图片 - 按
s: 保存图片,可以选择的保存格式有eps,jpeg,jpg,pdf,pgf,png,ps,raw,rgba,svg,svgz,tif,tiff - 按
q: 退出程序
drawRDF.mp4
| 不使用图例 | 使用图例 |
|---|---|
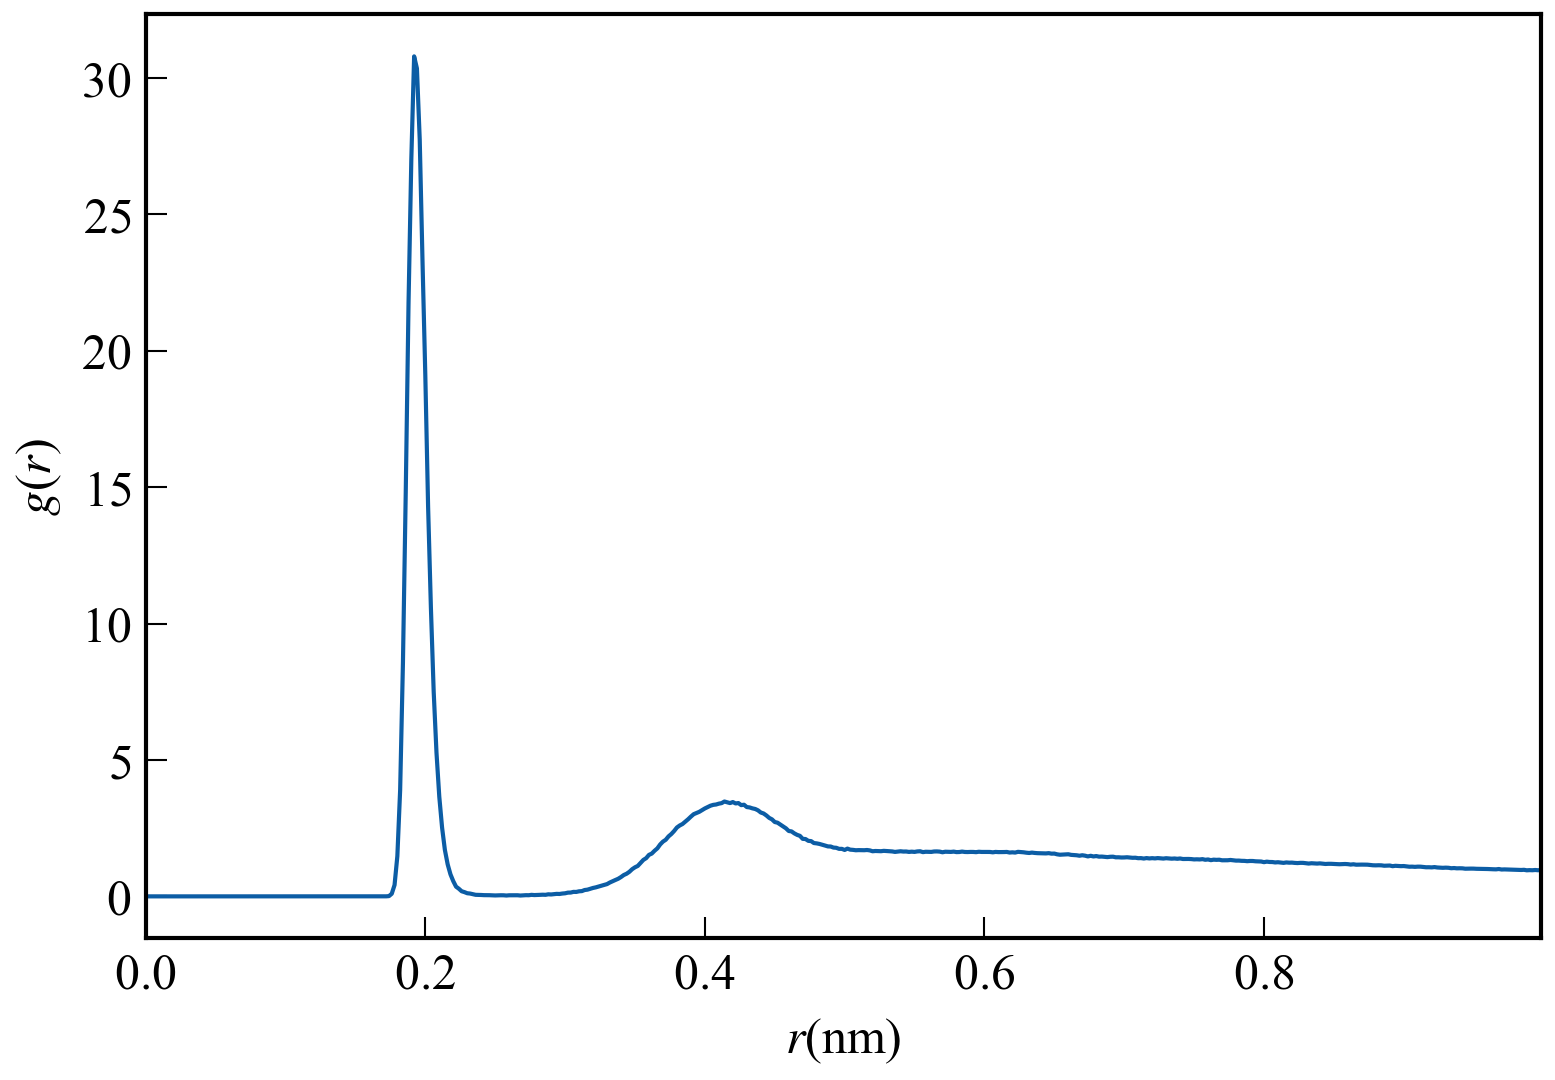 |
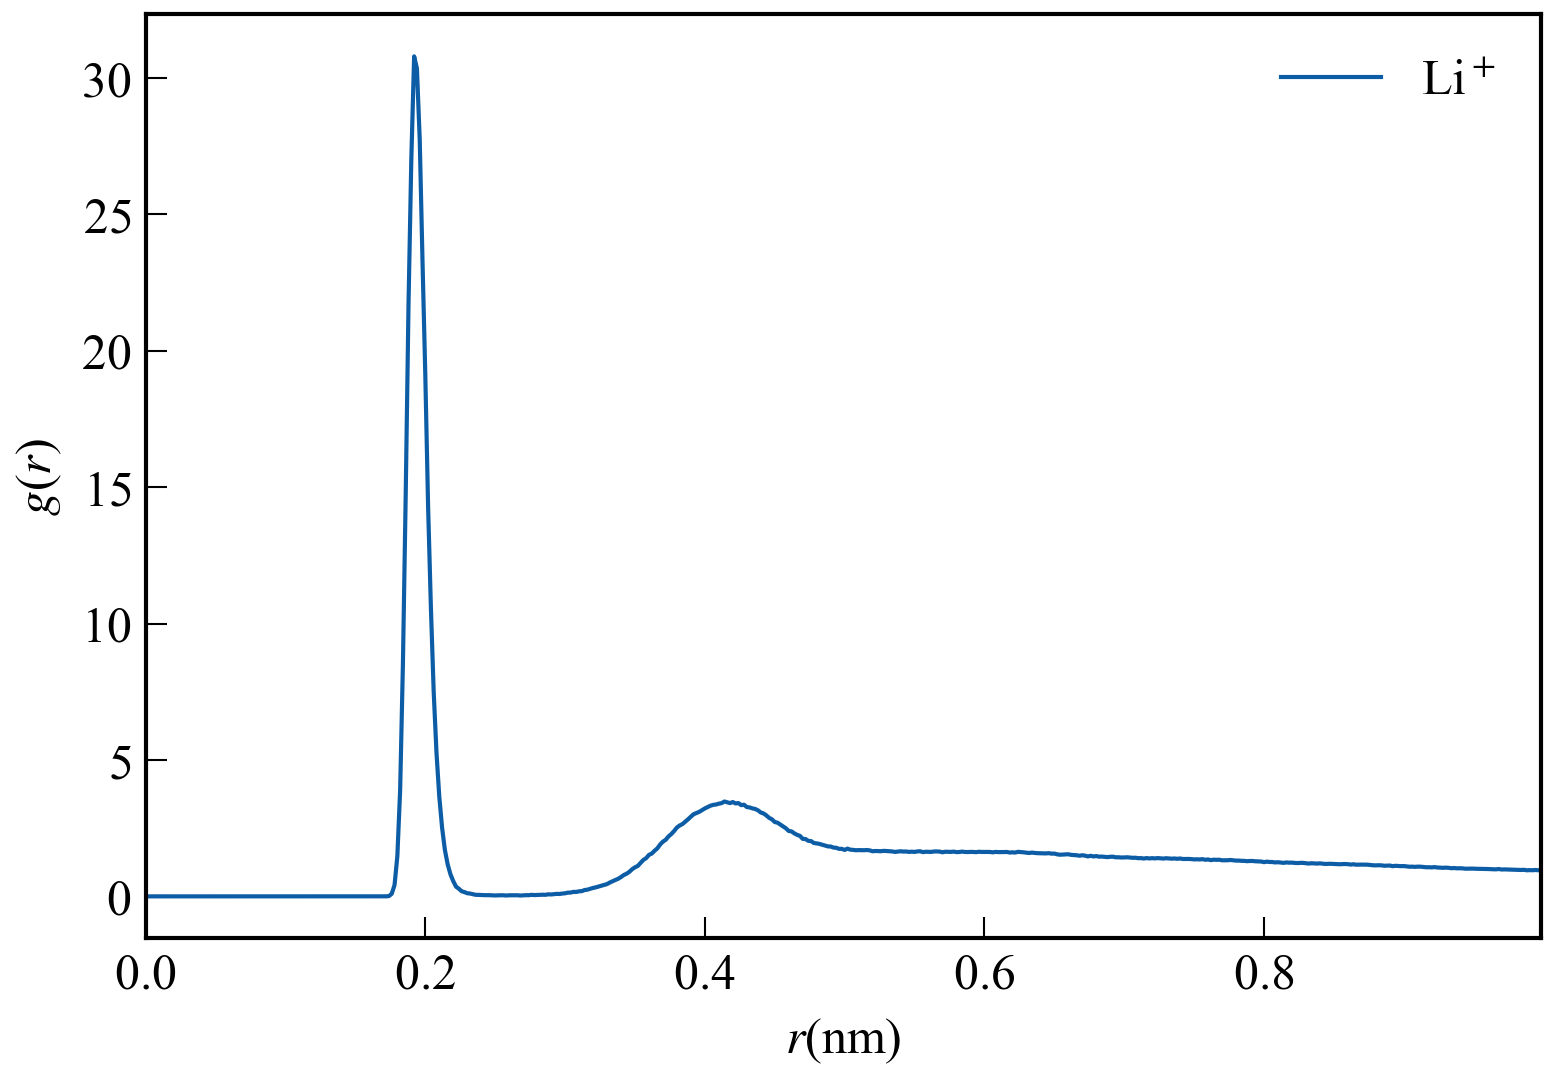 |
| 不使用图例 | 使用图例 |
|---|---|
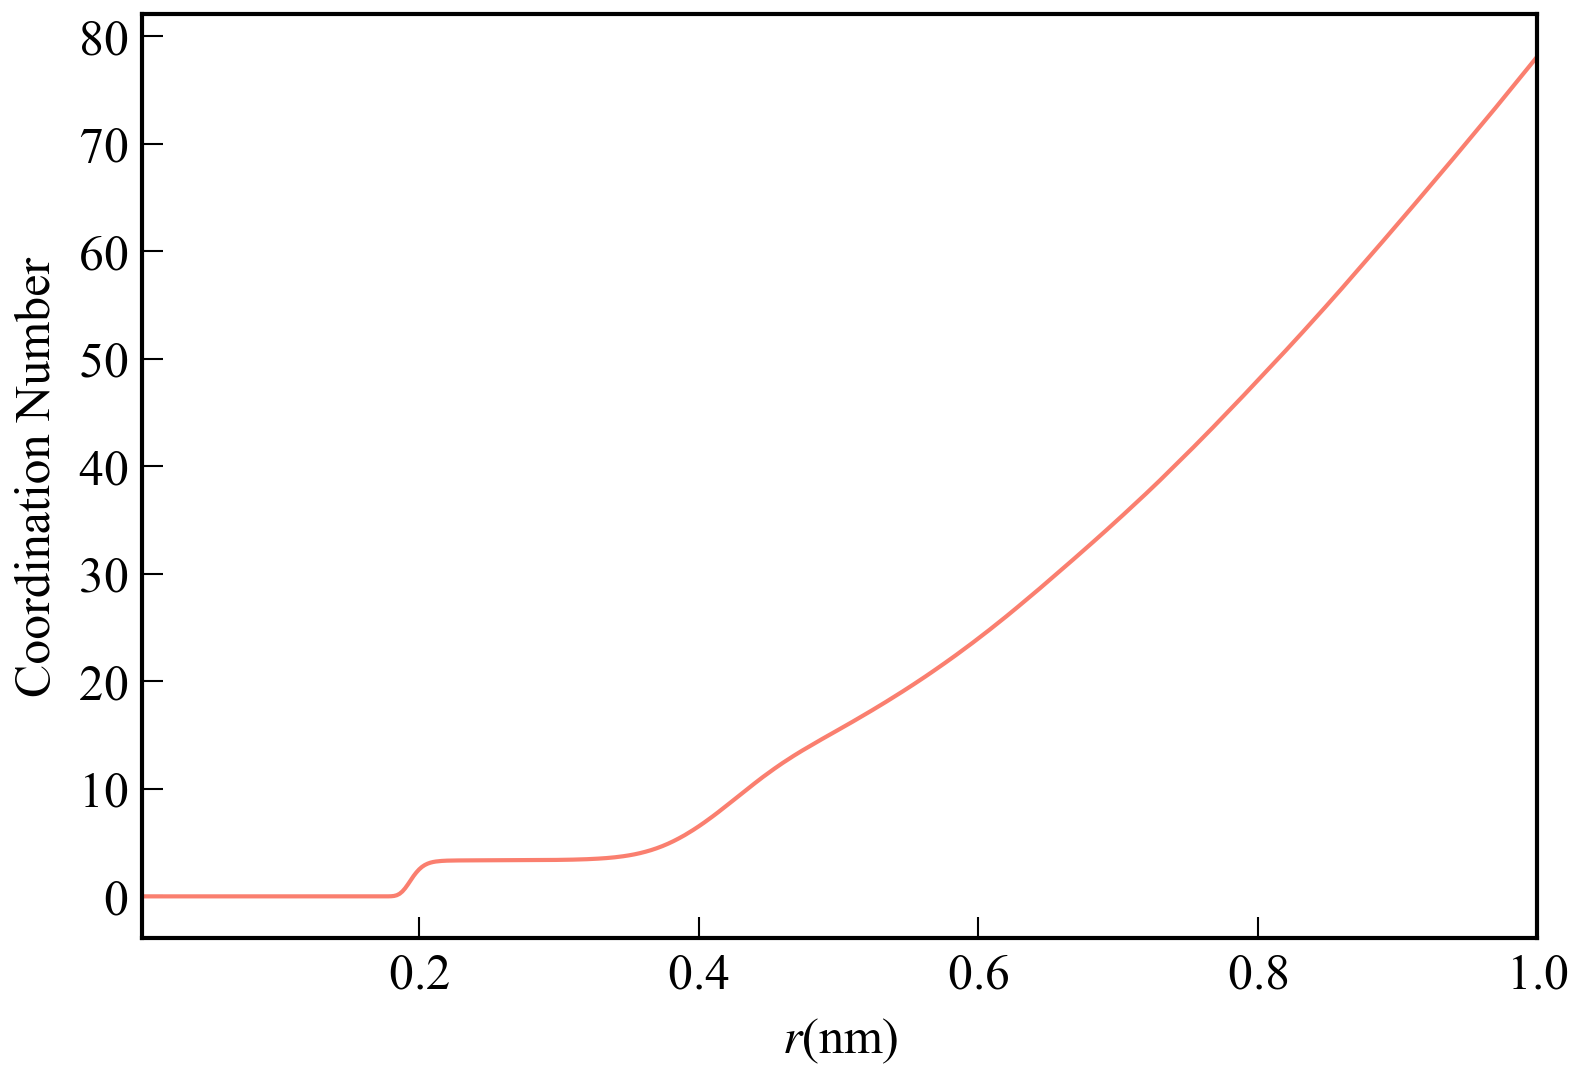 |
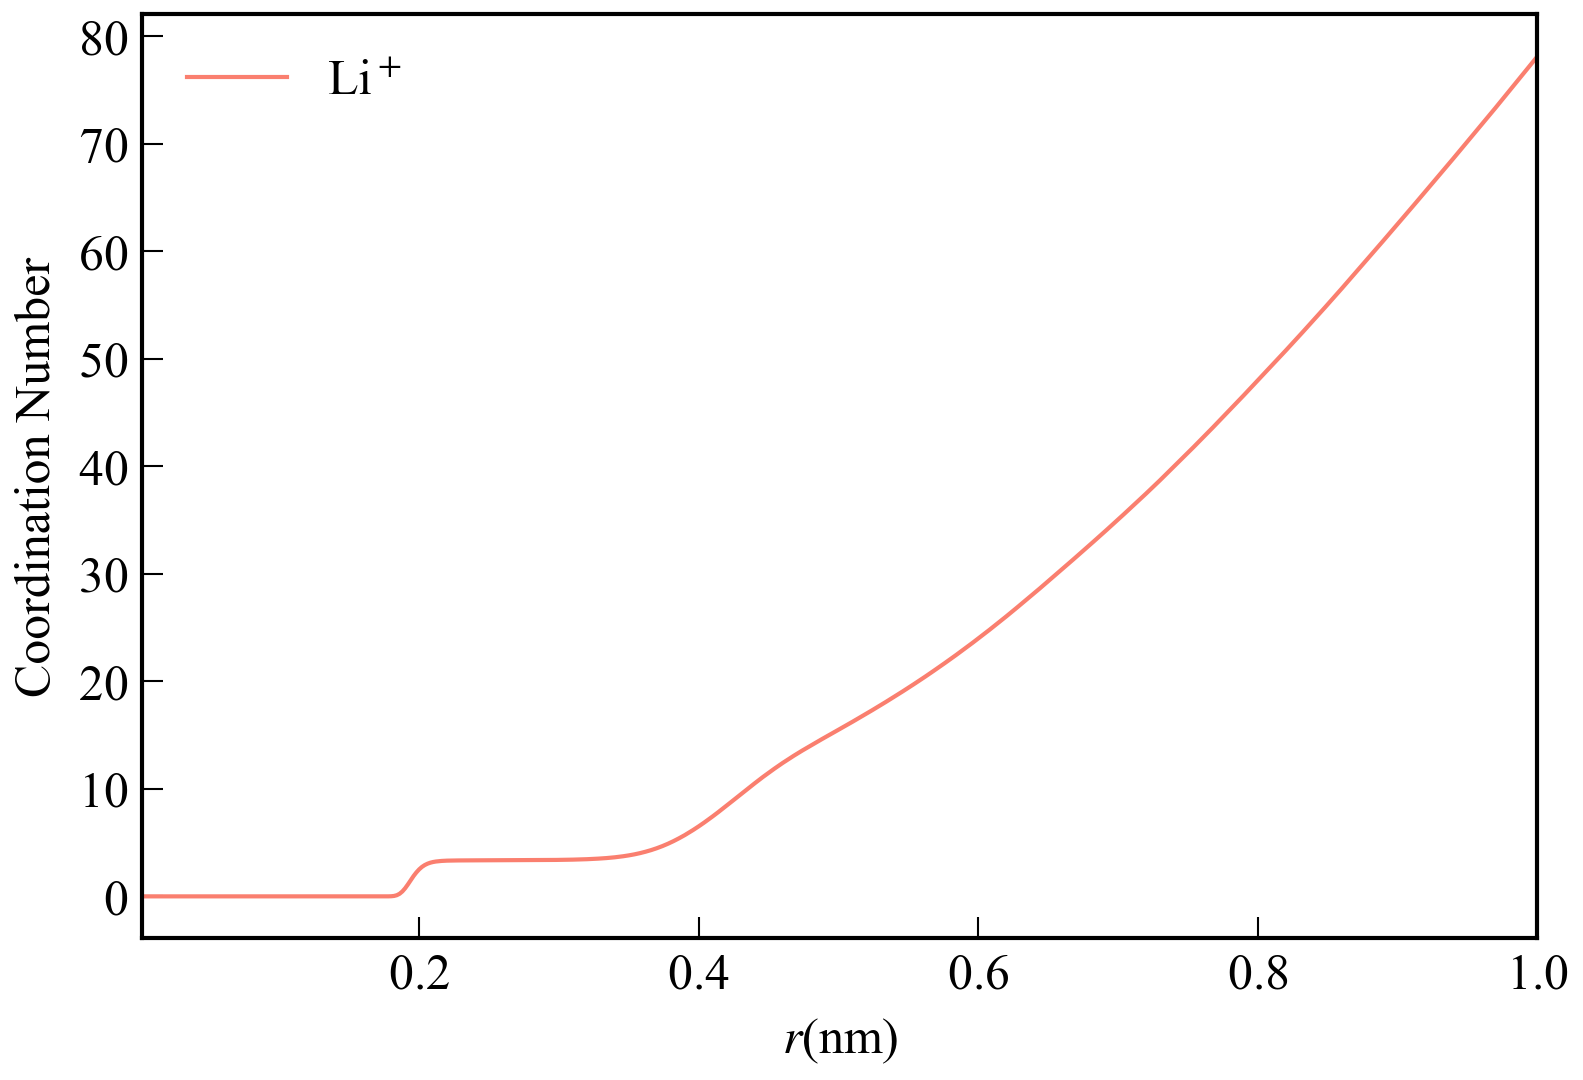 |
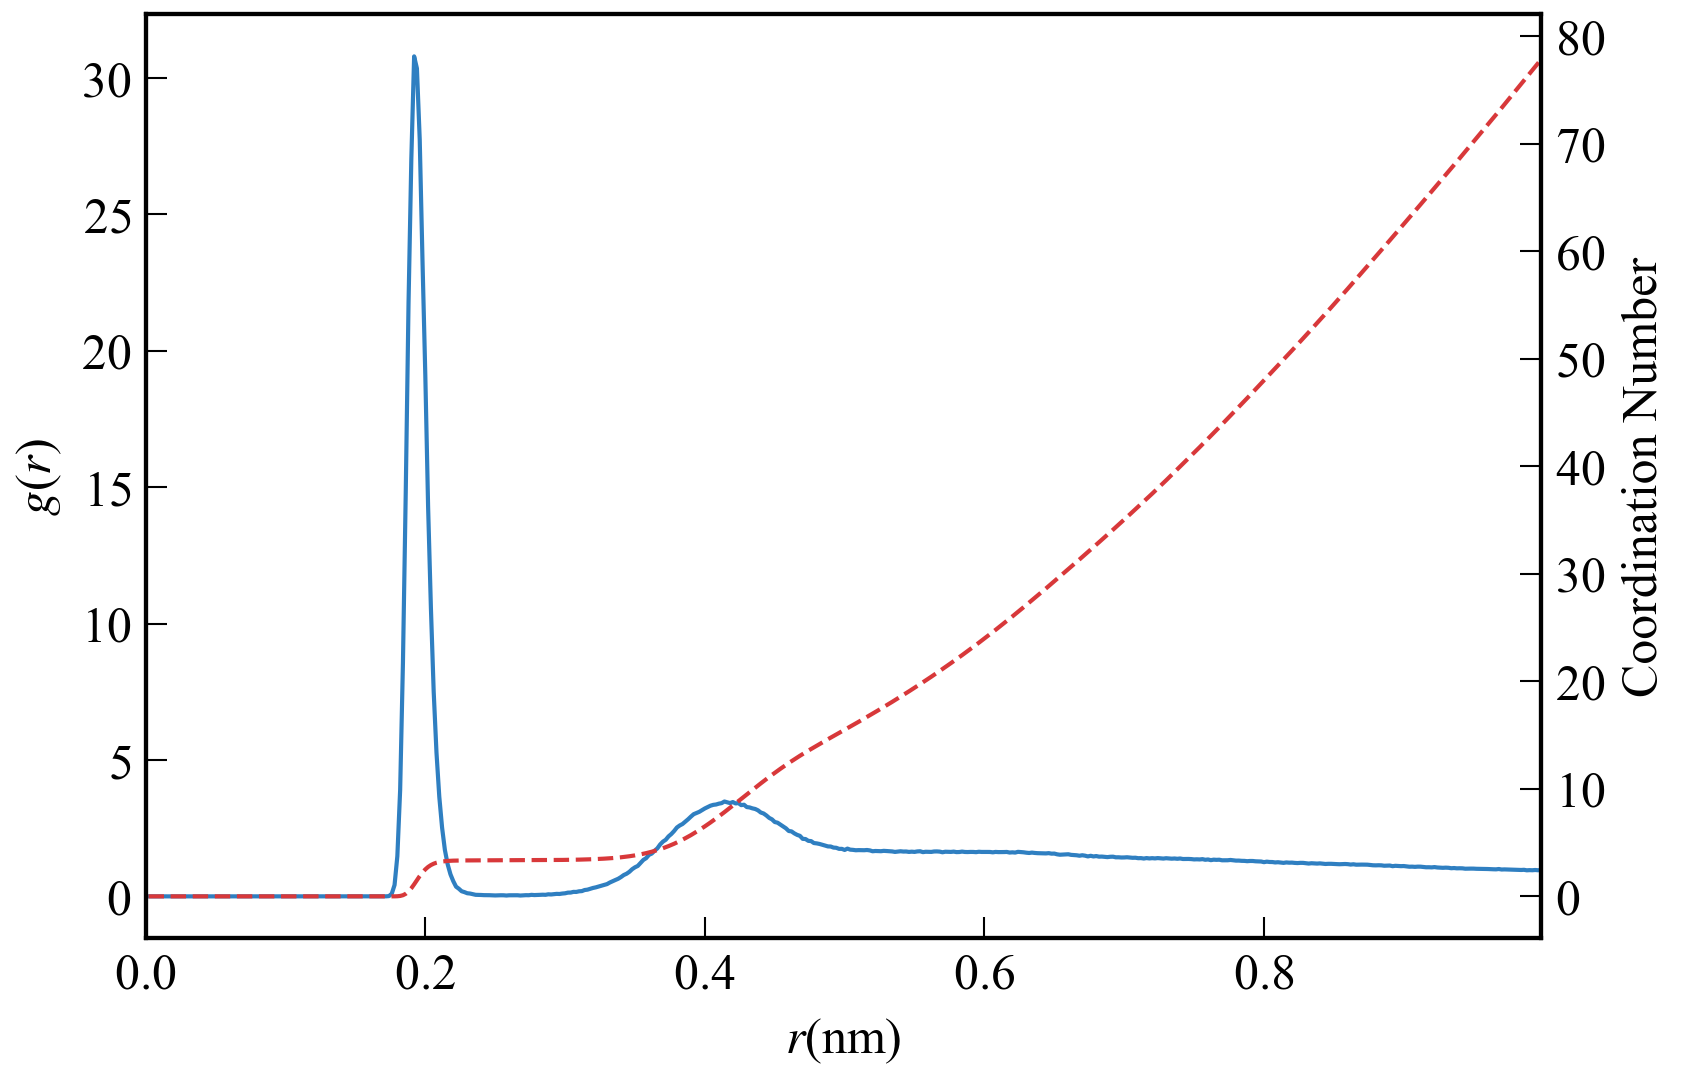 |
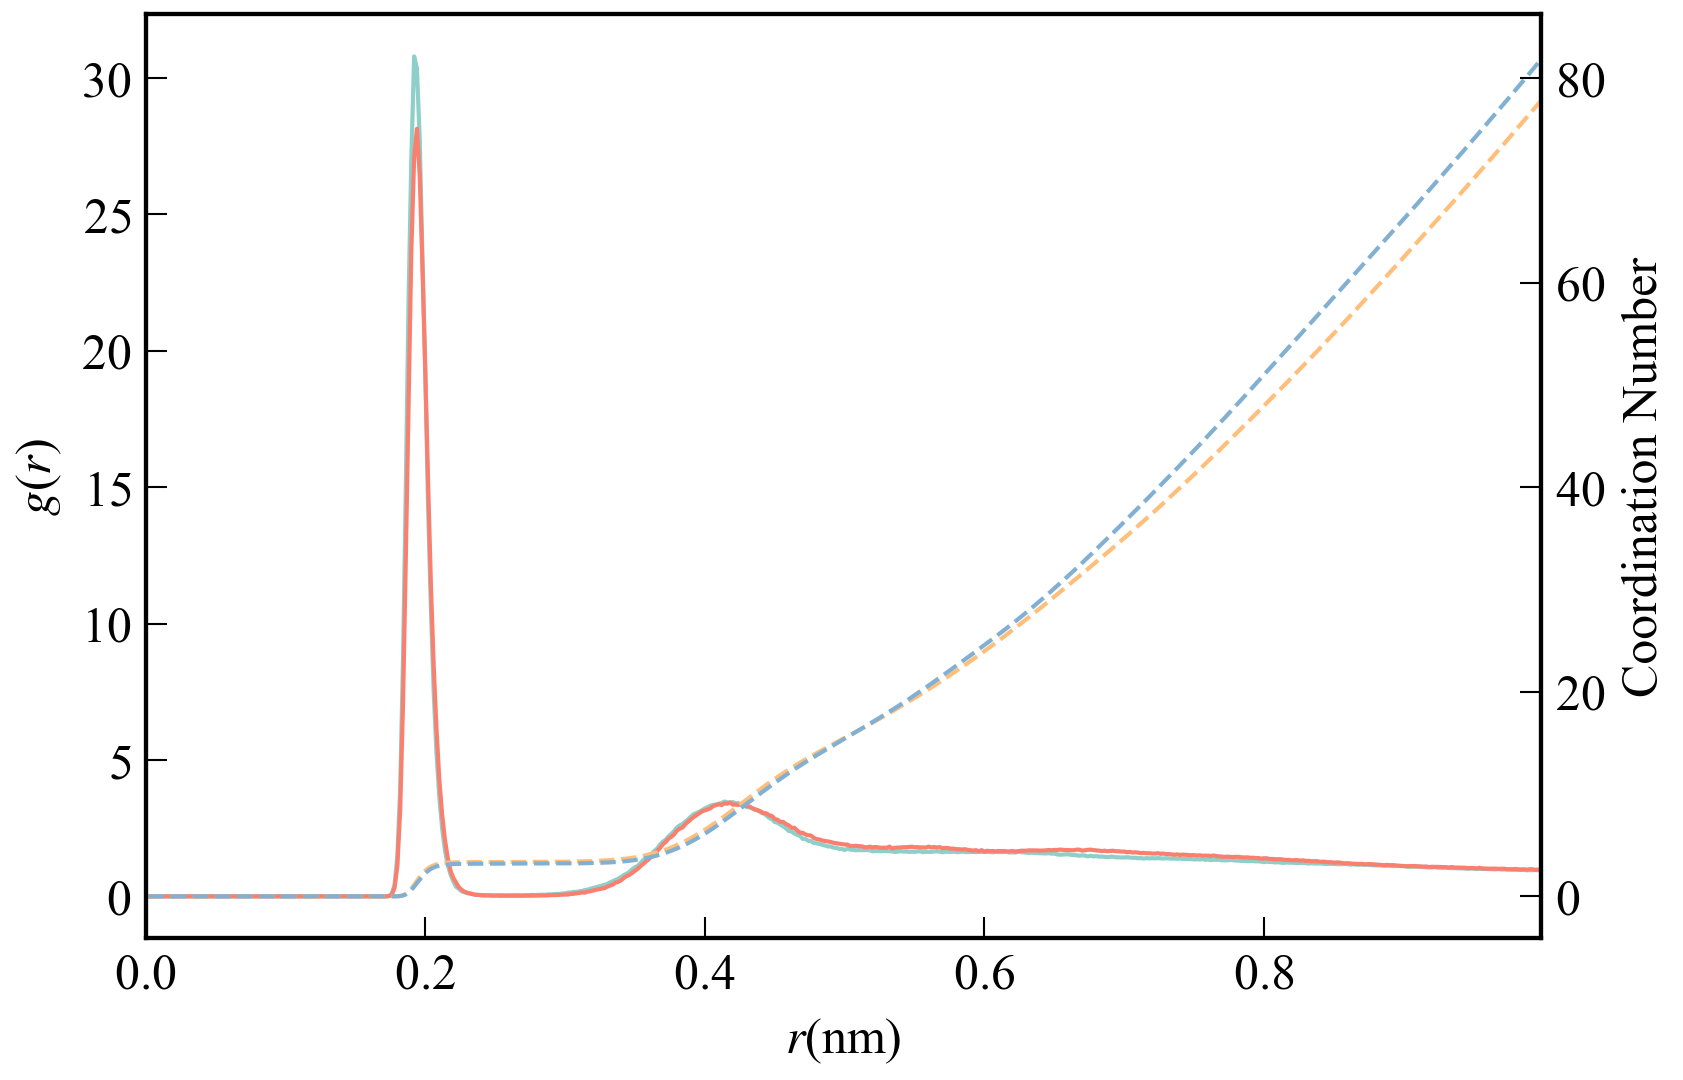 |
|---|
| Solarize_Light2风格 |
|---|
 |
| ggplot风格 |
|---|
 |
- [2024-Jul-18] 修改选项
0与选项5之间的逻辑关系,修复了某些bug。 - [2024-Jul-29] 推出
1.1版本。相较于上一个版本,该版本在以下的方面进行了调整:- 调整整个代码框架,删除了部分的冗余代码,使代码更加可读。
- 在界面上展示图片的功能与保存图片的功能分离,能够在不退出程序的情况下,多次修改绘图的细节,多次在屏幕上显示绘图图片,待图像符合要求后再保存。
- 保存图片的格式与保存图片的路径更加多样,可自由选择。
- 可对绘图的样式表进行实时的增加与删除。
- 能够方便的调整
x轴的坐标范围。
- [2024-Jul-31] 对选项
4相关设置的进行了调整。
- 若曲线图例中含有上角标可使用如下类似的方式
x$^2$,这表示x的平方。而对于镁离子可采用如下的输入Mg$^{2+}$ - 若曲线图例中含有下角标可使用如下类似的方式
H$_2$,这表示氢气的化学式。而对于水分子的化学式,可以输入H$_2$O
注意:若上标或下标的字符多于一个,需要用$$将上标或下标的部分括起来。
在开发drawRDF的过程中,主要使用到了以下的Python开源模组
- NumPy, https://numpy.org/
- Matplotlib, https://matplotlib.org/
- PyInstaller, https://pyinstaller.org/en/stable/
此外,还参考了以下Python开源模组的处理方式
- GromacsWrapper, https://gromacswrapper.readthedocs.io/en/latest/
- SciencePlots, https://github.com/garrettj403/SciencePlots
在此对上述模组的开发者表示感谢。
drawRDF基于MIT许可证开源。这意味着您可以自由地使用,修改和分发代码。