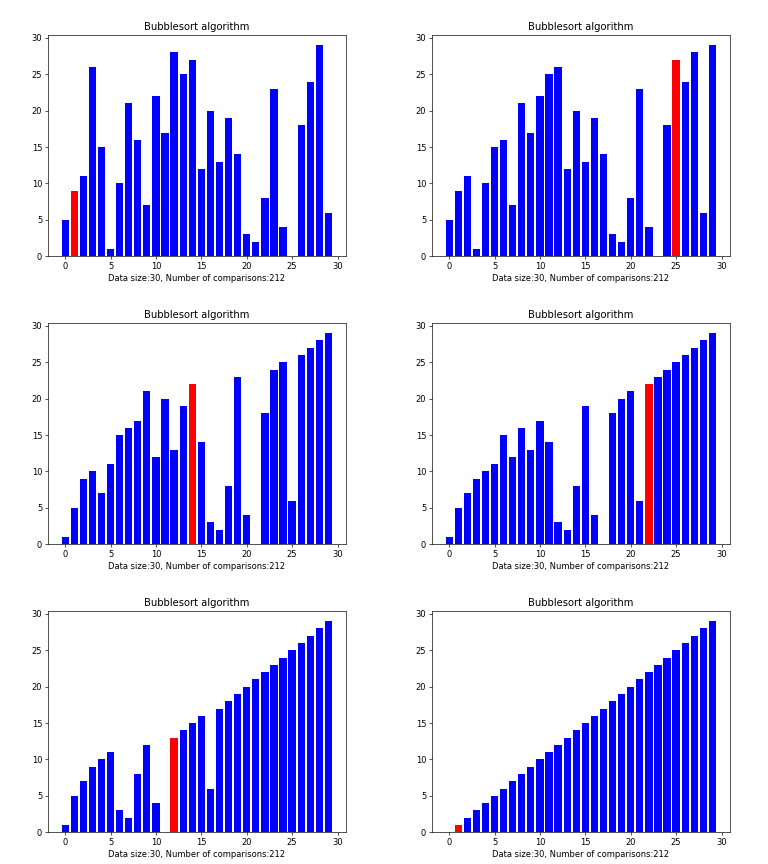
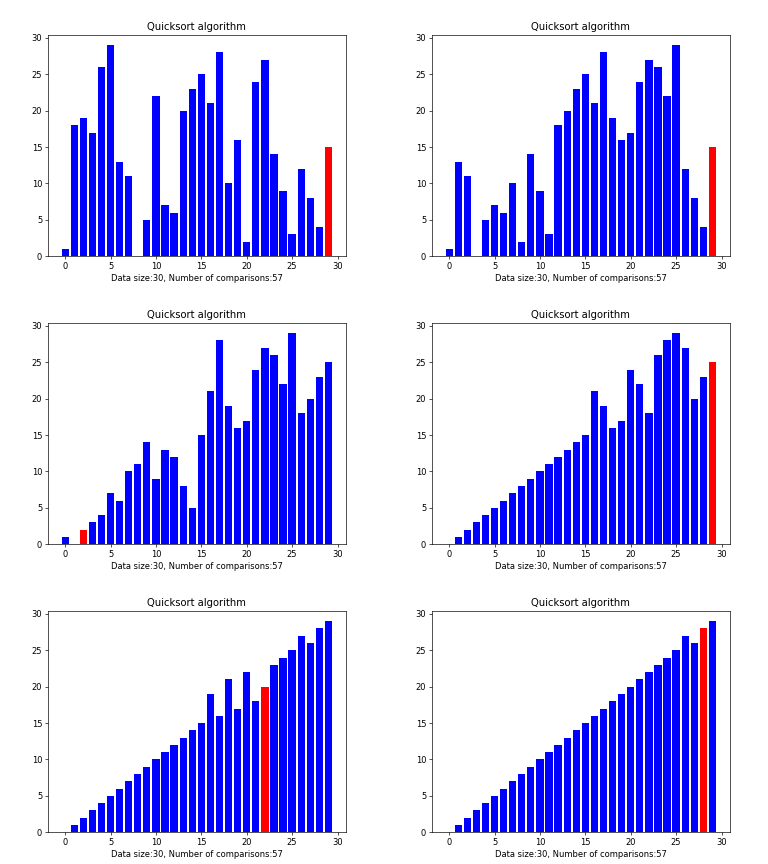
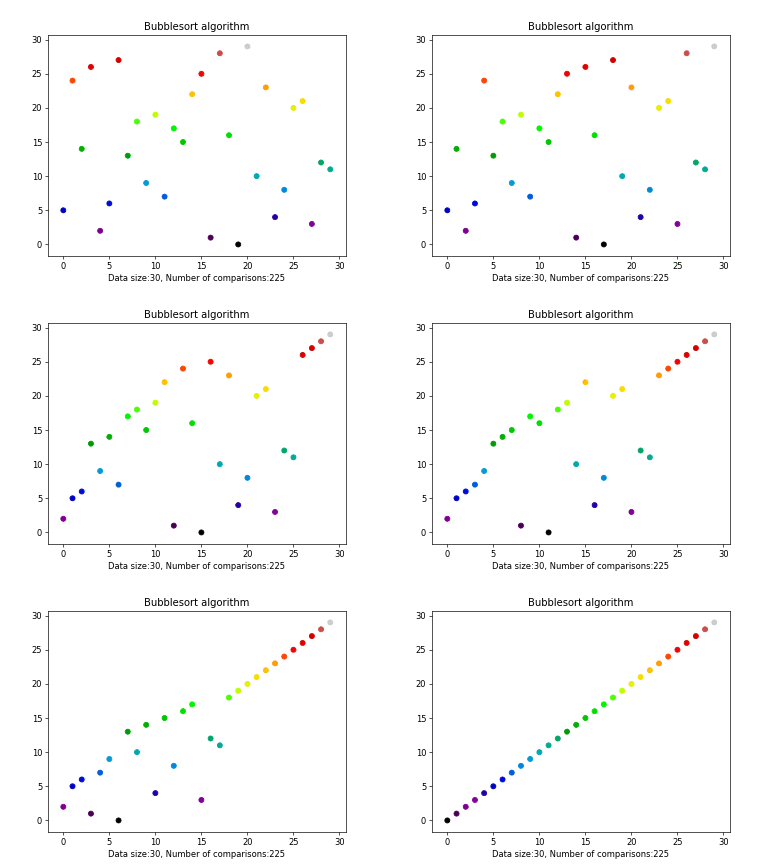
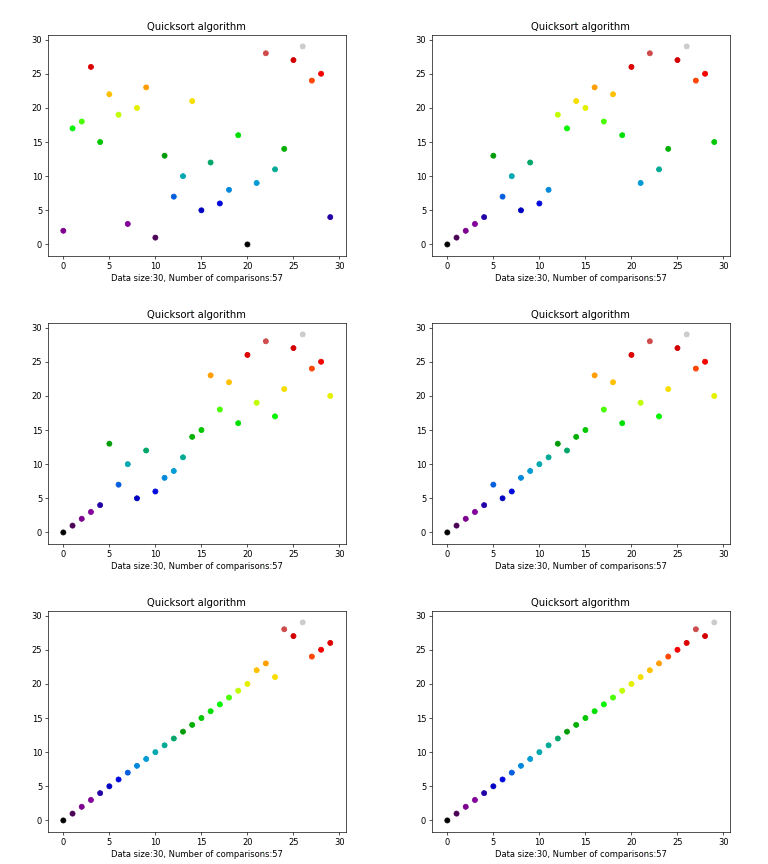
Scripts to visualize sorting algorithms using matplotlib animations
- Bubble sort
- Quick sort
- Heap sort
- Intro sort
The aim of this project is to make sorting algorithms easier to visualize and understand, using the animation capabilities of matplotlib.
- Python 3.6+
- Matplotlib
- Celluloid module(https://github.com/jwkvam/celluloid)
- Image magick to save as gif or ffmpeg to save as mp4
-
Install Matplotlib and Celluloid(if not already installed)
pip install celluloidpip install matplotlib -
Install ImageMagick or ffmpeg(optional)
-
Run main.py
python main.py
- (To run with defaut values just press enter)
- Select Data size(default 30)
- Select the algorithm(defaut is quicksort)
- Select the type of graph(defaut bar graph)
- Choose if you want to save
- Put new algorithm on root
- Import Plot from animate
- Use Plot function in algorithm function
- Add algorithm to algorithms in main file
- Add algorithm title in animate file


