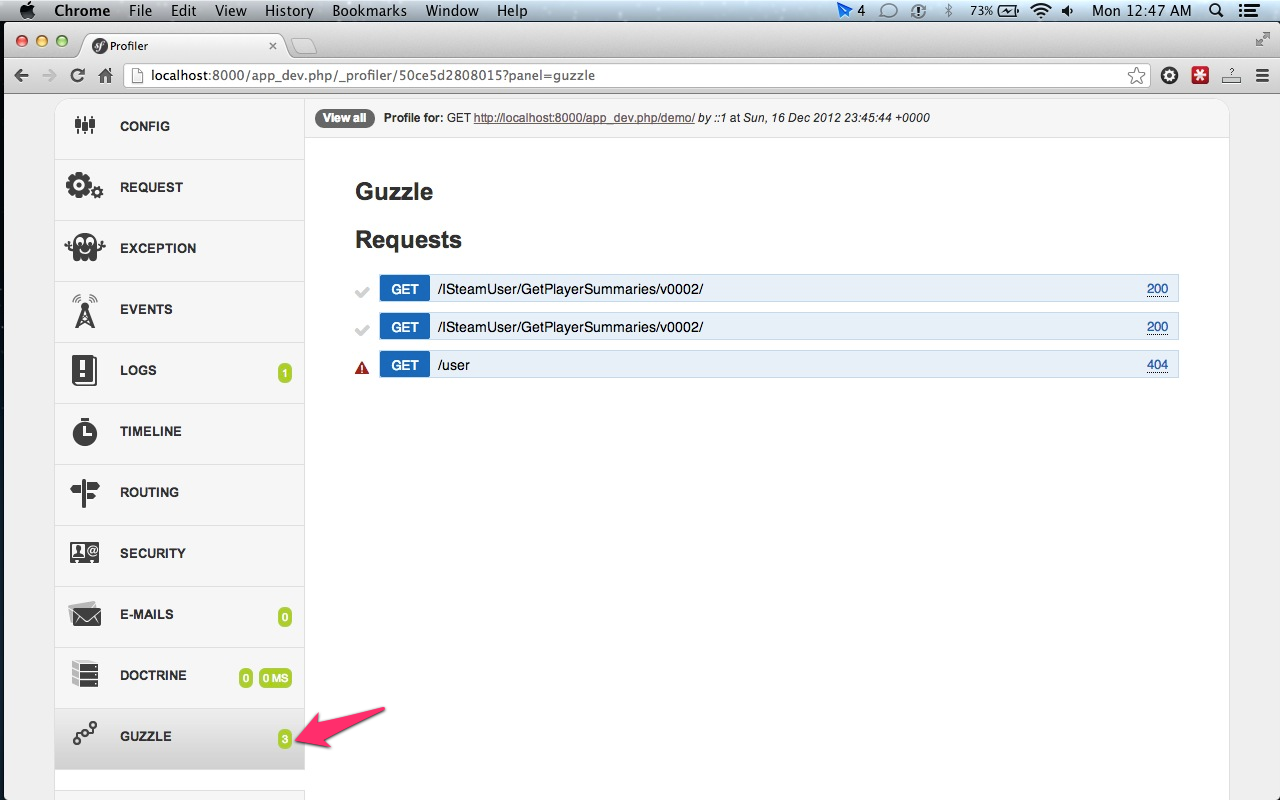
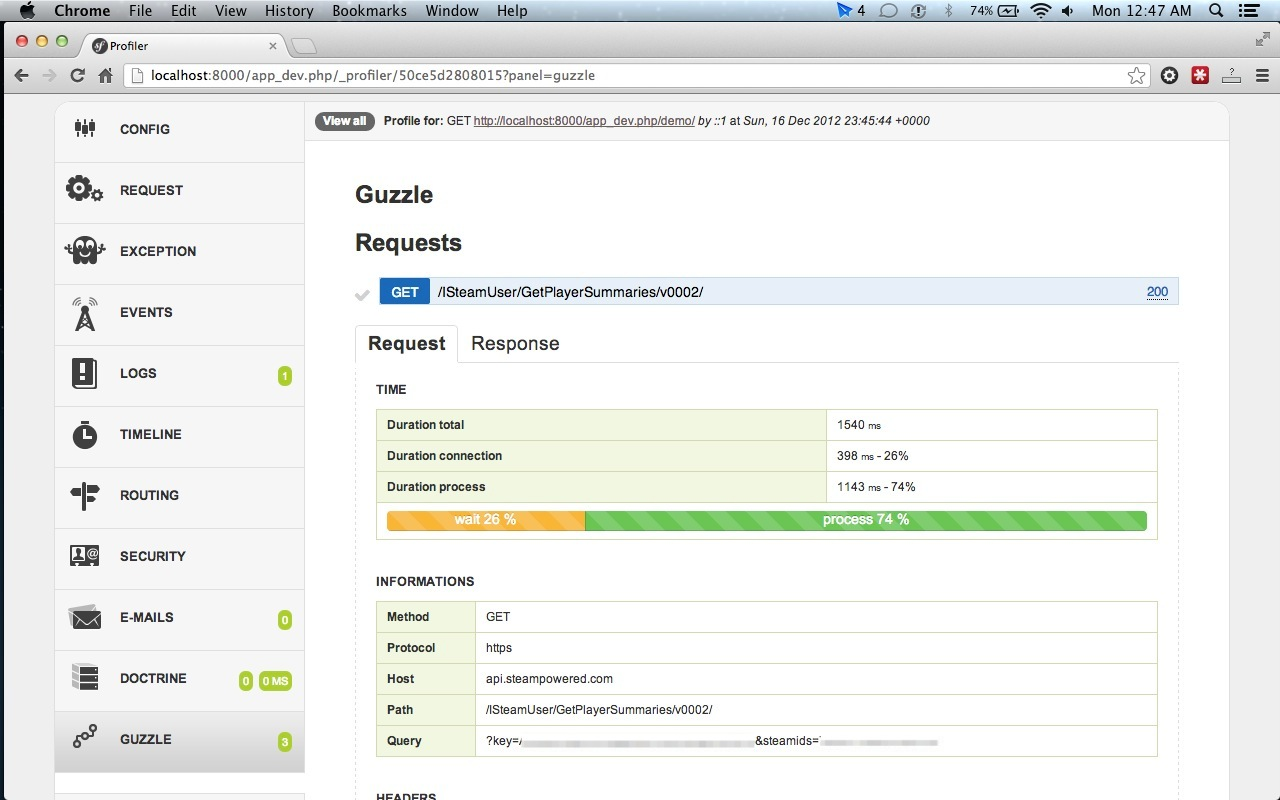
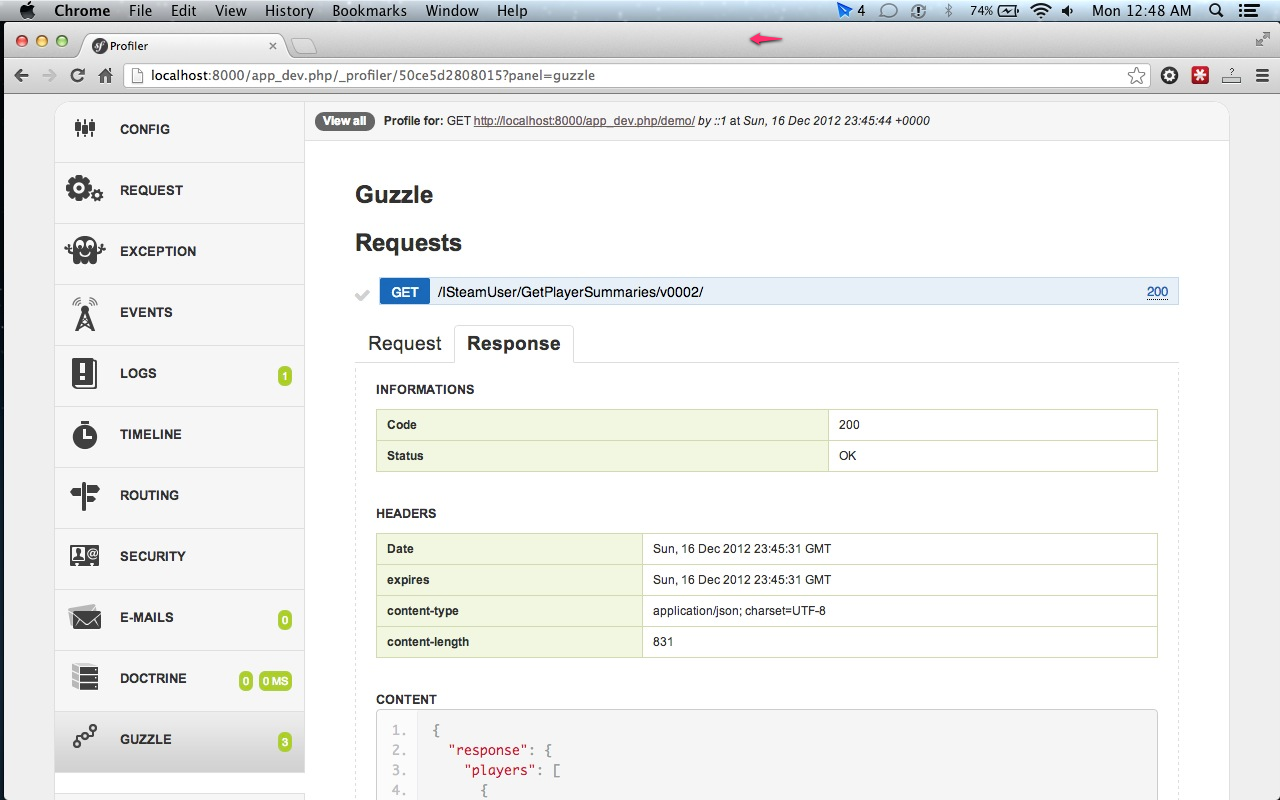
Provide a basic logger and an advanced profiler for Guzzle
- The basic logger use the default Symfony app logger, it's safe to use in your production environement.
- The advanced profiler is for debug purposes and will display a dedicated report available in the toolbar and Symfony Web Profiler
Add the composer requirements
{
    "require-dev": {
        "playbloom/guzzle-bundle": "v1.1.0"
    },
}
Add the bundle to your Symfony app kernel
<?php
    // in %your_project%/app/AppKernel.php
    $bundles[] = new Playbloom\Bundle\GuzzleBundle\PlaybloomGuzzleBundle();
?>
To enable the advanced profiler & the toolbar/web profiler panel, add this line to your app/config/config_dev.yml
playbloom_guzzle:
web_profiler: trueConcrete Guzzle client creation can be easily managed by the Symfony service container thanks to a simple factory configuration, in this case, you just need to tag your guzzle service(s) with playbloom_guzzle.client.
It will add the basic logger to your client(s). If the web_profiler is enabled in the current environement, it will also add the advanced profiler and display report on the Symfony toolbar/web profiler.
<service id="acme.client"
    class="%acme.client.class%"
    factory-class="%acme.client.class%"
    factory-method="factory">
    <!-- your arguments -->
    <tag name="playbloom_guzzle.client" />
</service>If you need to handle the registration of the logger or profiler plugin manually, you can retrieve theses services from the Symfony container.
<?php

$client = new \Guzzle\Http\Client('https://my.api.com');

// basic logger service plugged & configured with the default Symfony app logger
$loggerPlugin = $container->get('playbloom_guzzle.client.plugin.logger');
$client->addSubscriber($loggerPlugin);

// advanced profiler for developement and debug, requires web_profiler to be enabled
$profilerPlugin = $container->get('playbloom_guzzle.client.plugin.profiler');
$client->addSubscriber($profilerPlugin);

?>If you need a custom profiler panel you can extend/reuse easily the data collector and profiler template from this bundle.
For example, you have a GithubBundle which interact with the Github API. You also have a Github profiler panel to debug your developement and you want to have the API requests profiled in this panel.
It's quite easy:
First, define your own GithubDataCollector extending the Playbloom\Bundle\GuzzleBundle\DataCollector\GuzzleDataCollector
Then extends the guzzle web profiler template
{% extends 'PlaybloomGuzzleBundle:Collector:guzzle.html.twig' %}

{% block panel %}
    <div class="github">
        <h2>Github</h2>
        <ul>
            <li><strong>Github API key:</strong> {{ collector.getApiKey }}</li>
            <!-- Some custom information -->
        </ul>
    </div>

    {% include 'PlaybloomGuzzleBundle:Profiler:requests.html.twig' with {'requests': collector.requests } %}
{% endblock %}
And finally declare your data collector
<service id="data_collector.github" class="Acme\GithubBundle\DataCollector\GithubDataCollector">
    <argument type="service" id="playbloom_guzzle.client.plugin.profiler"/>
    <tag name="data_collector"
        template="AcmeGithubBundle:Collector:github"
        id="github"/>
</service>
That's it, now your profiler panel displays your custom information and the Guzzle API requests.
- Add extra information about the client configuration itself (thanks to the guzzle service builder?)
- Add clients|host|endpoint|time filters for http requests
This bundle is under the MIT license. See the complete license in the bundle
- Swagger for the UI


