A platform for real-time ingestion and processing of cryptocurrency trading events, built with TypeScript, Node.js and Redis.
You need Docker and Docker Compose installed.
The platform includes all necessary defaults; in order to change any parameter you need to edit the process.json file.
The structure of this file is:
{
  "name": "",   // process name
  "script": "", // script name
  "env": {      // environment variables
                // here's what you probably want to change
  }
},
The following is a table of configuration values:
| Process | Variable name | Example | Description |
|---|---|---|---|
gdax-source |
PAIRS |
["BTC-USD","LTC-USD"] |
Pairs to subscribe for notifications |
okex-source |
PAIRS |
["btc_usdt","eth_usdt"] |
Pairs to subscribe for notifications |
aggr-ticker-bolt |
EXPIRATION_SECONDS |
900 |
Expiration time (in seconds) for 1-second aggregation data |
aggr-ticker-bolt |
EXPIRATION_MINUTES |
1800 |
Expiration time (in seconds) for 1-minute aggregation data |
$ docker-compose up -d --buildTo see logs, you can type
$ docker-compose logsYou can also open the monitor dashboard by opening a browser at http://localhost:3000, and the web console at http://localhost:7980.
$ docker-compose stop
$ docker-compose start$ docker-compose downThe architecture is microservice-based and comprises 3 conceptual systems: Ingestion, Streaming and Consumption. The terminology and concepts in this documentation were partially borrowed from Apache Storm.
Represents the API service provided by a given exchange (e.g. GDAX, OKEX, Binance). Typically a WebSocket interface is available for consuming real-time events.
The Source service has the following responsabilities:
- Establish a connection to a given exchange WebSocket (taking care of reconnections and errors)
- Annotate the incoming messages with
$sourceand$its(ingestion timestamp) properties - Insert the message into the Buffer
Every instance of a Source service is associated to a single exchange; so the platform will run as many Source services as exchanges you want to consume.
It is a Redis List (by default under the key {exchange}.buffer, e.g. gdax.buffer). If the buffer grows until Redis is about to hit your system's available memory, it will reject new data.
The Spout service has the following responsabilities:
- Take messages from the Buffer
- Apply a mapping to the message (see "Mapper" below)
- Publish the message to the event bus via the channel/stream
{prefix}.{exchange}.{pair}whereprefixis by defaultfeed; e.g.feed.gdax.ETH-BTC.
Every instance of Spout is associated to a single buffer, which means you will have at least as many Spouts as exchanges you want to consume. You can scale Spouts if necessary, having multiple Spouts pointing to the same Buffer. It is guaranteed no duplicated messages will be processed.
Mappers are not services but tiny modules that are imported and used by Spouts. They are currently very dumb at this point. Eventually they will probably grow to be responsible for mapping exchange-specific format to a normalized platform format.
Depending on the exchange, they might filter some messages.
Right now the only normalization they do is in the currency pair, stamping all messages with a $pair property. The rest of the message is preserved in the original format from the exchange.
It is a Redis Pub/Sub and nothing else. Messages are published by Spouts and consumers may subscribe to a specific channel or psubscribe to a pattern, e.g. feed.* or feed.*.ETH-BTC.
The Bolt service can be seen as a pipe or function. It subscribes to one or more channels in the event bus, receives a message, does some computation and emits another message in result.
Bolts need to process incoming messages fast enough to not allow event bus buffering to build up. Otherwise they will be disconnected from the channel. It is recommended for bolts to not take more than 30ms, if they do you may want to fork the stream into a deferred one by having a bolt that puts messages into a buffer/queue and have another one that processes at its pace.
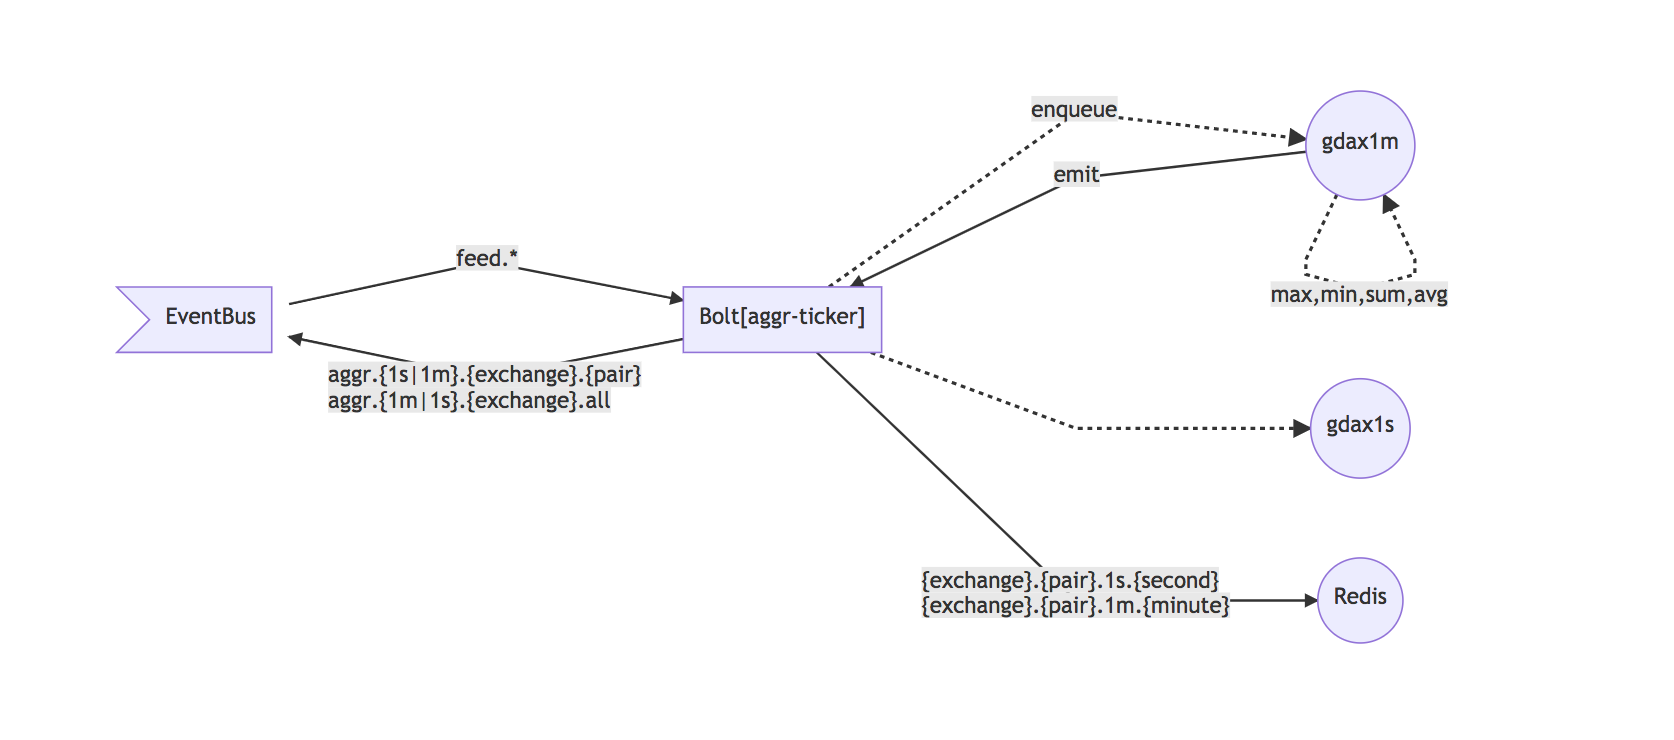
Calculates highest, lowest, sum and average of all available stats, per currency pair per exchange.
(example diagram only shows GDAX but same goes with other exchanges)
-
Subscribes to all available feed channels, where Spouts publish messages under
feed.{exchange}.{pair} -
Opens 1-minute and 1-second aggregation windows for every exchange, using a exchange-specific module that knows the format of the message (e.g.
aggr-binance,aggr-gdax,aggr-okex) -
Every incoming message is enqueued into both windows, which stamp a set of common properties (see "Common Aggregated Format" below) and calculate the aggregated stats for every individual stat (see "Aggregation" below)
-
When each time window emits (every 1 minute and 1 second respectively), it
4.1. Stores the stats in Redis under the key
{exchange}.{pair}.{1s|1m}.{timestamp}, e.g.gdax.ETH-BTC.1s.1522665224000;4.2. Sets an expiration for that key, by default 15 minutes for second aggregation and 15 days for minute aggregation;
4.3. Publishes the stats back to the event bus via the channels
aggr.{1s|1m}.{exchange}.{pair}andaggr.{1s|1m}.{exchange}.all, the latter containing all pairs in a single message. E.g.aggr.1s.gdax.ETH-BTCandaggr.1s.gdax.all.
All aggregated messages have properties derived from the exchange-specific stats, but also they extend from a base common type that provides a set of useful and normalized properties:
| property | description |
|---|---|
| timestamps | timestamps of messages involved in the aggregation |
| count | number of messages involved in the aggregation |
| time | timestamp associated to the aggregation (e.g. this is second 6 in time 18:45:06) |
| unit | unit for the time above; m for minutes or s for seconds |
| pair | currency pair |
The appended aggregated properties are stamped with the original stat name, prefixed by highest, lowest, sum, average and using the original notation; for instance, GDAX uses underscore_notation, so for the stat best_ask the result would look like this:
{
  "highest_best_ask": "673",
  "lowest_best_ask": "672.59",
  "sum_best_ask": "2691.59",
  "average_best_ask": "672.8975"
}
OKEX uses camelCaseNotation, so the output message (example for the sell stat) would be:
{
  "highestSell": "0.0691",
  "lowestSell": "0.0691",
  "sumSell": "0.2073",
  "averageSell": "0.04606666666666666667"
}
For a complete reference of the aggregated types and their properties, check their type definitions.
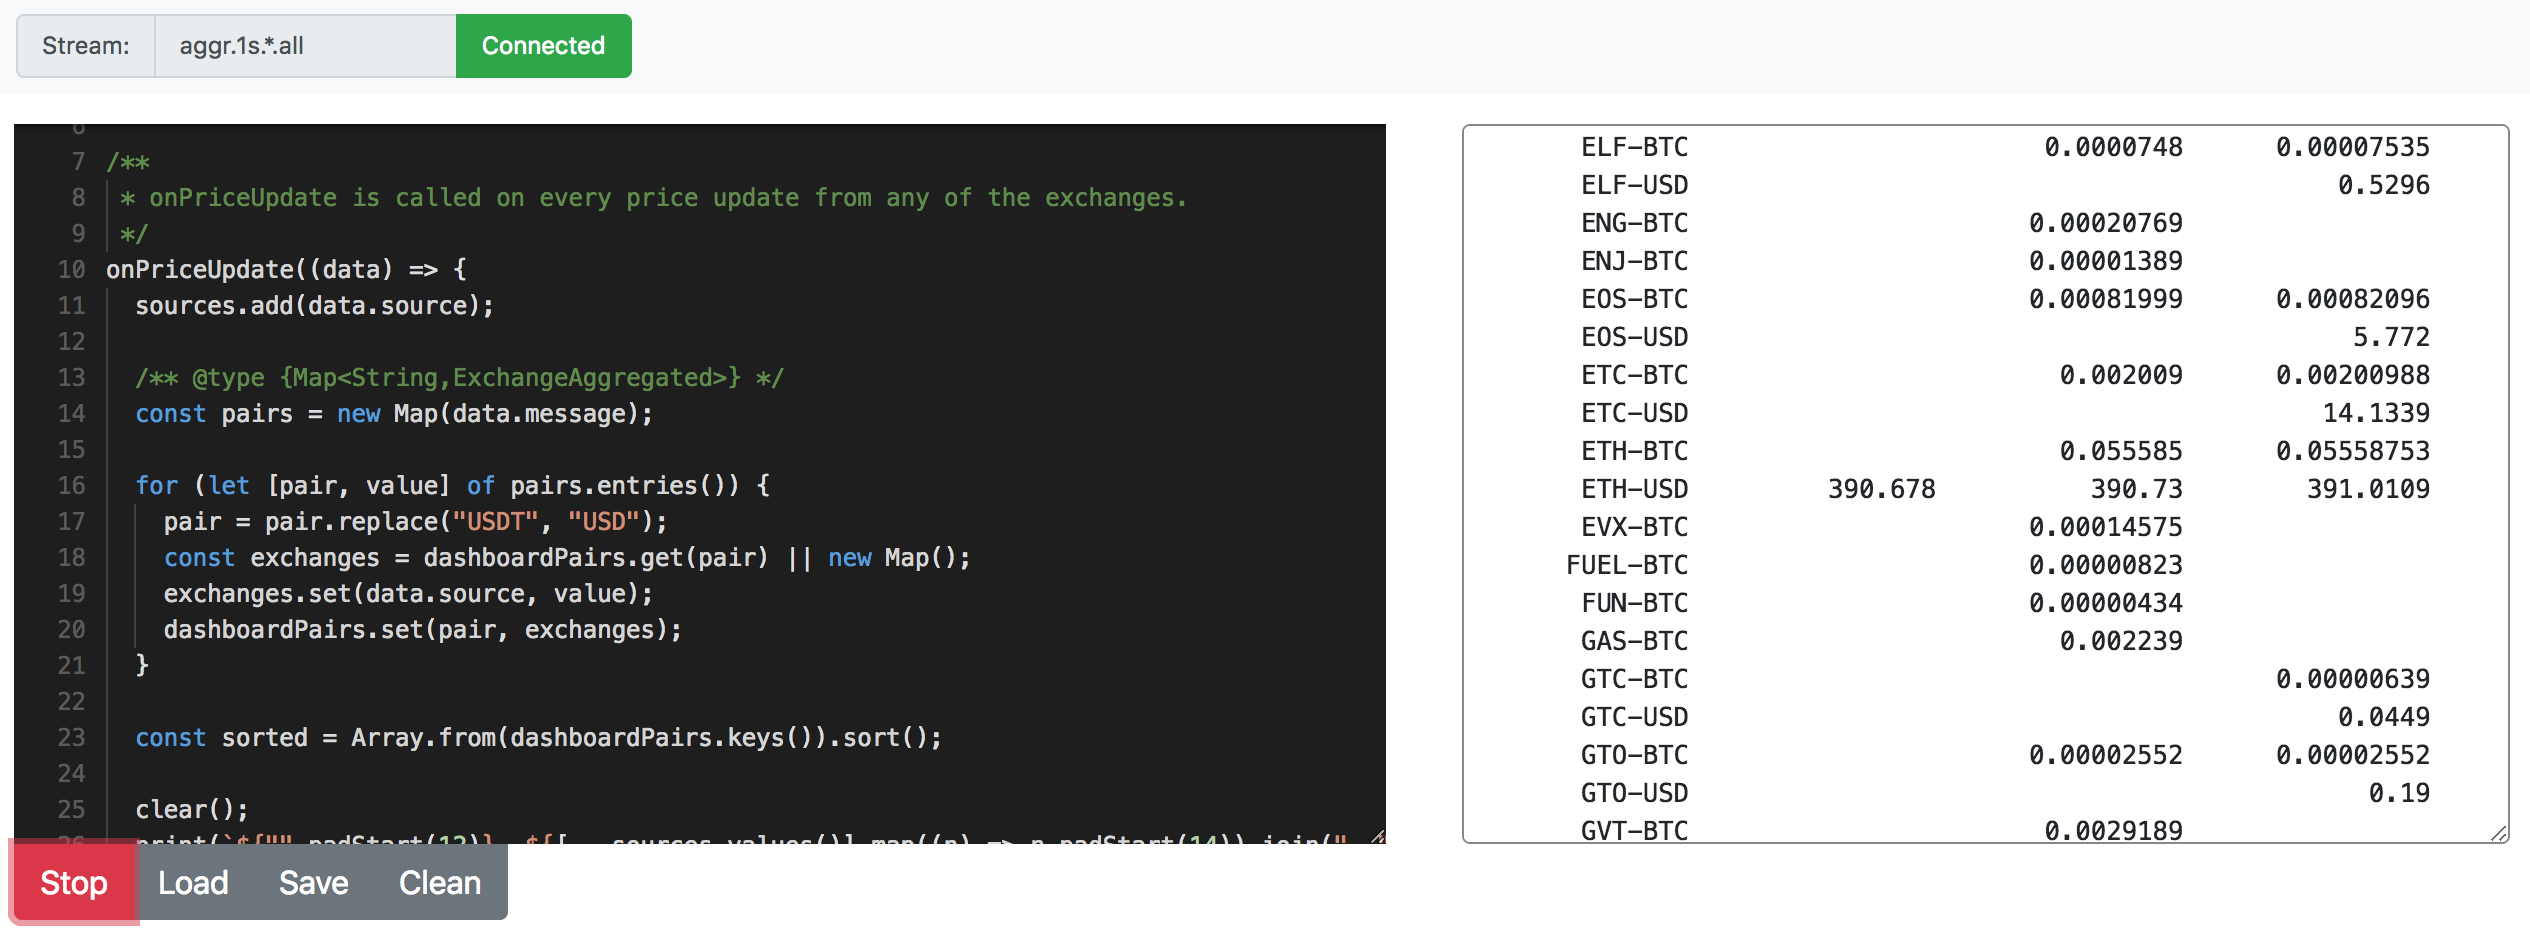
This is a web application that allows the user to consume the stream very easily by writing JavaScript code that handles every incoming message, useful for testing algorithms or quickly calculating data. It is available at port 7980 by default.
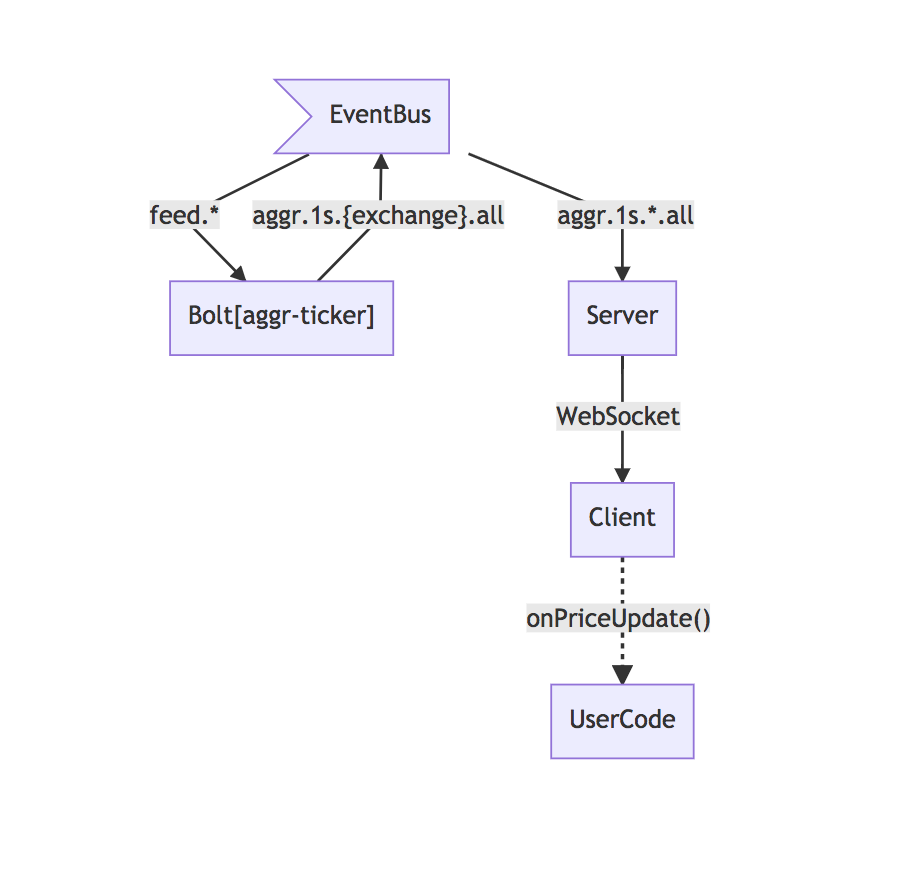
The app server subscribes to the 1-second aggregated channel and sends the data to the client via WebSockets. The client invokes the user's function handler passing the message as argument.
The helper functions print and clear allows to write output.
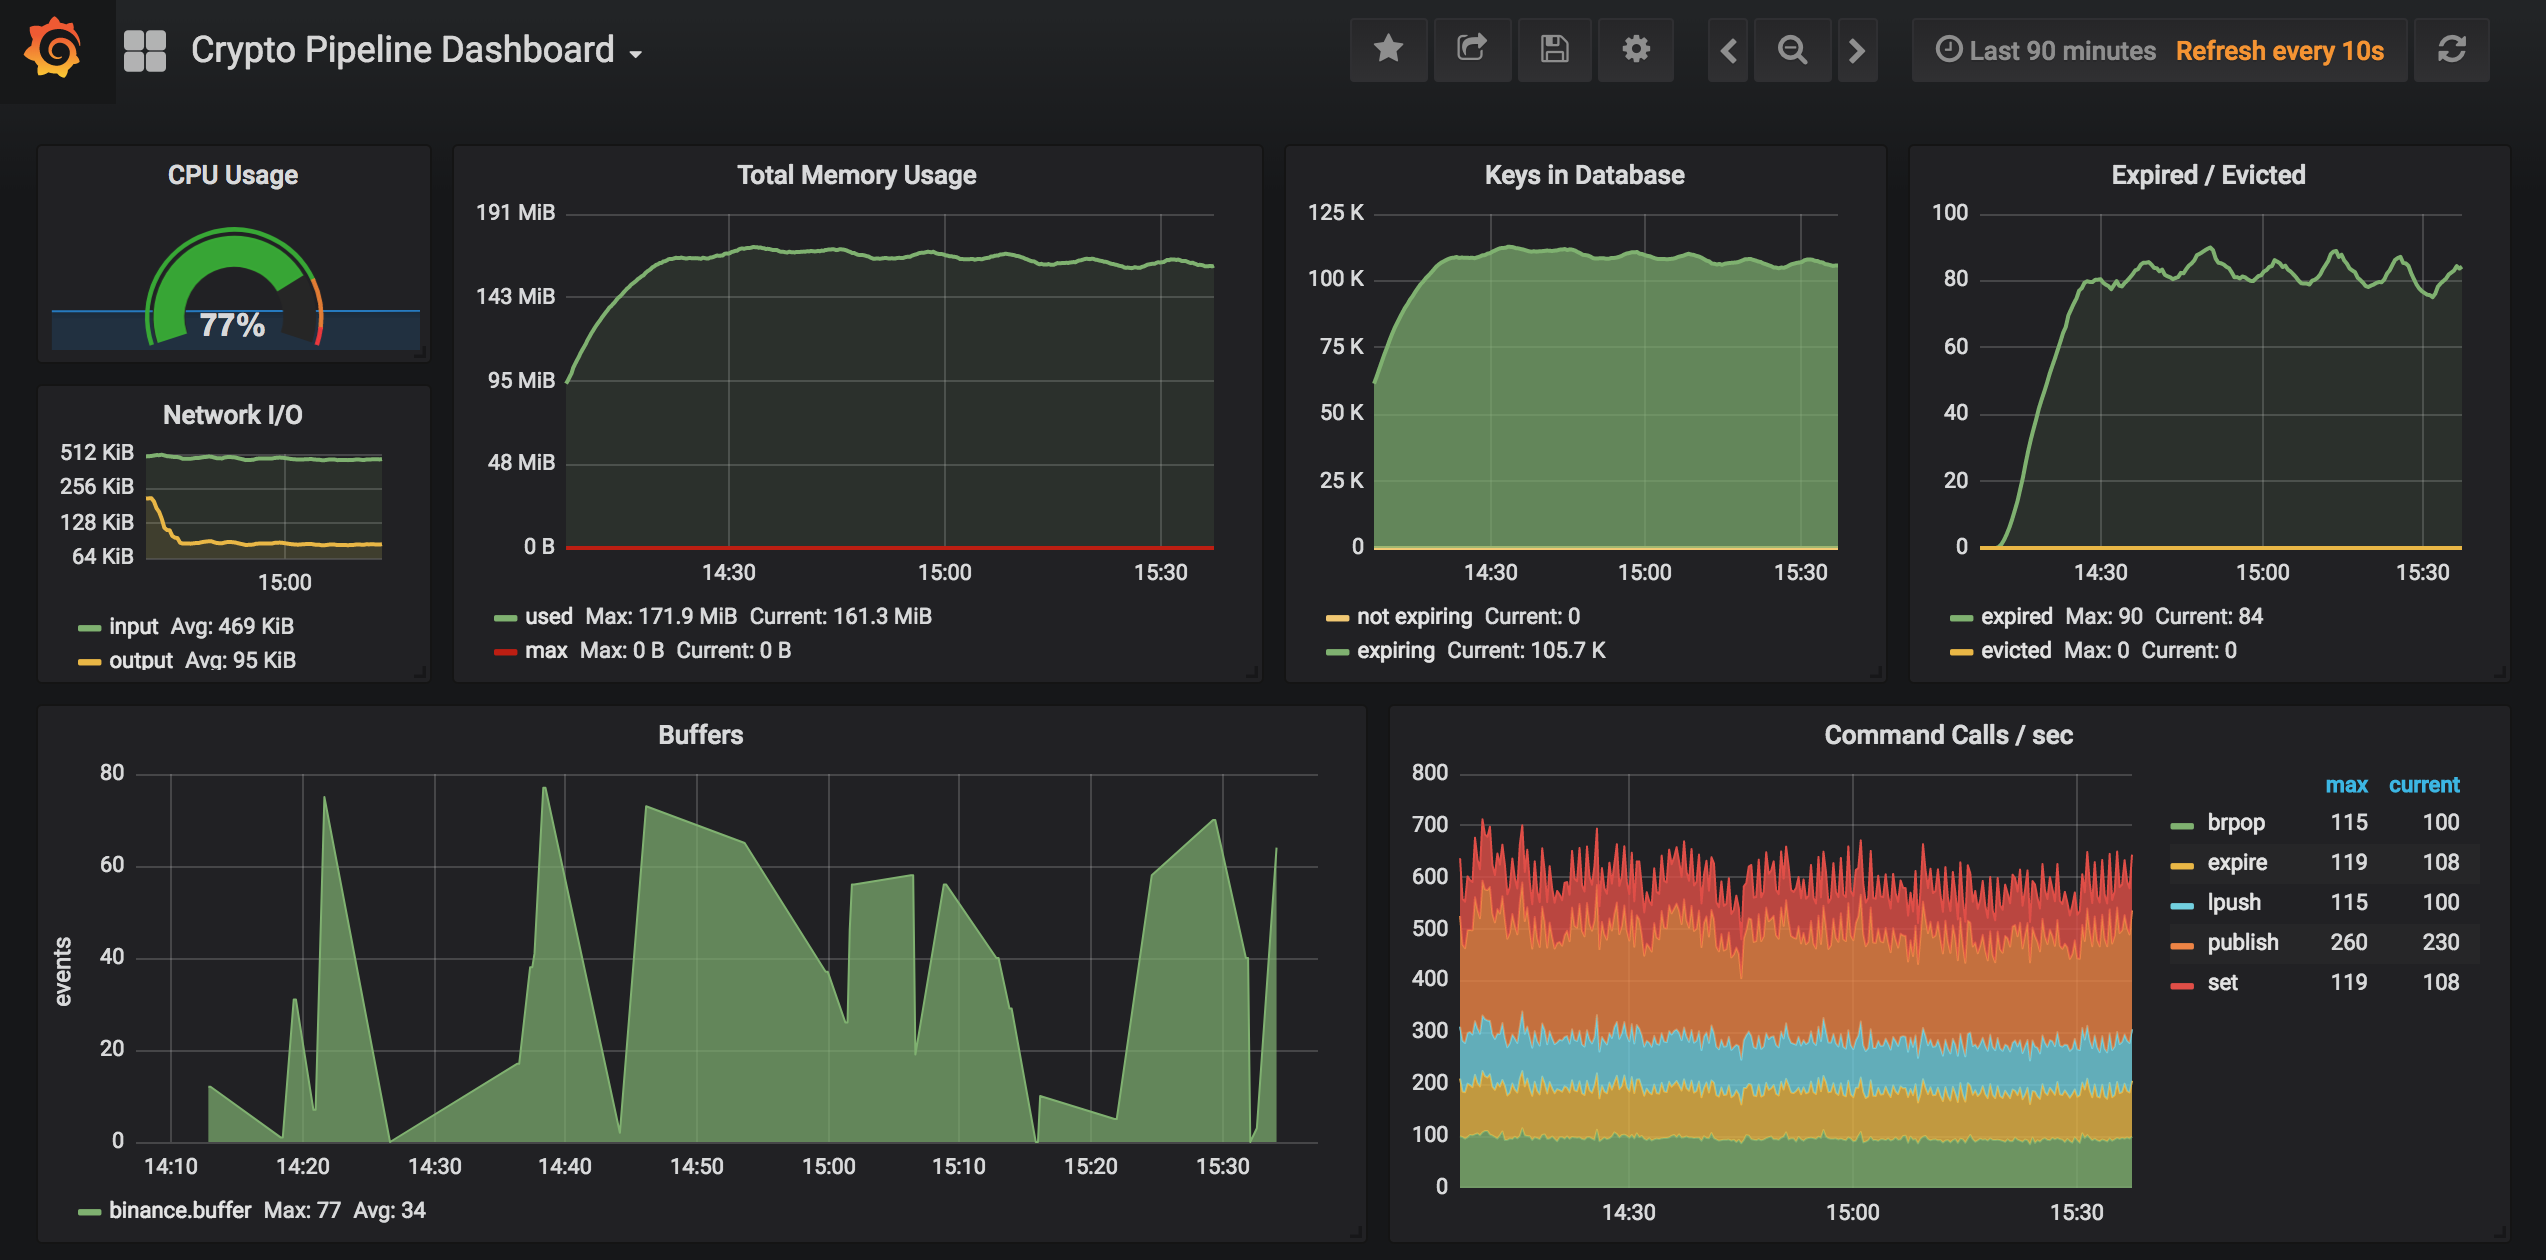
A dashboard based on Grafana+Prometheus is provided out of the box. If running with docker-compose, it should be available at port 3000 by default.
We are using redis_exporter which fetches metrics from Redis and injects them into Prometheus, which in turn is used by Grafana as the data feed for rendering the charts.
The dashboard is preconfigured in the grafana/etc directory.
Self-explained.
How much memory is being consumed by Redis. Typically you want to see a pattern where memory usage grows and then it steadily flattens when expiration of keys becomes effective. It will, though, keep growing slowly due to minute-aggregation data that typically has a much larger lifespan.
The number of keys stored in Redis. This is expected to grow fast at the beginning and then slow down until look almost flat.
Number of keys expired or evicted. Keys expire according to the configured expiration policy for 1-second and 1-minute aggregations. If memory usage is reaching a limit, Redis will start evicting keys following a LRU policy.
This metric is very important and shows the size of the buffers. When running the platform in high-end hardware, this should typically be zero flat, perhaps with very few random and short spikes. In a typical workstation this might be very random, especially if the OS is being used for running other apps as well.
If you see the buffers continuously grow, it may be an indication of one or two issues:
- there is a problem with the Spouts
- the platform is processing slower than it is ingesting
The first issue needs troubleshooting. The second one may be solved by scaling out the Spouts; check the pm2 configuration reference to increase the number of instances for Spout processes.
This shows the number of Redis commands being executed, disaggregated by command. This should always look steady.


