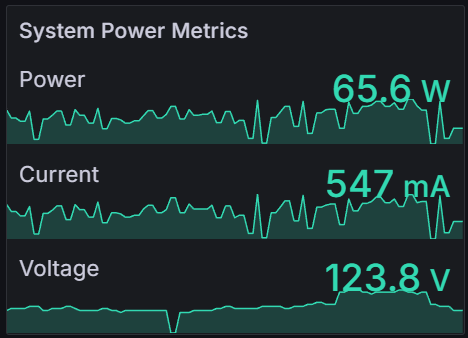
This script collects and exports key metrics from Tuya smart plugs to Prometheus. It tracks three important data points: power , current, and voltage. This allows you to monitor the performance of your smart plugs with ease.
-
Metrics Collection: Retrieves power, current, and voltage data from Tuya smart plugs.
-
Prometheus Integration: Provides metrics in a format compatible with Prometheus scraping.
-
Simple Configuration: Easy to set up with minimal configuration required.
-
Low CPU Usage: Designed to be efficient and have a minimal impact on system resources.
-
Device Configuration:
Update the
DEVICE_CONFIGSlist with your device details:# Device Configuration "ip": "DEVICE_LOCAL_IP", "device_id": "DEVICE_ID", "local_key": "LOCAL_KEY"
If you are unsure how to obtain these following details, refer to this tutorial
DEVICE_IP: Local IP address of your Tuya smart plug.DEVICE_ID: Unique identifier for your Tuya device.LOCAL_KEY: Authentication key for your Tuya device.
-
Exporter Port (Optional):
Set the port for the Prometheus exporter in the script:
EXPORTER_PORT = 9999
-
Install Dependencies:
Install the required Python packages:
pip install click tinytuya prometheus_client
-
Run the Script:
Launch the script to start the Prometheus exporter:
python tuya_exporter.py
-
Access Metrics:
After running the script, you can access the metrics at:
http://localhost:9999/metrics
-
Automatic Version Detection: The script automatically tries different versions of the Tuya protocol to ensure connectivity. Manual adjustment is not needed for the version.
-
Configuration: Ensure that device IPs, IDs, and local keys are correctly configured. You can verify these settings in the configuration section of the script.
This project is licensed under the Apache License 2.0 - see the LICENSE file for details.
