We are a team of mathematicians, statisticians, and ecologists, conducting a multi-year research project to develop an operational forecasting system for streamflow and water quality on the Upper Yellowstone River (UYR) and its tributaries. Our system will be based on SWAT+/gflow, a hybrid of the SWAT+ (Soil-Water-Assessment Tool) model for surface water dynamics, and gflow, physically-based groundwater flow module developed by Ryan Bailey to replace the current SWAT+ aquifer module.
The UYRW_data repository is a staging area for R code that can be used to fetch data on the hydrology of UYR. This repository will be active during the early stages of our project (August-November 2020), as we assemble datasets and build documentation for the model. The following scripts download the data:
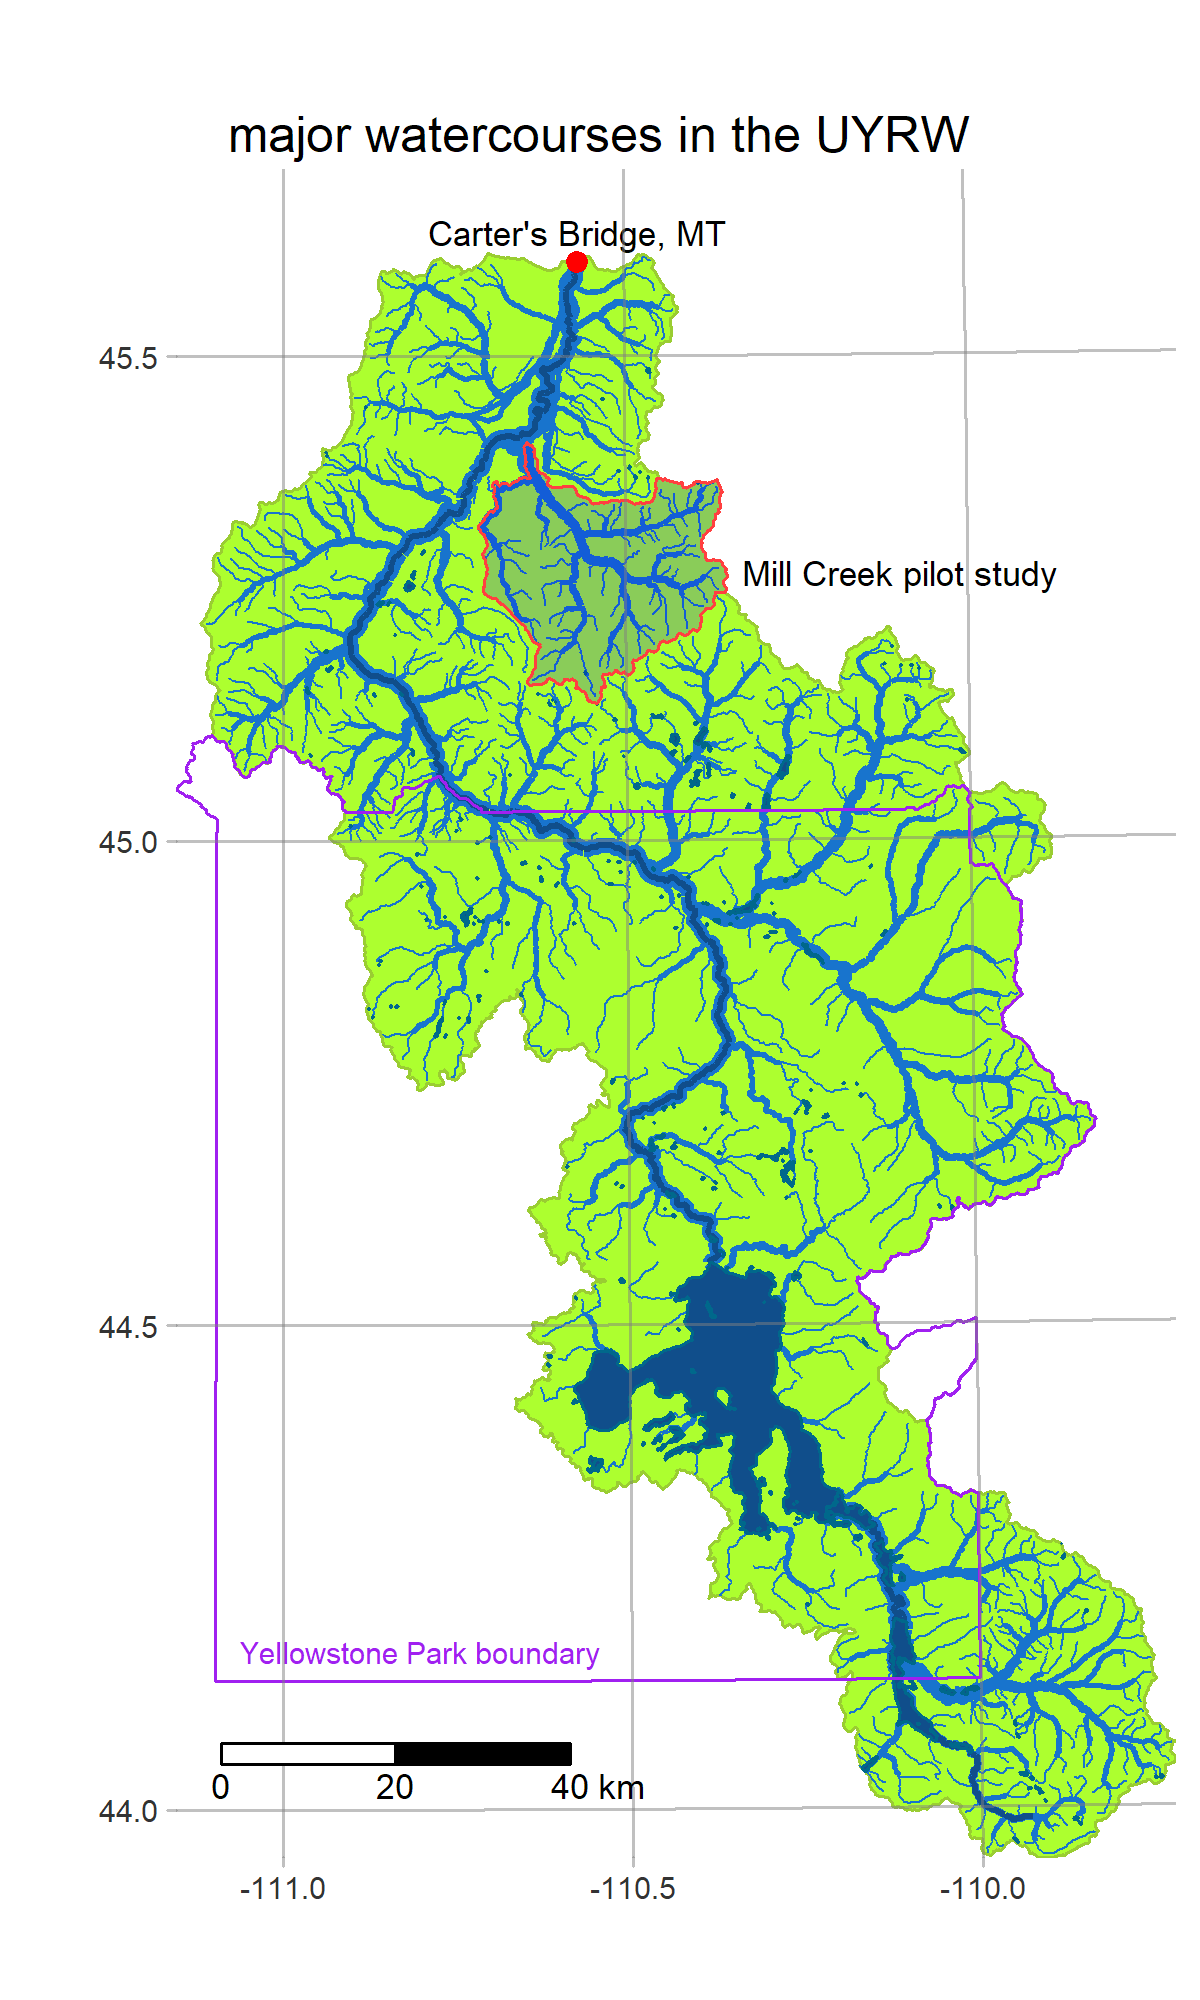
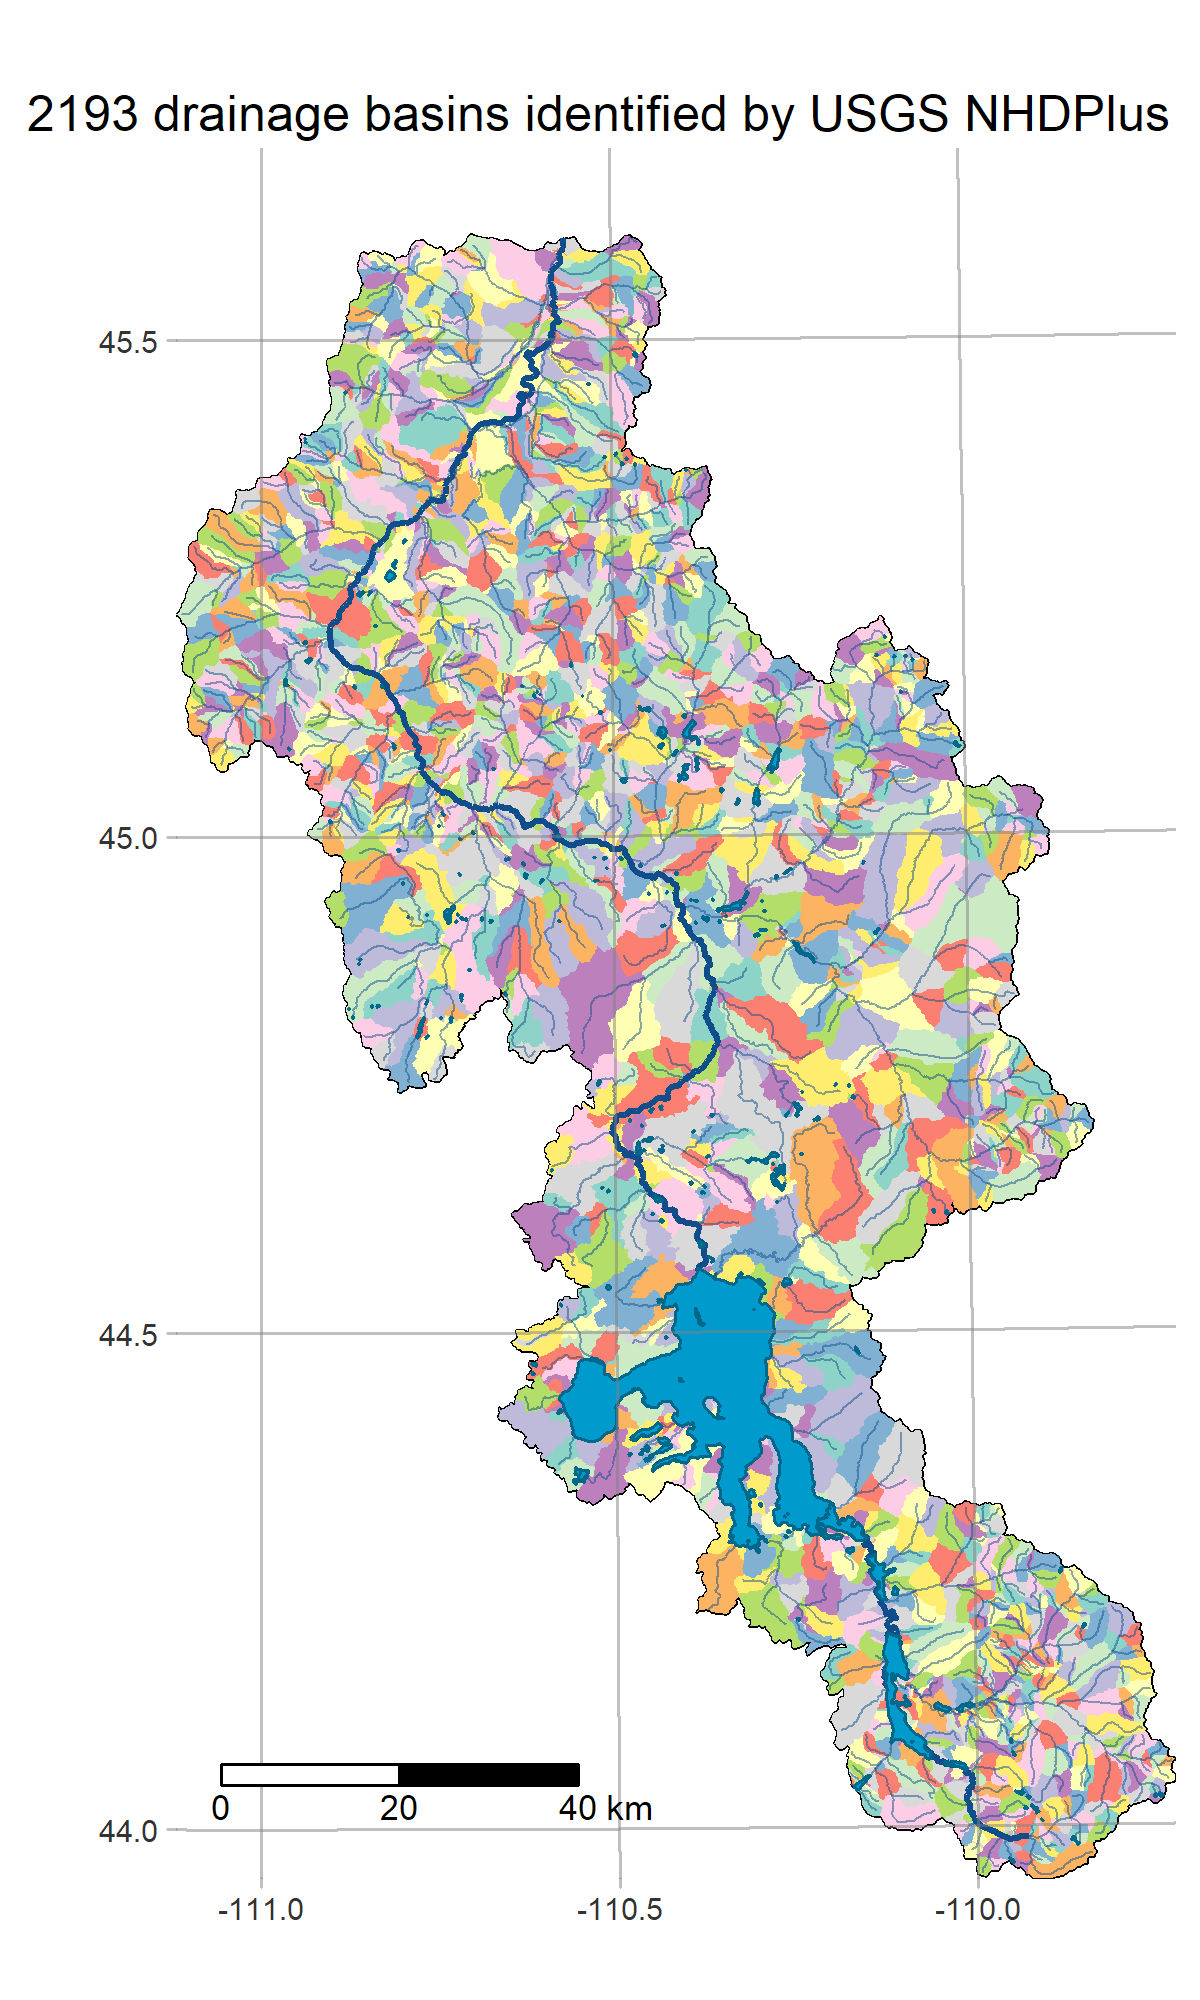
- get_basins
defines the study area and loads some hydrology info using
nhdplusTools - get_weatherstations
finds climatic sensor station data using
snotelrandrnoaa - get_dem
fetches the National Elevation Dataset from USGS using
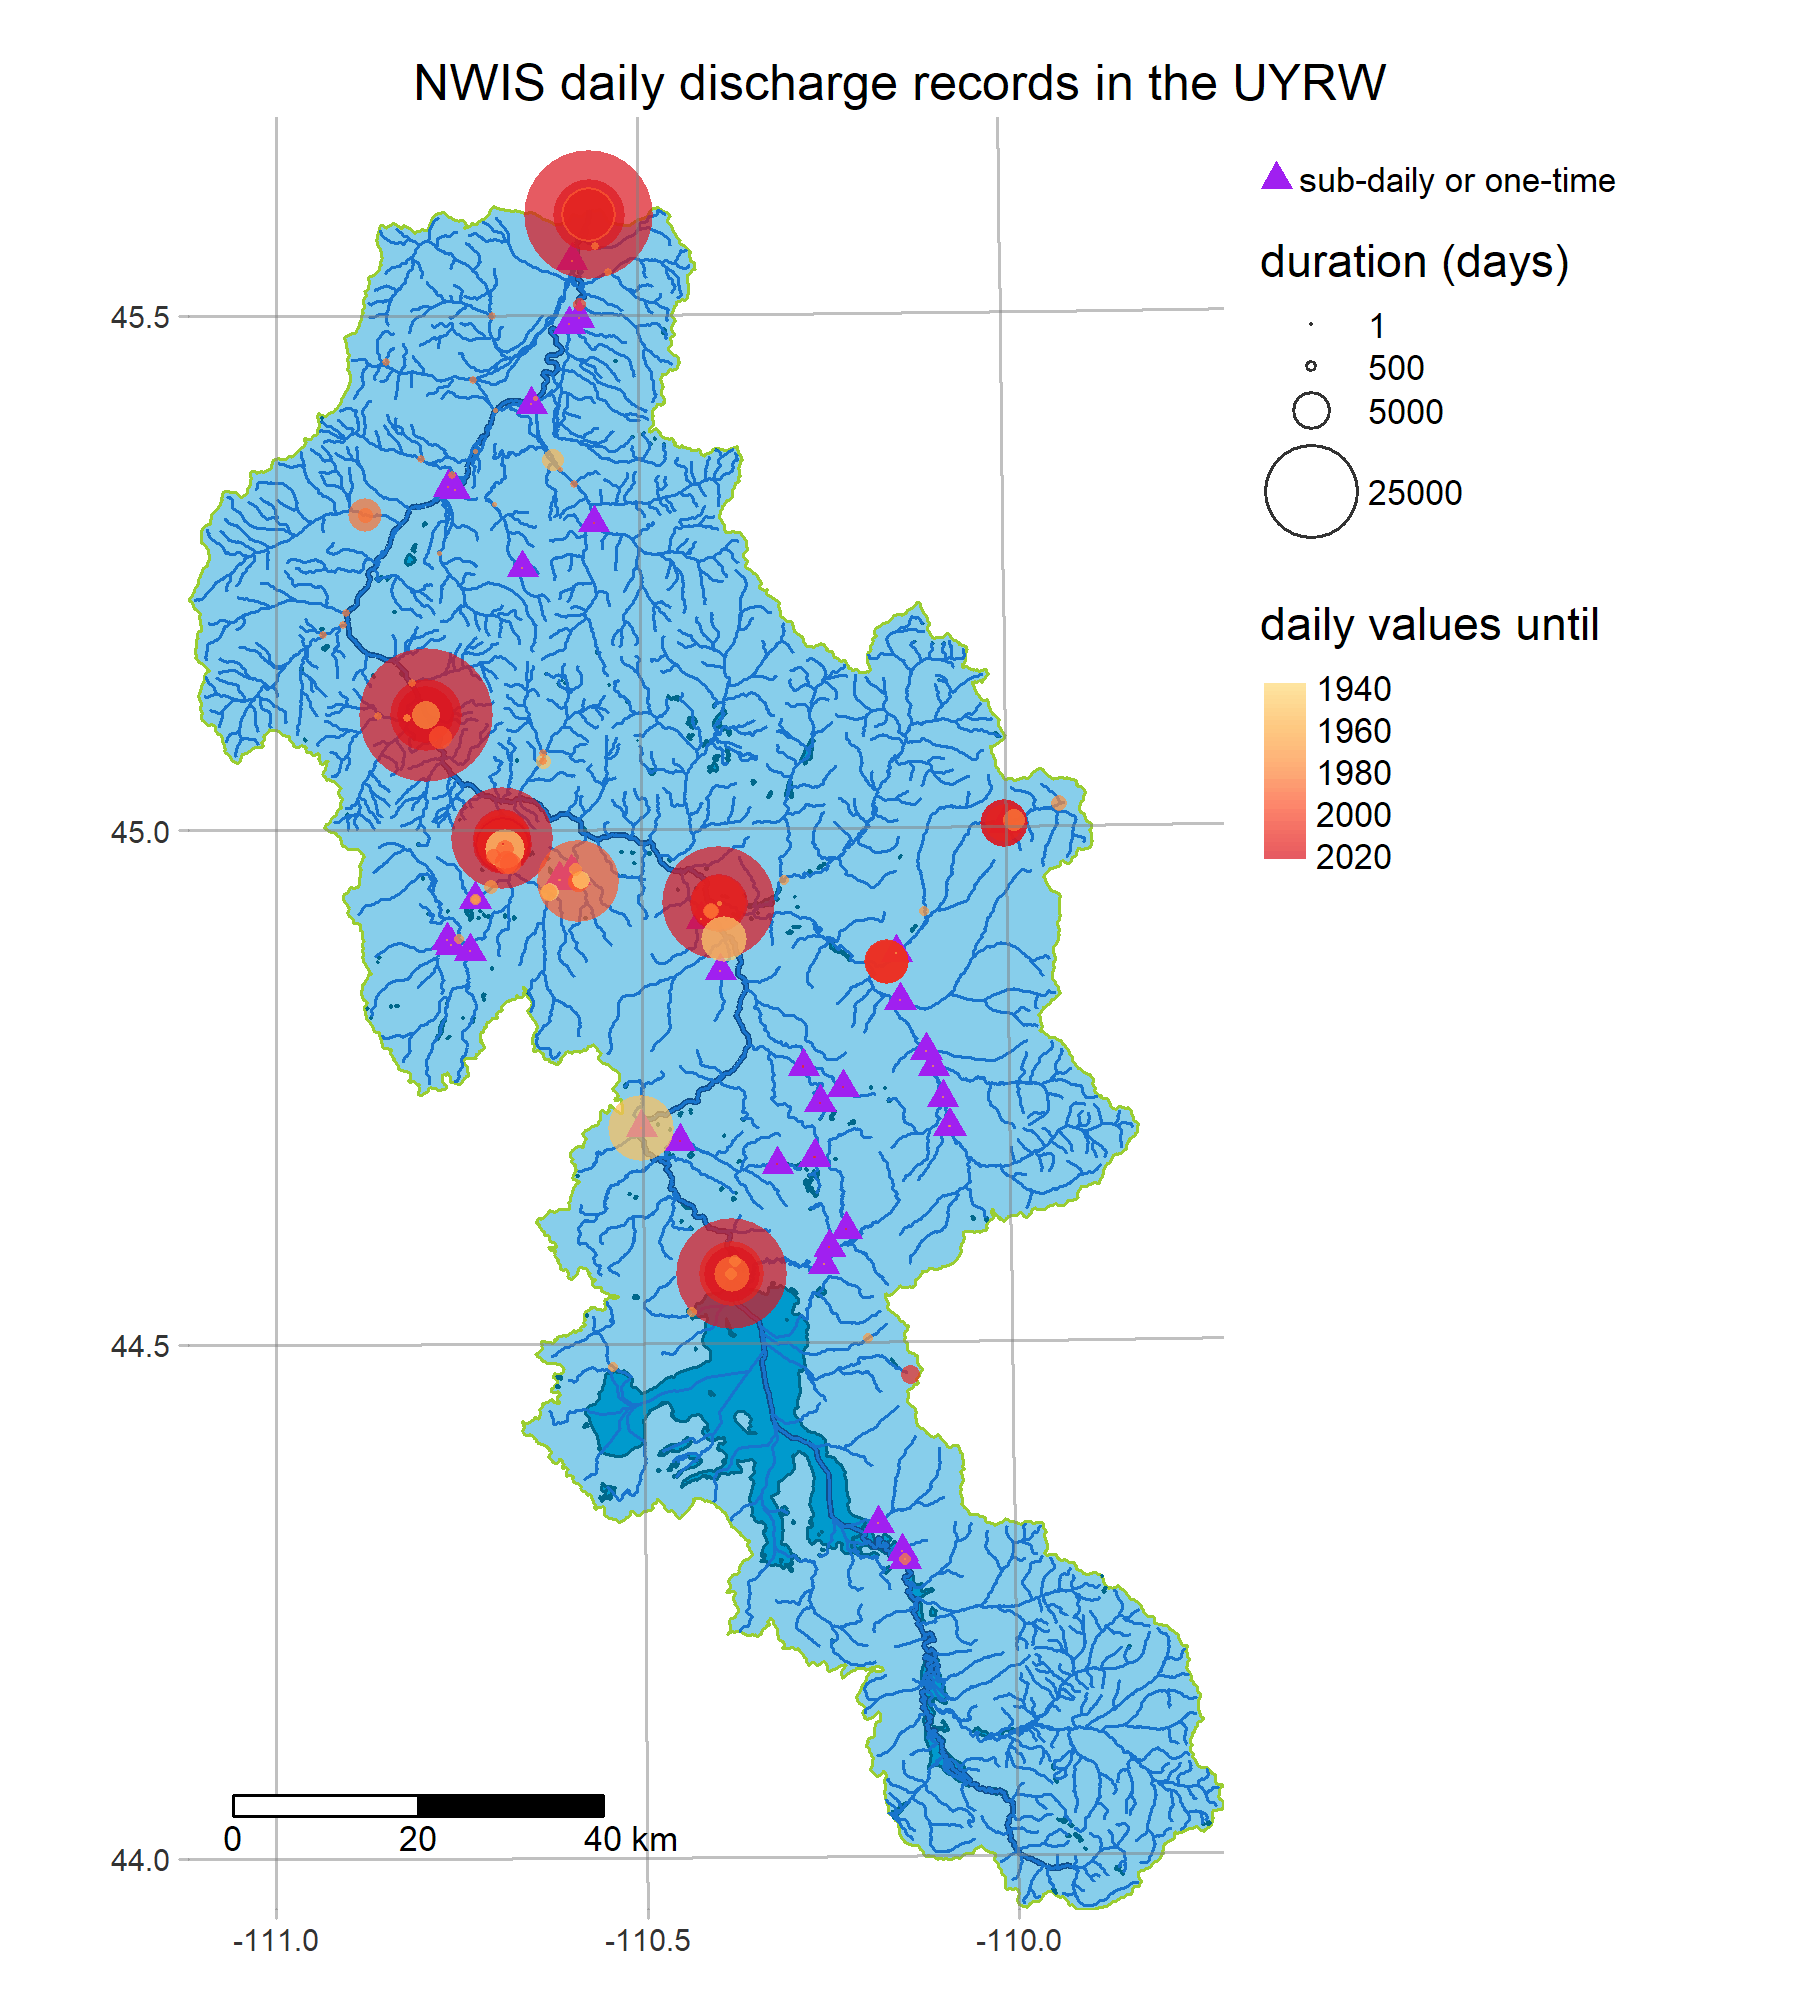
FedData - get_streamgages
fetches sensor data from the USGS NWIS using
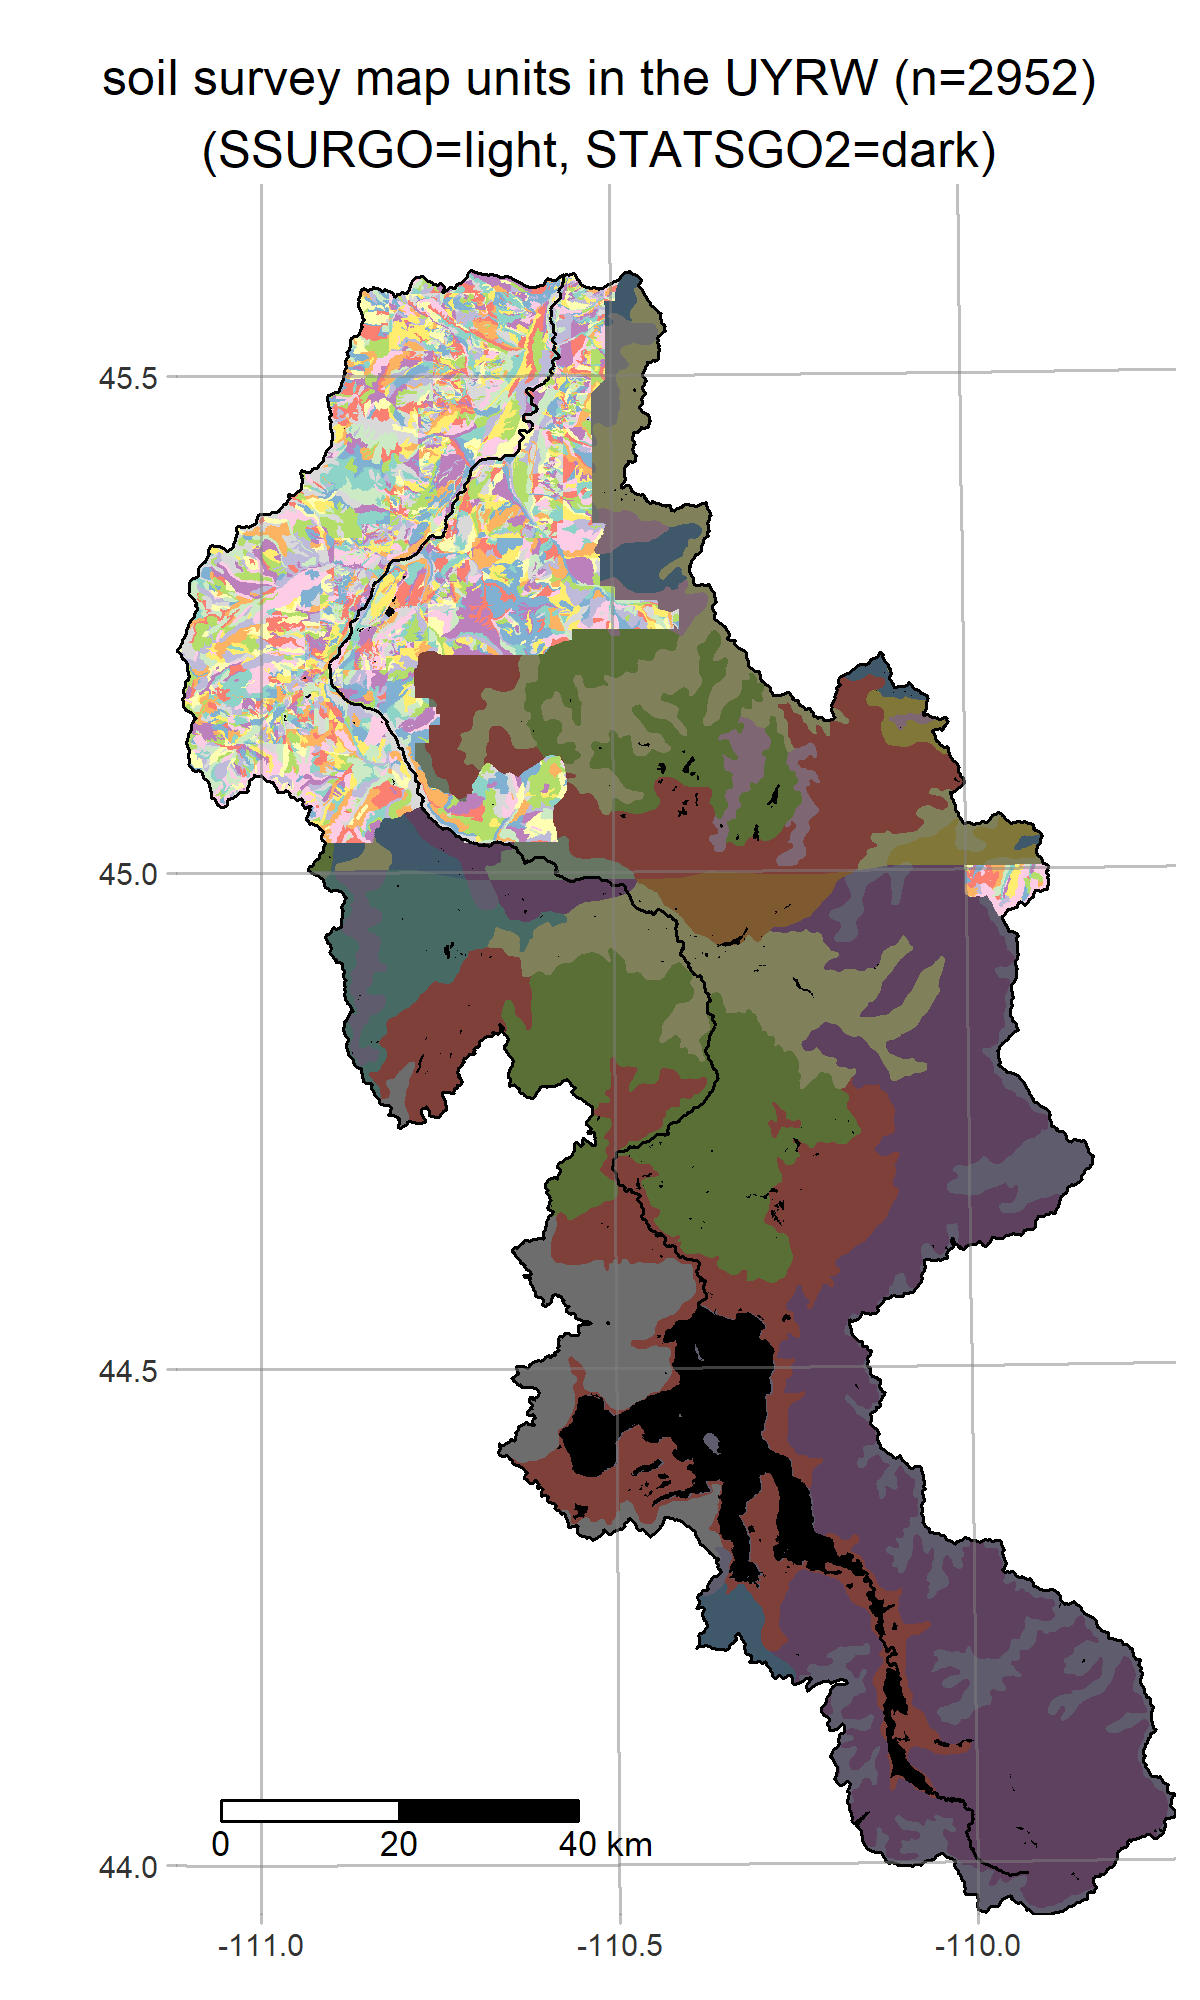
dataRetrieval - get_soils
fetches SSURGO/STATSGO2 data from the Soil Data Mart using
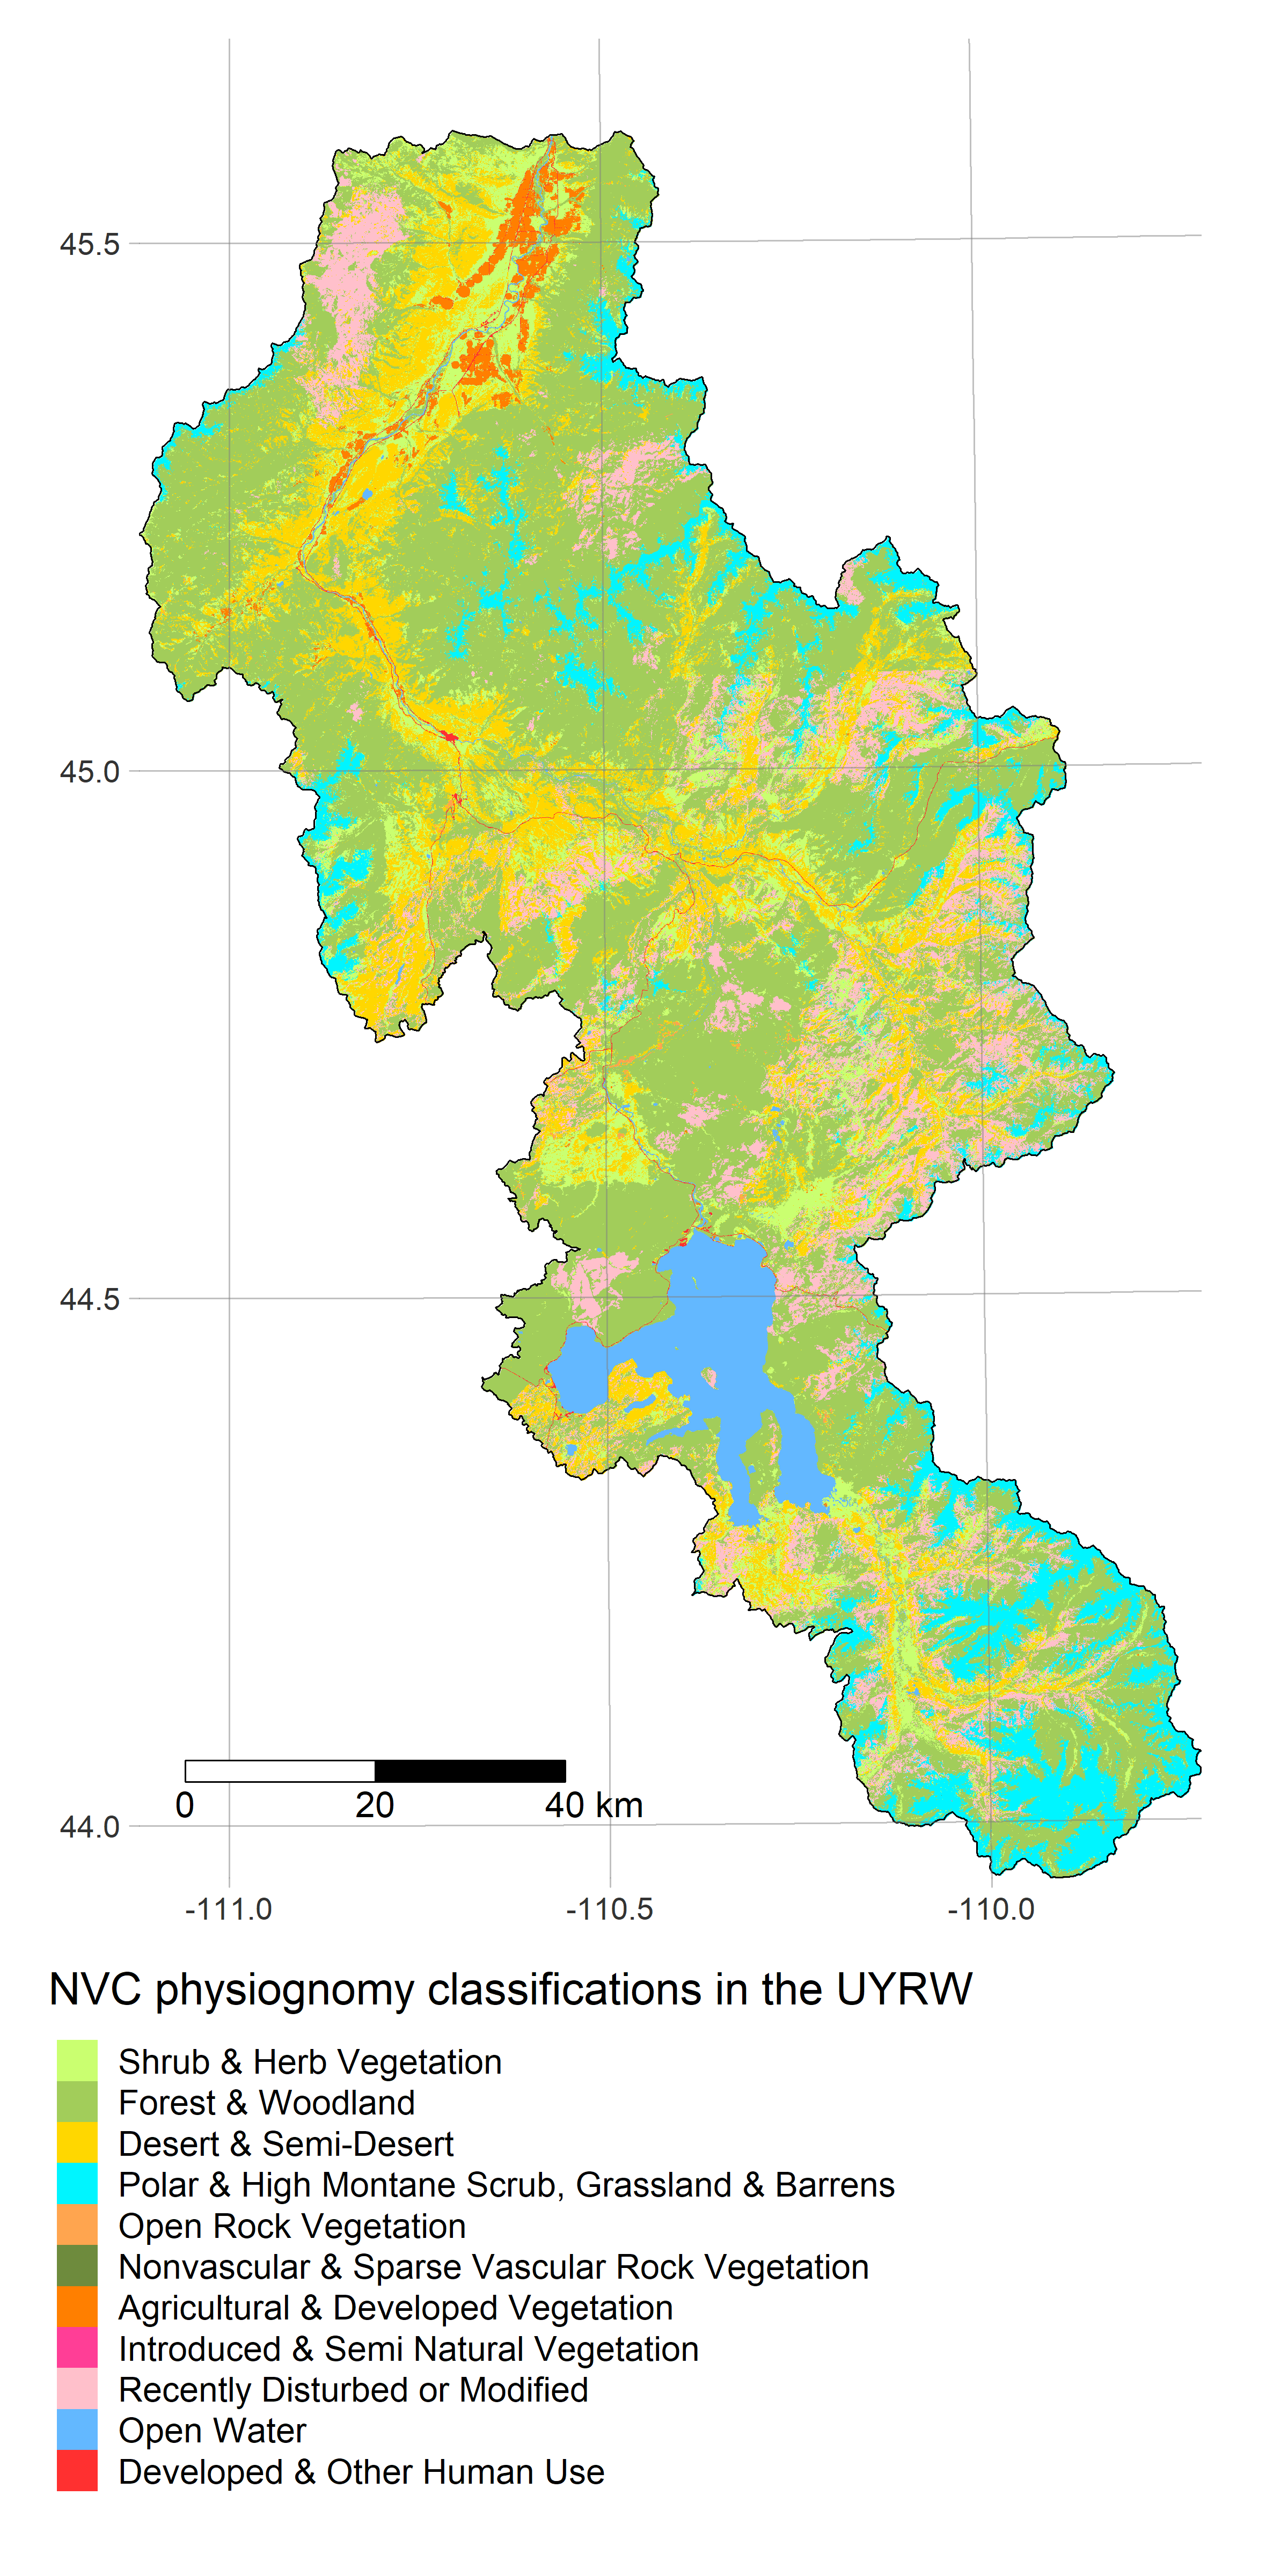
FedData - get_landuse fetches GAP/LANDFIRE data from the USGS ScienceBase catalogue
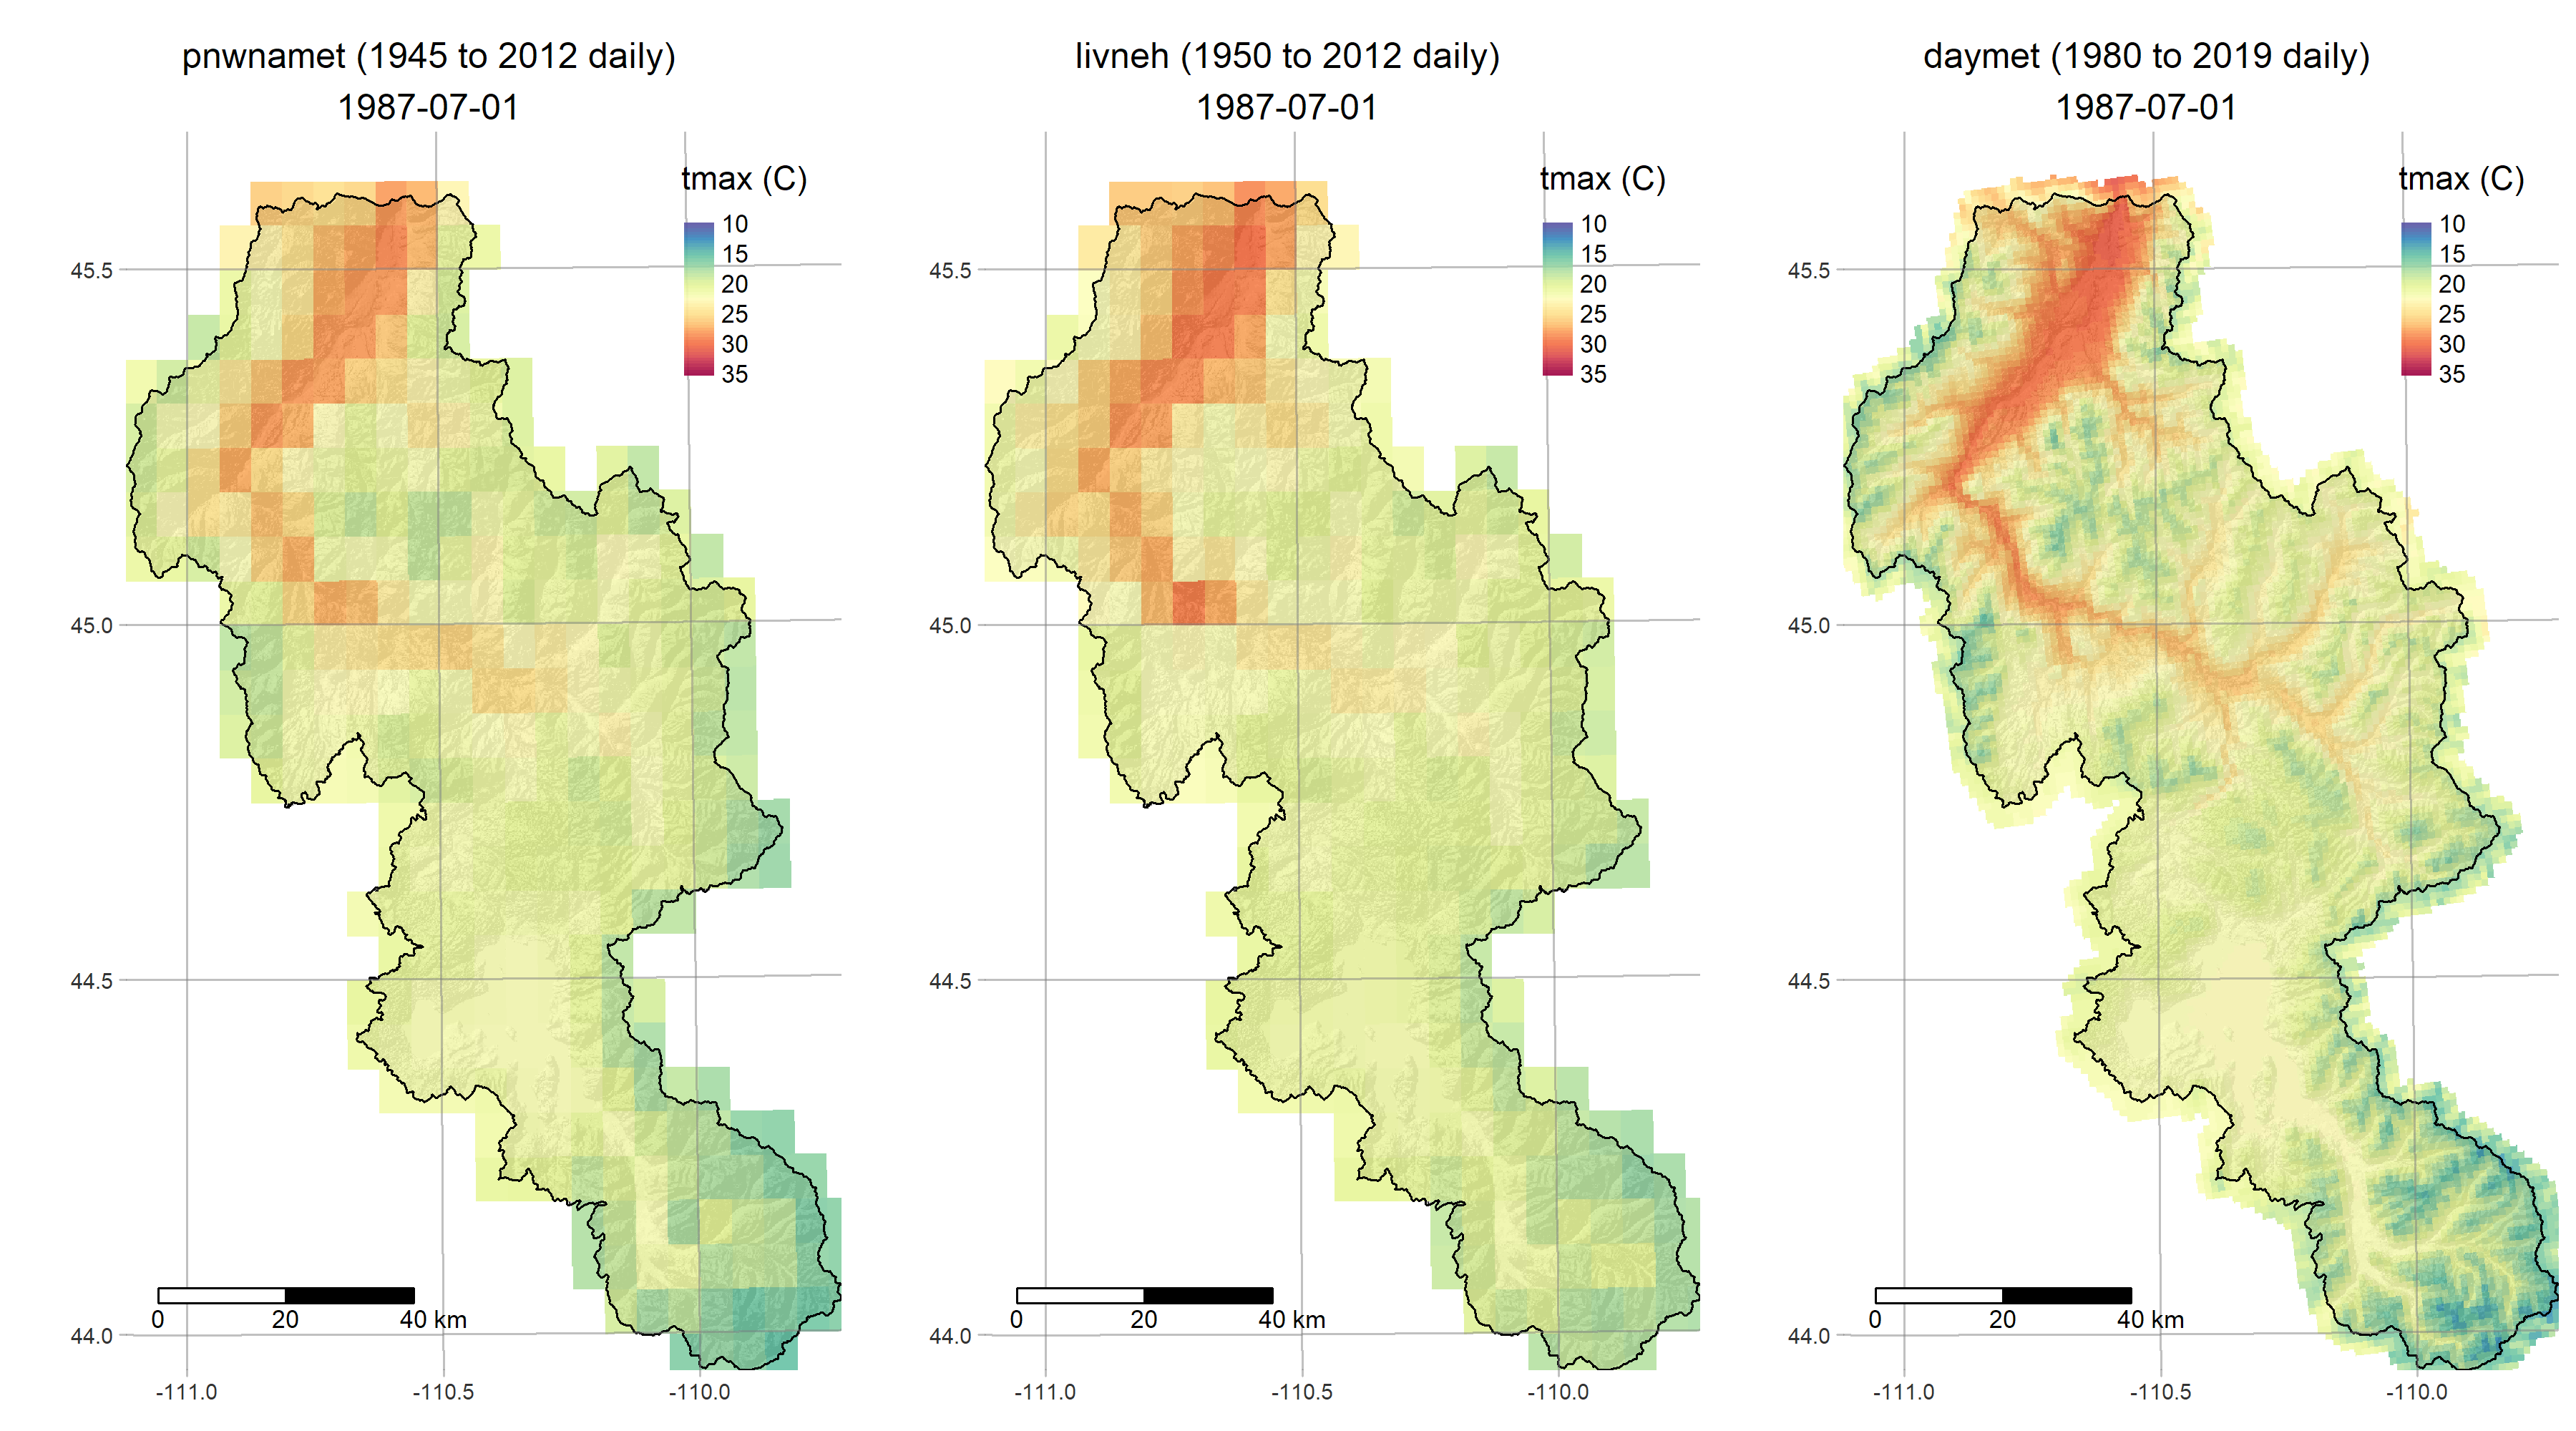
- get_meteo fetches three different gridded meteorological reconstructions of Northwestern North America
This script does some intermediate steps required to successfully load the data into QSWAT+3 and build a watershed model:
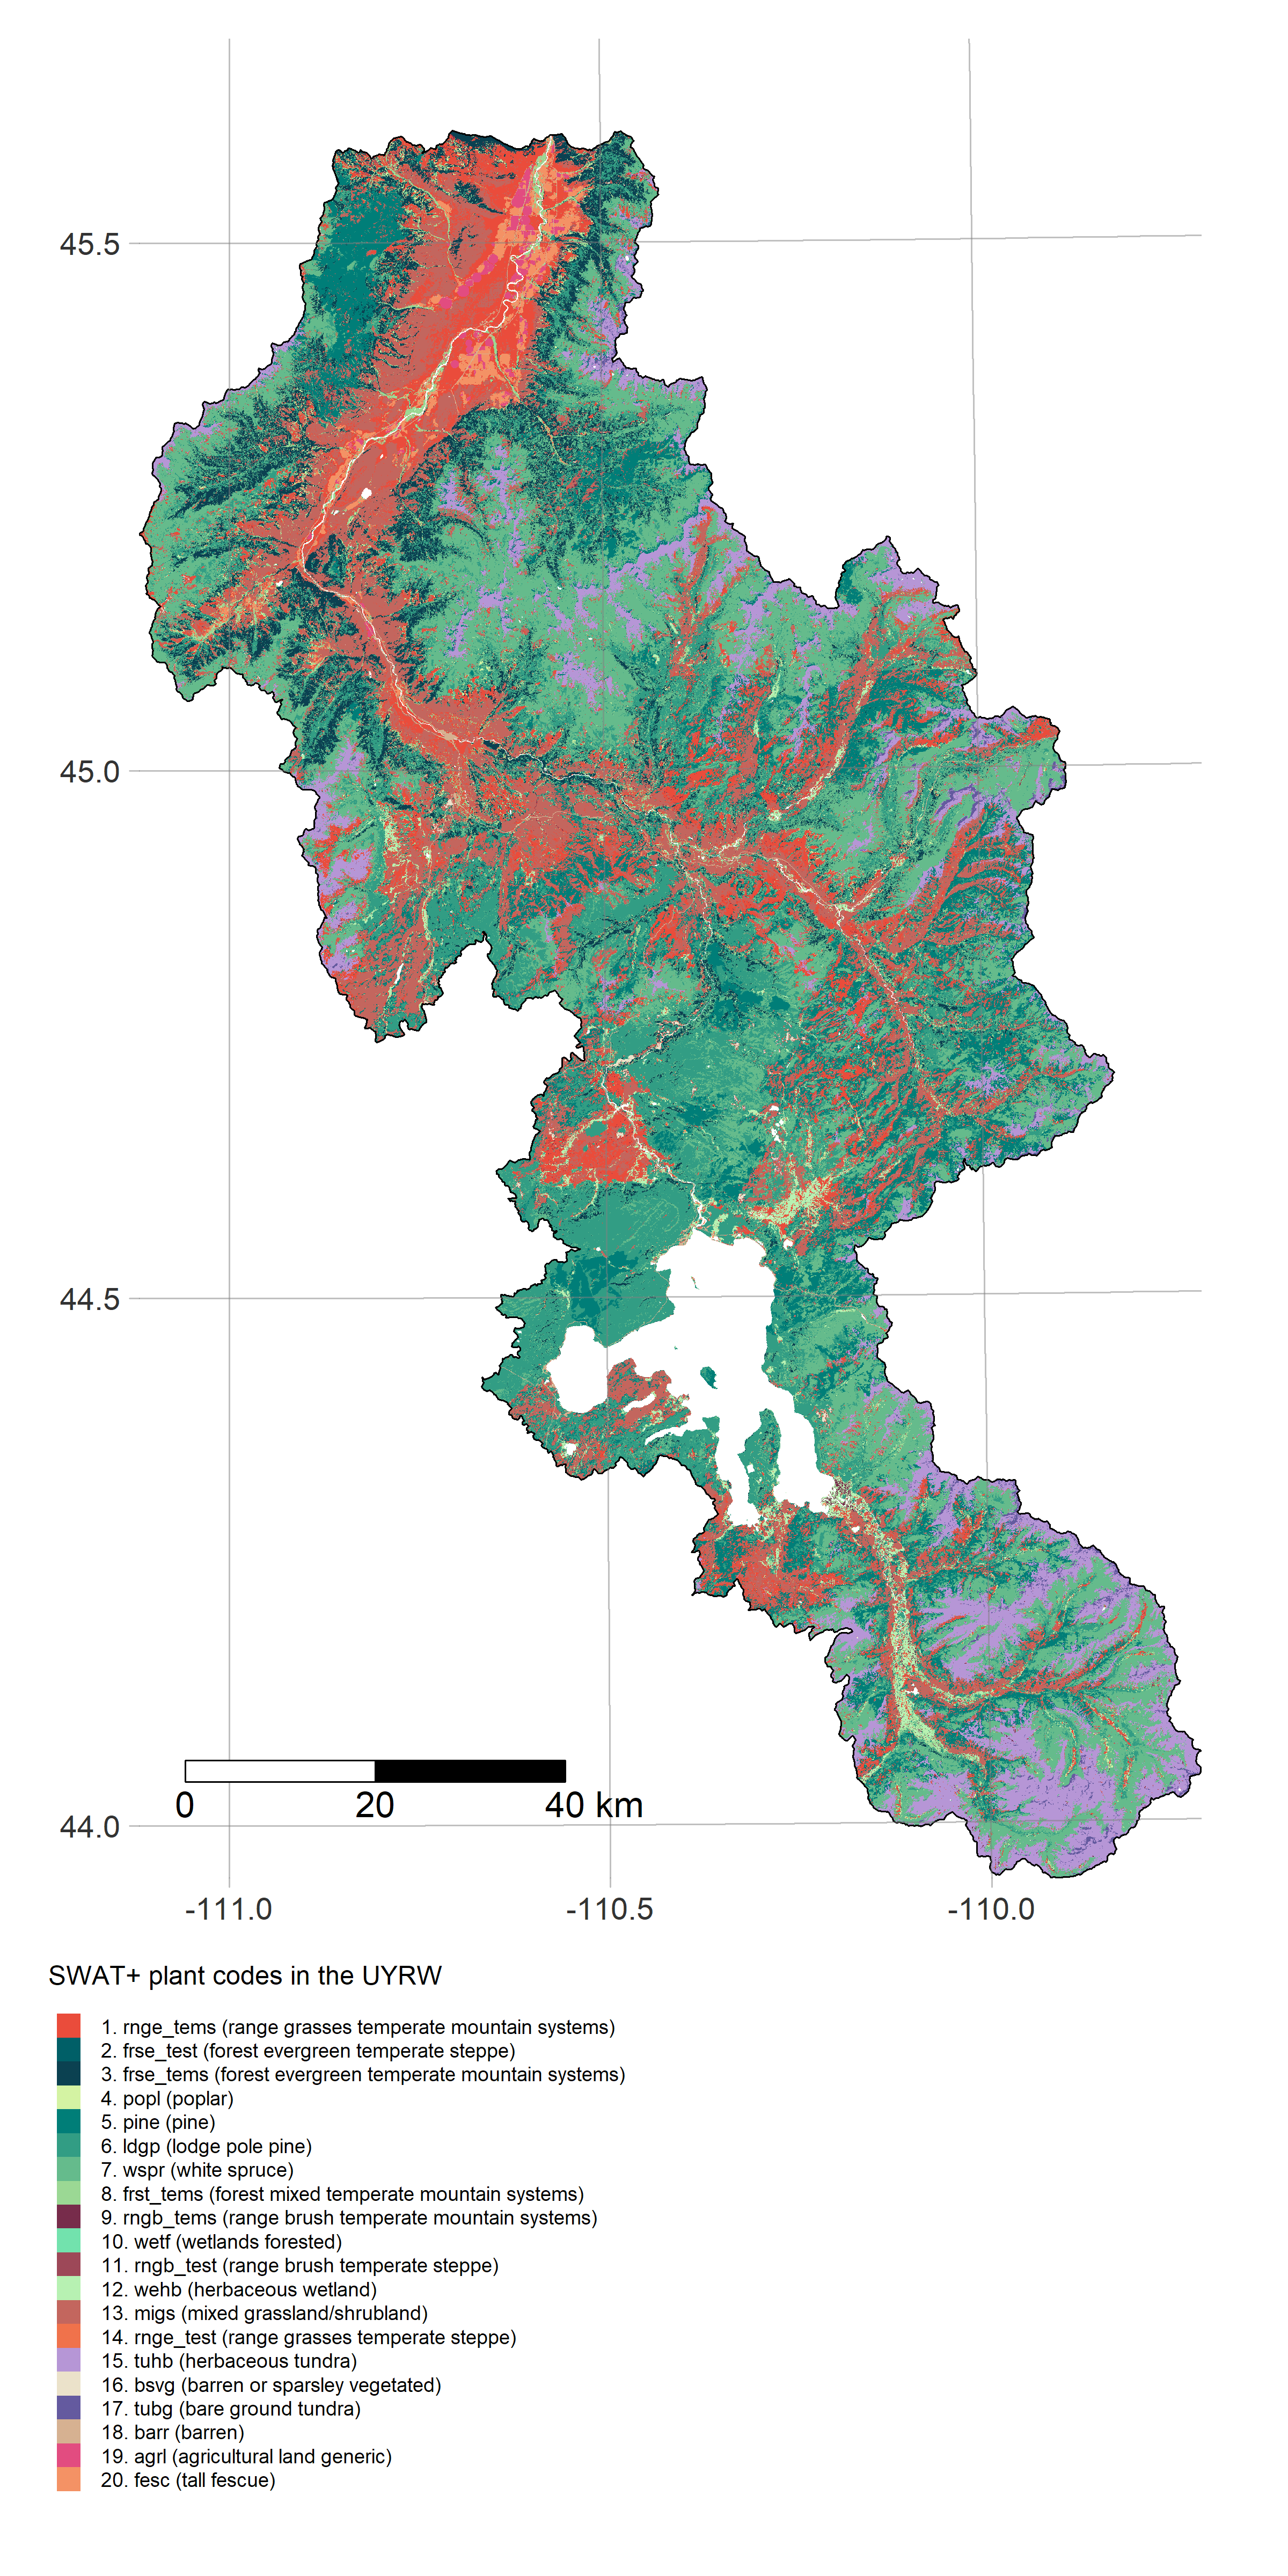
- make_qswatplus prepares QSWAT+3 inputs
After running the above, the user can load the prepared raster and geometry data files into QSWAT+ (a plugin for QGIS), and construct a SWAT+ model from there. Alternatively, SWAT+ model construction can be done automatically (and much more quickly) via PyQGIS scripts, such as those provided in the SWAT+ Automatic Workflow (AW) by Celray James. An example that is customized for the UYRW_data project is linked below:
- run_qswatplus (standalone) PyQGIS script for creating a SWAT+ model
We may open a new repository for this kind of python code, including parameter calibration scripts androutines for splitting large watersheds into smaller ones that can be calibrated sequentially. Check back for more scripts and figures as we add to this list in the coming weeks.
Our R data analysis workflow is structured around git and markdown. Our scripts (*.R) are documented as dynamic reports -- markdown files of the form *.knit.md. These document our code and methods in human-readable detail, with console output and figures incorporated automatically using rmarkdown using roxygen2. See Jennifer Bryan's
Am Stat article and instructional pages for more on this.
Our work is funded through a MITACS Accelerate International grant to Dean Koch, partnering the University of Alberta with R2CS LLC in Montana, and the Yellowstone Ecological Research Center. The project began on August 3, 2020.
R is a powerful data-retrieval, GIS, and visualization tool. These figures are generated by the scripts in our repo using the tmap package: