Graphtool
This software is a tool for dealing with graphs, written in Common Lisp. It describes ways to declare graphs, hold them in memory and write them on screen with a semi-mathematical notation.
It also has a few graph-related operations built in it, mostly due to the fact that I made this tool when I was studying graphs on college.
There is also a tool which emits Graphviz code, and one can even produce and show graphs onscreen if needed.
Requirements
This project is mostly independent from external tools, unless you want to use the graphical visualization of graphs. In that case, you’ll need:
- SBCL (preferably 1.5.9 and up);
- Graphviz (tested with 2.40.1);
- Feh (tested with 3.3).
SBCL is needed for calling foreign programs from command line. Graphviz is used to generate PNG files from DOT. Finally, Feh is used to display images on screen.
Apart from SBCL, the binaries /usr/bin/dot and /usr/bin/feh are
assumed to be in their described places. These places (and even the
binaries themselves) can be changed in the source code.
The tool also assumes that a temporary directory /tmp/ is writable.
Usage
As stated before, this tool serves some purposes for dealing with graphs.
Before using it, you need to load the source file in SBCL, then enter
the :graphtool package, since this package exports no symbols (due to
my laziness):
(load "graph.lisp")
(in-package :graphtool)
Below are some examples on what you can do then.
Declaring graphs
One can declare an undirected graph by using the MAKE-GRAPH function,
which generates a certain graph instance:
(make-graph vertices edges)where VERTICES is a list symbols for each vertex in the graph, and
EDGES is a list of edges.
Each informed edge is a triplet, containing an origin vertex, a destination vertex, and its distance.
Since we’re creating an undirected graph, all we need to do is declare each edge as one-way, and the graph will duplicate its reciprocal.
(defparameter *my-graph*
  (make-graph '(a b c d e f g h i)
              '((a b 4)
                (a h 8)
                (b c 8)
                (b h 11)
                (c d 7)
                (c f 4)
                (c i 2)
                (d e 9)
                (d f 14)
                (e f 10)
                (f g 2)
                (g h 1)
                (g i 6)
                (h i 7))))
#+RESULTS[c9439687a61749fd74c7c91e61aa9036e6d5ed9a]:
*MY-GRAPH*
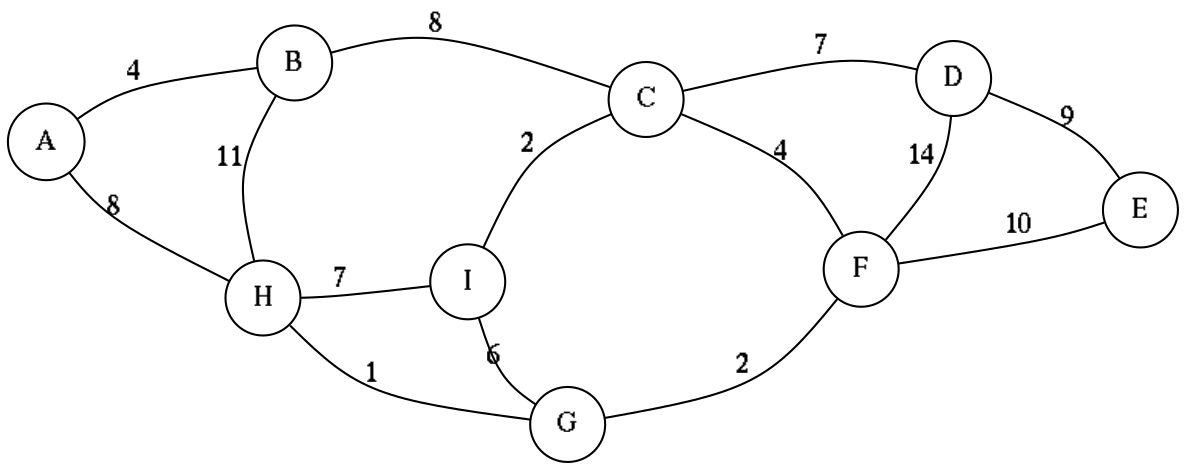
Printing the graph itself yields textual information resembling mathematical notation. Notice that, when printing undirected graphs, the reciprocal edges are also shown.
*my-graph*#+RESULTS[cde7e453aafb7e4baf649e593957343528867367]:
#<graph G = (V, E) where
    V = (A B C D E F G H I)
    E =
      (A B) [dist=4]
      (A H) [dist=8]
      (B C) [dist=8]
      (B H) [dist=11]
      (C D) [dist=7]
      (C F) [dist=4]
      (C I) [dist=2]
      (D E) [dist=9]
      (D F) [dist=14]
      (E F) [dist=10]
      (F G) [dist=2]
      (G H) [dist=1]
      (G I) [dist=6]
      (H I) [dist=7]
      (B A) [dist=4]
      (H A) [dist=8]
      (C B) [dist=8]
      (H B) [dist=11]
      (D C) [dist=7]
      (F C) [dist=4]
      (I C) [dist=2]
      (E D) [dist=9]
      (F D) [dist=14]
      (F E) [dist=10]
      (G F) [dist=2]
      (H G) [dist=1]
      (I G) [dist=6]
      (I H) [dist=7]>
Declaring directed graphs
By using the same MAKE-GRAPH function, one can easily declare a
directed graph:
(make-graph vertices edges &optional digraph-p)Declaring a directed graph is only a matter of setting the optional
variable DIGRAPH-P to T:
(defparameter *my-digraph*
  (make-graph '(a b c d e f g h)
              '((a b 4)
                (a d 2)
                (a e 7)
                (b e 2)
                (c e 4)
                (d g 1)
                (d h 4)
                (e f 2)
                (f c 1)
                (g h 2)
                (h f 1))
              t))

*my-digraph*
#+RESULTS[4bc167105a3adbb770b987dcedc06e2d1c4df944]:
#<digraph G = (V, E) where
    V = (A B C D E F G H)
    E =
      (A B) [dist=4]
      (A D) [dist=2]
      (A E) [dist=7]
      (B E) [dist=2]
      (C E) [dist=4]
      (D G) [dist=1]
      (D H) [dist=4]
      (E F) [dist=2]
      (F C) [dist=1]
      (G H) [dist=2]
      (H F) [dist=1]>
Shortest distance between points
To calculate the shortest distance between two vertices in a given graph, use
(shortest-path graph from to)where GRAPH is any given graph object, FROM is the symbol for the
initial vertex, and TO is the symbol for the destination vertex.
This function implements Dijkstra’s algorithm for shortest path, and returns three values: a list of vertices representing the shortest path, the total accumulated distance given the weights of edges, and finally a list of accumulated minimum distances for all nodes, generated while executing the algorithm.
Below we show only the first of its return values. To obtain the
others, consider using MULTIPLE-VALUE-BIND or a similar form.
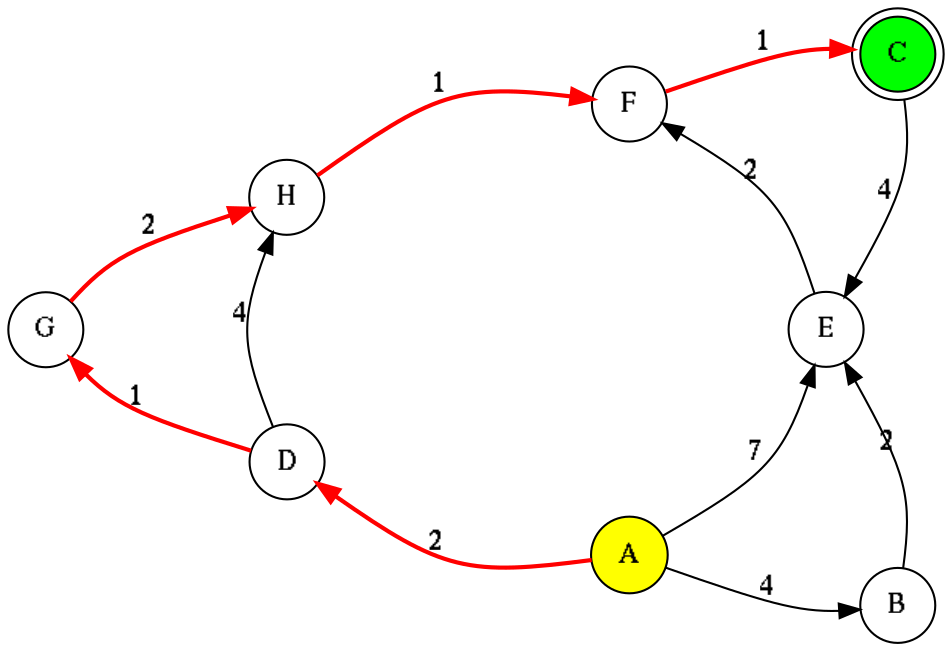
(shortest-path *my-digraph* 'a 'c)#+RESULTS[53a6588da811f6d07a1ad5505d17dc8589feaa8e]:
| A | D | G | H | F | C |
Minimum spanning tree (Kruskal’s Algorithm)
To generate the minimum spanning tree for a graph, used
(mst-kruskal graph)where GRAPH is any given undirected graph object – this algorithm is
not appropriate for digraphs.
This function returns two values: one is a new graph object, which describes the tree itself (trees are a special graph case). The other value is a list of nonrepeating vertices, useful for drawing the MST path later.
Below we show the full output of the MST for our previously defined graph.
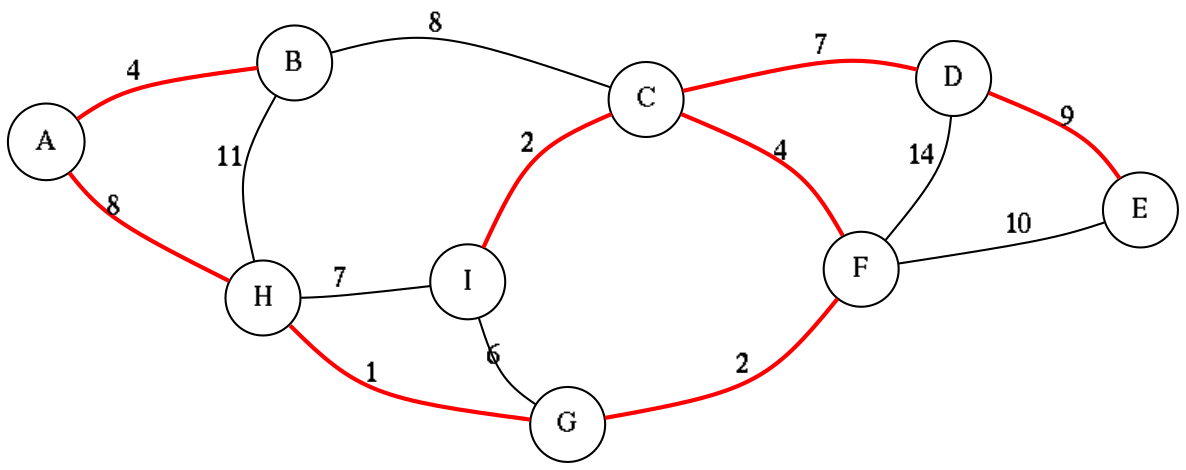
(mst-kruskal *my-graph*)#+RESULTS[d31c4529b5ce04bdb06245afa3b99c0a2ed19e08]:
#<graph G = (V, E) where
    V = (A B C D E F G H I)
    E =
      (D E) [dist=9]
      (A H) [dist=8]
      (C D) [dist=7]
      (C F) [dist=4]
      (A B) [dist=4]
      (F G) [dist=2]
      (C I) [dist=2]
      (G H) [dist=1]
      (E D) [dist=9]
      (H A) [dist=8]
      (D C) [dist=7]
      (F C) [dist=4]
      (B A) [dist=4]
      (G F) [dist=2]
      (I C) [dist=2]
      (H G) [dist=1]>

((D E) (A H) (C D) (C F) (A B) (F G) (C I) (G H))
Emitting Graphviz code
This tool also has a method which emits Graphviz code on standard output. One can repurpose the output of the method for showing the graph visually.
The method for this is
(emit-dot graph)where GRAPH is the related graph object.
Below is the example output for this operation on *MY-GRAPH*,
previously described.
(emit-dot *my-graph*)#+RESULTS[a70e5a051e878b1272a8a735ef10f1640a0613c4]:
graph G {
bgcolor="#00000000";
graph[nodesep="0.2", ranksep="0.0", splines="curved", dpi=150, fixedsize=true];
node[shape=circle, fillcolor=white, style=filled];
A -- B[label="4"];
A -- H[label="8"];
B -- C[label="8"];
B -- H[label="11"];
C -- D[label="7"];
C -- F[label="4"];
C -- I[label="2"];
D -- E[label="9"];
D -- F[label="14"];
E -- F[label="10"];
F -- G[label="2"];
G -- H[label="1"];
G -- I[label="6"];
H -- I[label="7"];
}
Highlighting a certain path
To visually highlight a certain path on the graph, one can use the same method
(emit-dot graph &optional highlight-path highlighting-edges)where the optional argument HIGHLIGHT-PATH must be a flat list of
symbols, each symbol representing a vertex, in such a way that the
list of symbols describes the path to be “walked” on the graph.
If you wish to print a path of non-consecutive edges, then you must
give HIGHLIGHT-PATH a list of pairs, where each pair is a list of two
vertices, and HIGHLIGHTING-EDGES must be set to true. This can be used
for drawing minimum spanning trees, for example.
It is very trivial to mix this method with a shortest path calculation, like this:
(emit-dot *my-graph*
          (shortest-path *my-graph* 'a 'f))
#+RESULTS[6d38e66a7ba5fd0faee9f51a6de9fce12d3b6e35]:
graph G {
bgcolor="#00000000";
graph[nodesep="0.2", ranksep="0.0", splines="curved", dpi=150, fixedsize=true];
node[shape=circle, fillcolor=white, style=filled];
A[fillcolor=yellow];
F[shape=doublecircle, fillcolor=green];
A -- B[label="4"];
A -- H[label="8", color=red, penwidth=2];
B -- C[label="8"];
B -- H[label="11"];
C -- D[label="7"];
C -- F[label="4"];
C -- I[label="2"];
D -- E[label="9"];
D -- F[label="14"];
E -- F[label="10"];
F -- G[label="2", color=red, penwidth=2];
G -- H[label="1", color=red, penwidth=2];
G -- I[label="6"];
H -- I[label="7"];
}
For a minimum spanning tree, you need to collect the second return value:
(emit-dot *my-graph*
          (multiple-value-bind (graph list)
              (mst-kruskal *my-graph*)
            (declare (ignore graph))
            list)
          t)
#+RESULTS[5d725a62003b38488a1c41fa9e4a04ac74f2a62b]:
graph G {
bgcolor="#00000000";
graph[nodesep="0.2", ranksep="0.0", splines="curved", dpi=150, fixedsize=true];
node[shape=circle, fillcolor=white, style=filled];
A -- B[label="4", color=red, penwidth=2];
A -- H[label="8", color=red, penwidth=2];
B -- C[label="8"];
B -- H[label="11"];
C -- D[label="7", color=red, penwidth=2];
C -- F[label="4", color=red, penwidth=2];
C -- I[label="2", color=red, penwidth=2];
D -- E[label="9", color=red, penwidth=2];
D -- F[label="14"];
E -- F[label="10"];
F -- G[label="2", color=red, penwidth=2];
G -- H[label="1", color=red, penwidth=2];
G -- I[label="6"];
H -- I[label="7"];
}
Showing images for graphs
There are some extra tools which take advantage of the Graphviz code emitting tool to show a certain graph on screen.
The macro
(show-graph graph &optional highlight-path)generates DOT code for the graph GRAPH just like EMIT-DOT, however
this code is temporarily saved in /tmp/graph-tmp.dot; finally, it is
also compiled to a PNG file stored in /tmp/graph-tmp.png, with the
sfdp filter.
As a last step, this function also spawns a nonblocking process
running feh, to show the created PNG image.
Therefore a line such as
(show-graph *my-graph*)shows the image
One can also use the optional parameter HIGHLIGHT-PATH to highlight a
certain path on the graph as well, just like in EMIT-DOT.
Automatically calculating shortest paths when displaying
The utility macro
(show-graph-with-shortest-path graph from to)does exactly the same as SHOW-GRAPH, however it automatically performs
a calculation on shortest path for vertices FROM and TO on graph
GRAPH, and gives that information to the DOT generator.
Therefore the code
(show-graph-with-shortest-path *my-digraph* 'a 'c)shows on screen the image
Automatically generating the minimum spanning tree when displaying
The utility macro
(show-graph-with-mst-kruskal graph)
also works just like SHOW-GRAPH, but it automatically generates the
minimum spanning tree using the Kruskal method for a specific graph,
and then shows it.
Therefore the code
(show-graph-with-mst-kruskal *my-graph*)shows on screen the image
License
This code is licensed under the BSD 2-Clause “Simplified” License. For more details, see the LICENSE file.
Copyright (c) 2019-2020, Lucas S. Vieira.


