Maria is an urban high school district data analyst. She is responsible for processing various types of data from the schools in her district into reports. These reports are used by the school district board and superintendant to decide on the district’s budget provisions for each school.
Using collected information both about the schools as well as their students’ academic performances, we must consolidate this data in order to draw conclusions regarding the schools’ educational success across the districts.
As we review the data wrangled with our Pandas script, there are some immediately obvious correlations between some of the metrics that were accounted for in this analysis. Below, each one of these is assessed for possible correlations (since the Average Math/Reading/Overall Score and % Math/Reading/Overall Passing are interdependent, we will only address the percentage):


-


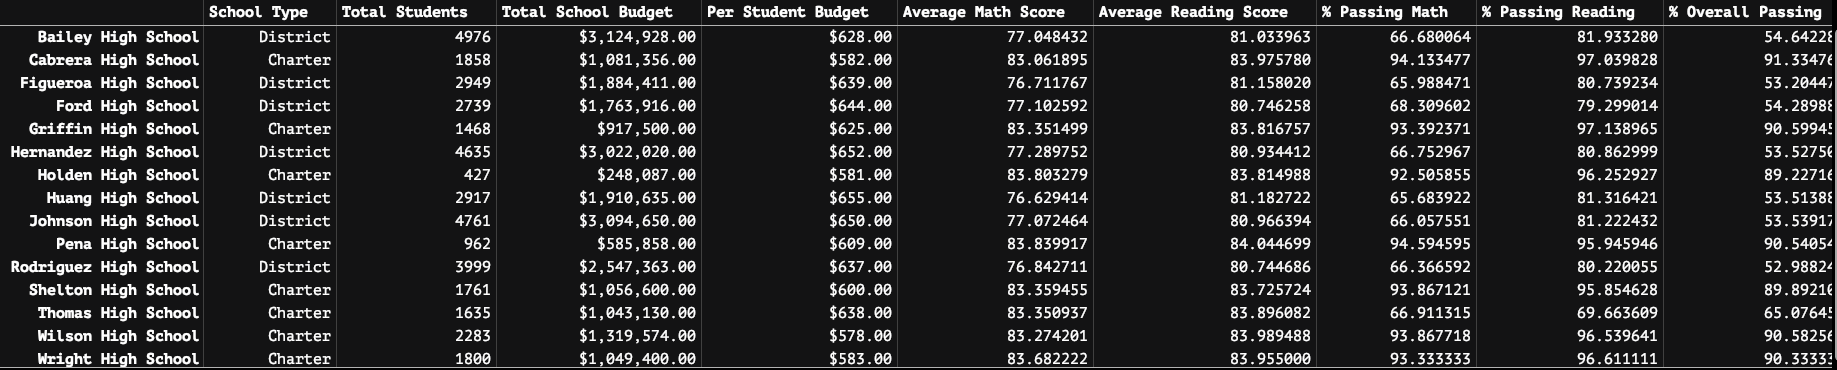
- There is strong correlation between the type of school and grade outcomes,
Charterschools performed better thanDistrictschools across the board. Charterschools tended to be smaller student bodies thanDistrictschools.- Unexpectedly, the
Per Student BudgetforCharterschools was generally lower thanDistrictschools, however, this is likely due to the fact thatCharterschools are privately paid/funded.
- There is strong correlation between the type of school and grade outcomes,
-
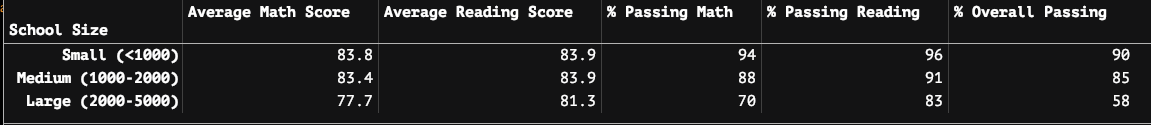
- Schools that had larger
Total Studentswere less likely to perform well through their grades. Charterschools tended to be smaller student bodies thanDistrictschools.
- Schools that had larger
-
As beforementioned, there was a negative correlation between
Total School Budgetand positive academic outcomes. This may be attributed back to the fact that larger budgets are seen with at the schools with moreTotal Students. -
-
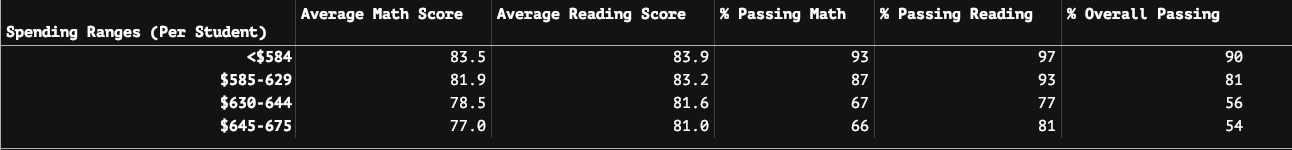
As mentioned under the first bullet, the
Per Student BudgetforCharterschools was generally lower thanDistrictschools (likely due to the fact thatCharterschools are privately paid/funded). -
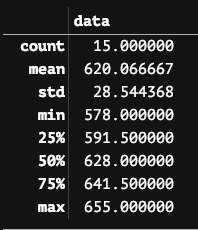
When it comes down to the actual spread of the budget per student, it doesn’t look like there’s all that much inequity….
-
-
-
% Passing Mathwas lower than% Passing Readingacross the board.Districtschools seemed to have quite exceptionally low values, especially when compared toCharterschools.Average Math Scoreswere higher than one might expect based on the percentage, meaning there are likely a few students who are heavily influencing the statistics.
-
% Passing Readingwas higher than% Passing Math.Charterschools demonstrated essentially consistentAverage Scoresbetween both Math and Reading, meaning these curriculae are likely equally strong and funded.
-
-
% Overall Passingwas lower than either% Passing Mathor% Passing Readinglikely due to the fact that students are more often failing one of the two and not both together. -
The disparity between the bottom and top five schools in their
% Overall Passingis astonishing. There is nearly a 40% difference between these two school groups. This is highly suggestive that their needs to be a redivision of the budget funds between theCharterandDistrictschools (again, likely because they are already privately-funded and receive funding from the district).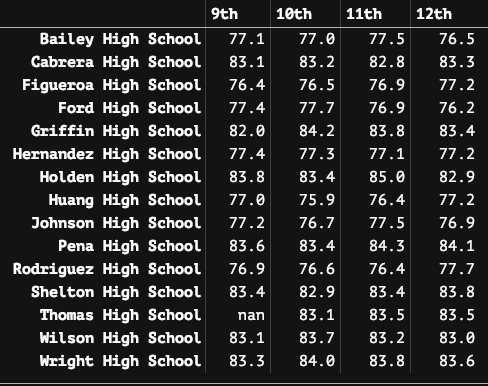
-
It is interesting to note that within each school, there was very little variance across high school classes. This is helpful as it indicates that there are less variables needing to be considered.
-


The mysterious and sudden disappearance of 461 freshman highschoolers turned out to be quite convenient for Thomas High School financially, in terms of landing budgeting from the district:
- Those 9th graders that were removed from the dataset generally exhibited poorer academic performance than the other classes that were included, thus artificially inflating both their average and percentage of Math and Reading grades.
- Unless we thought to consider this difference in the calculation, the budget per student would also be artificially increased assuming one hadn’t accounted for the total budget preset for those students.
- This, consequently, reduces the number of students that they are reporting in their
Total Students. - Lastly, and most suspiciously, the exclusion of these 9th grader datapoints bumped the school out of the bottom five, allowing them to avoid the negative spotlight of that categorization.