A solution for calculating the number of packs required to satisfy a requested quantity of items while abiding by the following rules:
- Only whole packs can be sent. Packs cannot be broken open.
- Within the constraints of rule 1, send out no more items than necessary to fulfil the order.
- Within the constraints of rule 1 & 2, send out as few packs as possible to fulfil each order.
docker build -t pack-calc .
docker run -it --rm pack-calc [options] <quantity> <pack_sizes>...
For example, to calculate pack sizes with added runtime and memory usage (-v flag):
docker run -it --rm pack-calc -v 12001 250 500 1000 2000 5000
Outputs:
1x 250
1x 2000
2x 5000
Finished in 0.007 seconds with 2.28 MB peak usage
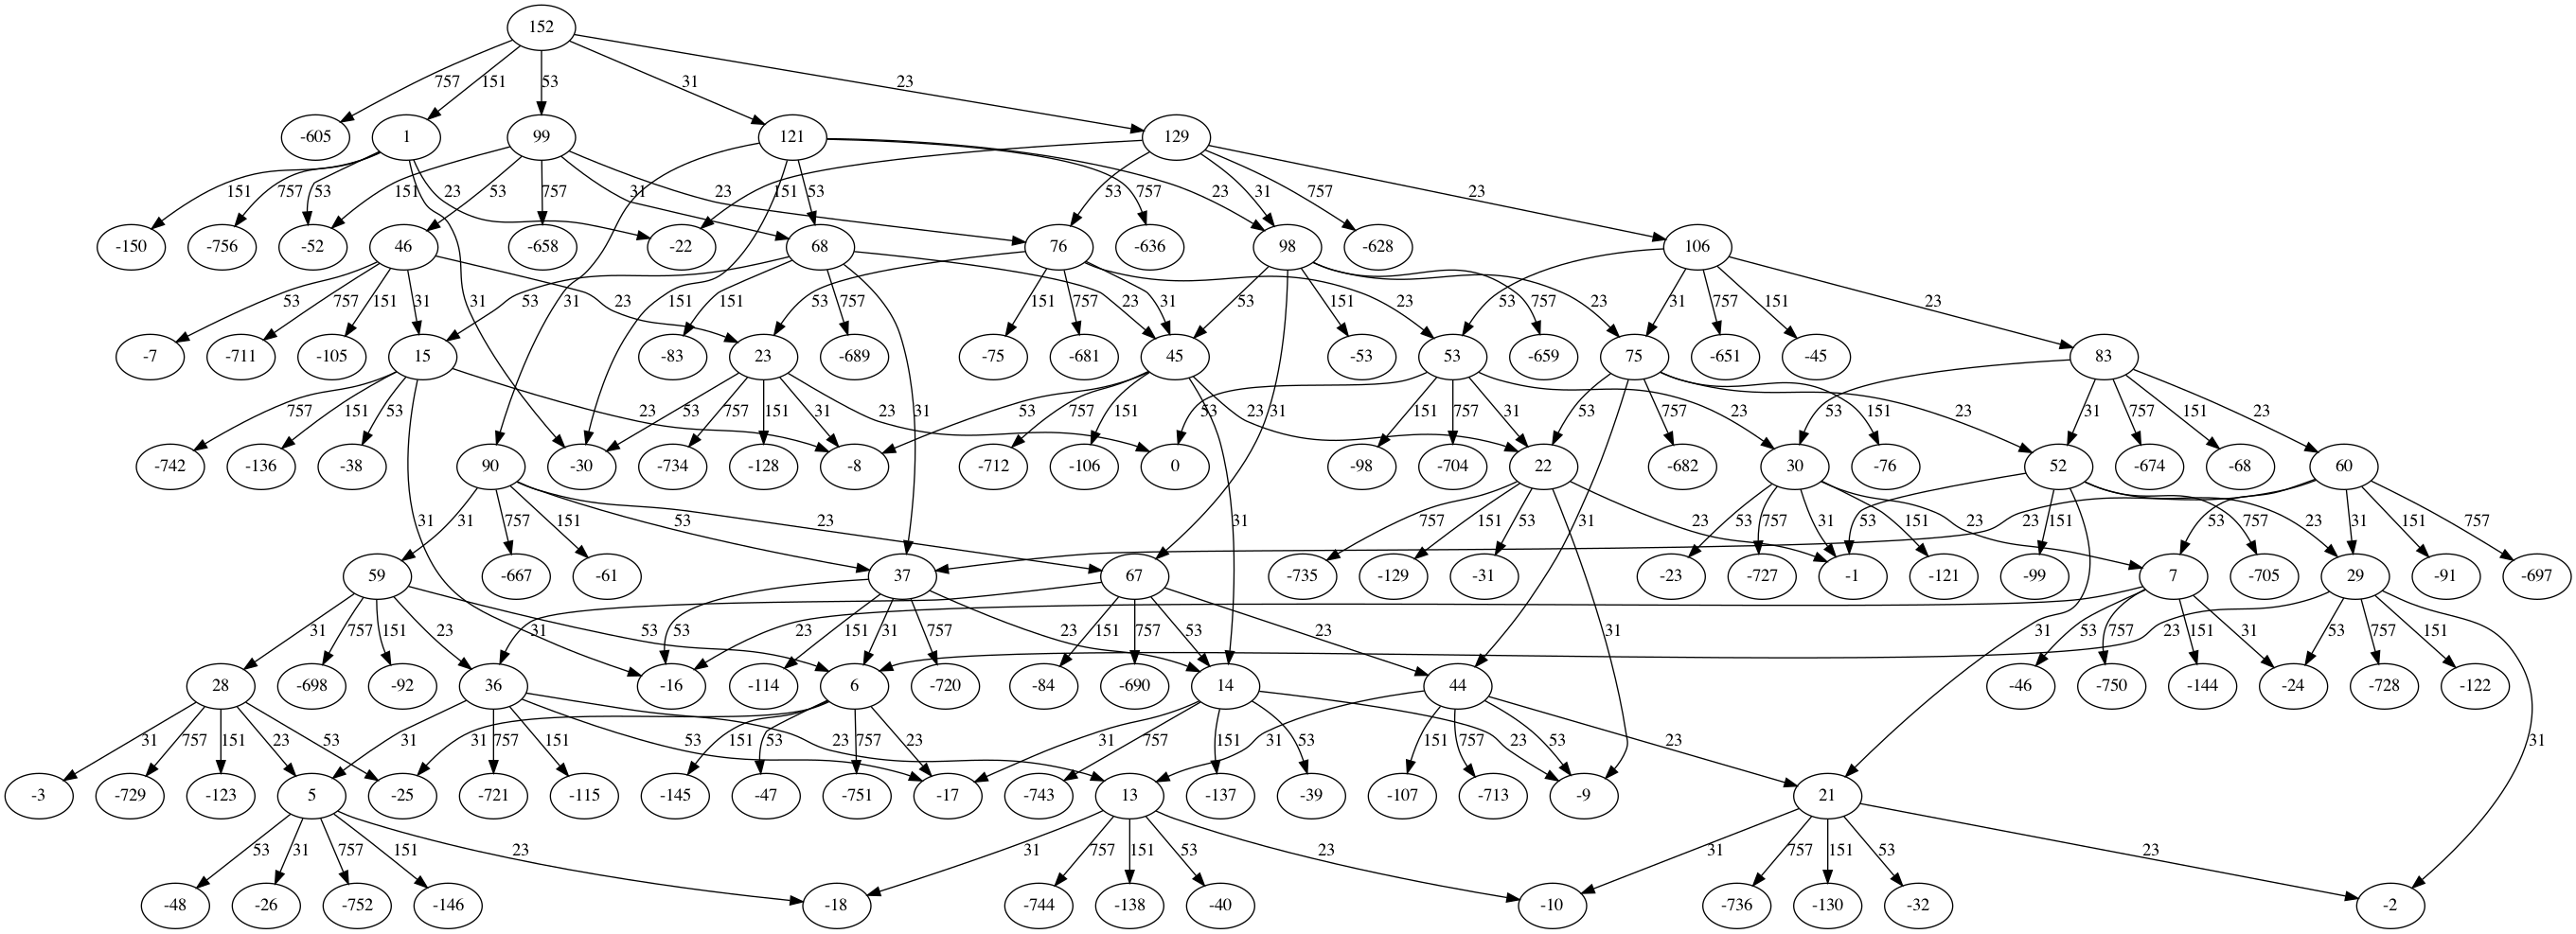
To visualise the graph used with GraphViz and write an image to this directory (see example):
docker run -it --rm -v $(pwd):/app pack-calc --viz 152 23 31 53 151 757
docker run --rm --entrypoint composer pack-calc tests
Test cases used can be found in tests/PackCalcTest.php
Bref and the Serverless framework are used for a microservice deployment. To deploy it:
npm install -g serverless
serverless config credentials --provider aws --key <key> --secret <secret>
serverless deploy
The API Gateway endpoint and API key will then be printed to console. An example request would be:
curl -X POST \
  -H "Content-Type: application/json" \
  -H "X-Api-Key: example_key" \
  -d '{"quantity": 12001, "packSizes": [250,500,1000,2000,5000]}' \
  https://example.execute-api.eu-west-1.amazonaws.com/dev/calculate
The service responds with a JSON object describing the number of required pack sizes:
{"250":1,"2000":1,"5000":2}
- Start a graph where vertices are quantities and edges are pack sizes
- In the case of a single pack size, a graph isn't necessary to calculate the required packs and so we skip to #8
- When the quantity exceeds an arbitary threshold (sum of pack sizes * 50) we first reduce the problem space by subtracting as many of the largest packs as possible while still leaving enough headroom to permutate a best fit
- Recursively build the graph by subtracting pack sizes from ancestors, starting from the root vertex (initial quantity)
- Packs are subtracted from the current vertex (quantity) in descending order
- Either a new vertex is created for the calculated quantity or an existing vertex is located in cache
- A directed edge between the current vertex and new vertex is created to track the pack size used (i.e. a new permutation)
- Vertices with a quantity <= 0 are treated as a candidate and no further subtraction occurs
- Vertices with a quantity > 0 continue to recurse
- Permutation generation is halted when a number of paths to 0 are found to prevent an exhaustive and expensive search
- The available pack sizes are reduced on each iteration over the root as this helps produce different permutations
- Candidate vertices are sorted (by quantity) descending, with the first being chosen as it's either 0 or closest to 0
- The graph is pruned to remove paths to vertices that are below the chosen candidate vertex
- The graph is pruned to remove other vertices which don't have any outgoing edges (i.e. they're a dead end)
- A breadth-first search is performed to find the shortest number of edges between the root vertex and the candidate vertex
- Each edge is iterated over, using their weight to tally the number of packs used at each size
- An array is returned where the key is the pack size and the value is the count, with 0 values being filtered out
These are my thoughts on how the implementation can be improved or a different approach could be taken.
In the "prime stress test" case of 500,000 items and pack sizes of [23, 31, 53, 151, 757], the accepted result is 4x 23, 1x 31, 2x 53, 1x 151, 660x 757, however there's another solution: 2x 31, 6x 53, 660x 757. Although both solutions fit the desired quantity and use as few packs as possible (668), the latter is arugably better since fewer pack size variations are used (which would be easier to pack in a warehouse).
The issue here is that the BFS implementation only accounts for shortest path and does not score paths of equal length by the number of variations used.
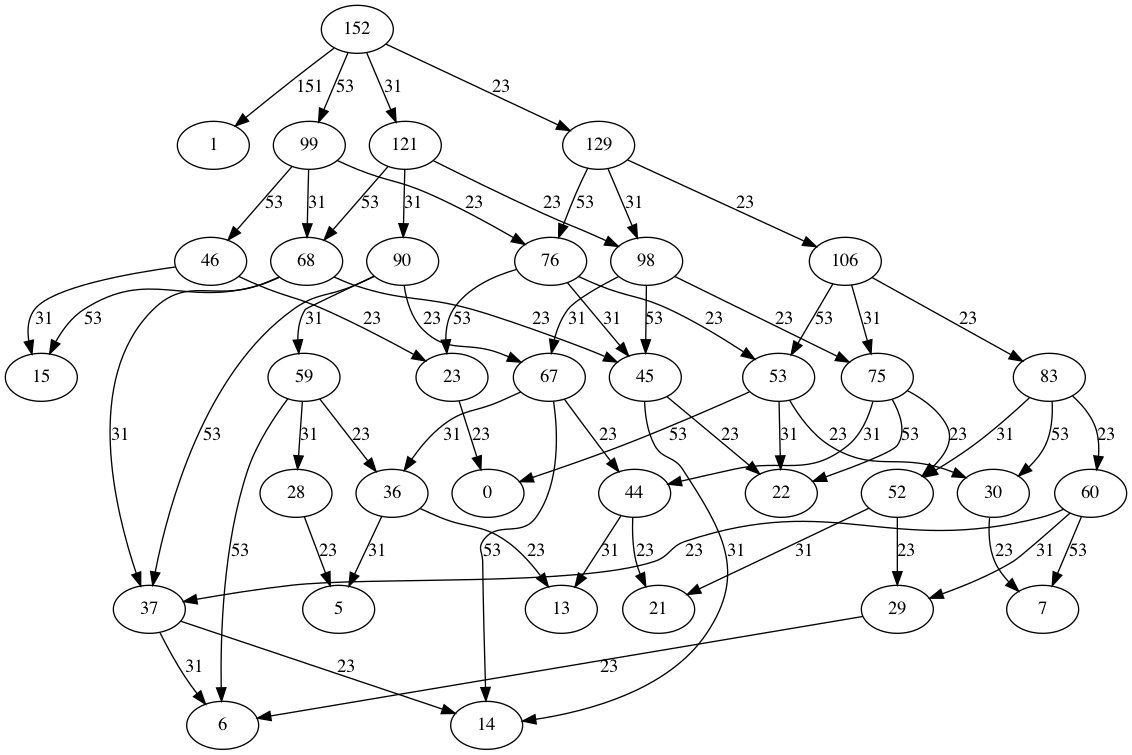
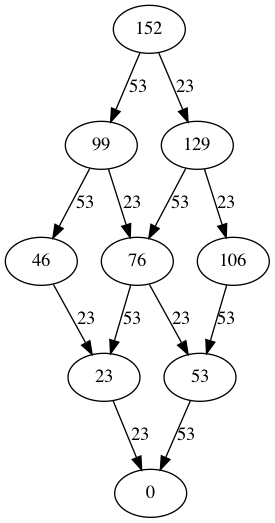
The algorithm is generating permutations whereas the end result we're interested in is the combination (with repetition) of pack sizes where order of subtraction no longer matters. Using the graph below as an example, after pruning the traversal happens over a number of paths which all result in the same combination.
Even with optimisations such as lowering the quantity where permutation starts and pruning the graph we're essentially still brute-forcing a solution, so perhaps a different approach could be to instead calculate the best combination of pack sizes for each integer between "1" and "quantity", using dynamic programming to store previous solutions.
Consider the following:
php cli.php 5000001 250 500 1000 2000 5000finishes in 0.11 seconds with 14.22 MB peak usagephp cli.php 5000001 250 500 1000 2000 5000 10000 20000 50000finishes in 2.85 seconds with 166.21 MB peak usage
Increasing the number of pack size variations will only further increase the required resources to generate and traverse the graph at large quantities. Within a microservice deployment this is a legitimate concern in terms of runtime and memory constraints.
Some potential solutions:
- Limit the quantity the service can handle to a reasonable value and farm out larger quantities across multiple processes/requests
- Stop permutation once a certain memory budget is exceeded and begin traversal to the current best candidate (because larger packs go first it's more likely we will overshoot rather than undershoot the quantity)
- Reduce the range of available pack sizes so only a lower and upper bound are used for permutation (although this narrows the possibility of finding an exact fit)


