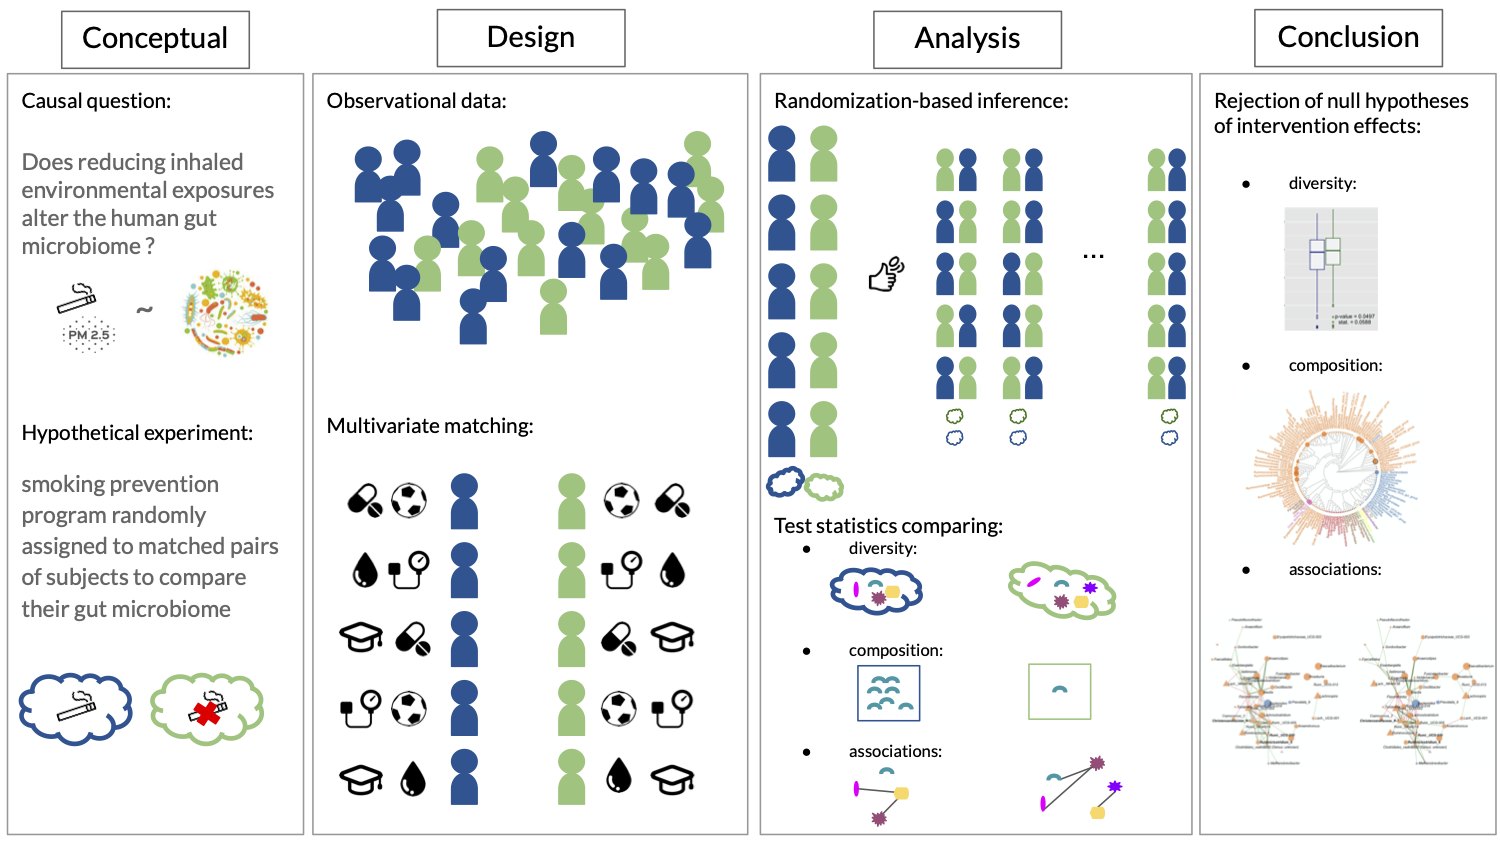
Causal inference framework for environment-microbiome data applied to American Gut Project (AGP) data.
American Gut Data subset [paper in preparation, Mishra and Müller 2021].
The R code for our pair matching implementation and diagnostic plots
generation can be found in the design_AG file. The matrix
of 10,000 possible randomization of the intervention assignment is also
generated directly after matching.
Note 1: the matching functions Stephane_matching.R were written in Rcpp by Stéphane Shao.
Note 2: other matching strategies are valid. The researcher should take the conceptual hypothetical experiment into account when choosing its strategy.
The ASV (or OTU) data table and matched dataset are combined in a phyloseq object before making statistical analyses. Thus, the following code can be used for any other data combined in a phyloseq object.
R code in 1_alpha_diversity_AG folder.
We used Amy Willis’ R packages
breakaway for richness
estimation [Willis and Bunge,
2015] and
DivNet for Shannon index estimation
[Willis,
2020].
estimate: 108.3931; p-value: 0.133
Shannon index result:estimate: -0.008072164; p-value: 0.659
R code in 2_beta_diversity_AG folder.
The distance calculations where done with the phyloseq package and we
used Anna Plantinga’s R package
MiRKAT
for the test statistic calculations [Zhao et al.,
2015].
- Aitchison: estimate: 822866.9; p-value(adj.): 0.002
- Jaccard: estimate: 132.9856; p-value(adj.): 0.002
- Gower: estimate: 0.3761873; p-value(adj.): 0.501
R code in 3_mean_diff_test_AG folder.
Cao, Lin, and Li’s github repository:
composition-two-sampe-test
[Cao, Lin, and Li,
2018].
estimate: 50.0806; p-value: 0.001
R code in 4_differential_abundance_AG
folder.
We use the function dacomp.test() of Barak Brill’ R package:
dacomp to calculate the test
statistic for all taxa at once [Brill, Amir, and Heller,
2020].
k_Bacteria;p_Firmicutes;c_Clostridia;o_Clostridiales;f_Lachnospiraceae;g_Dorea
k_Bacteria;p_Firmicutes;c_Clostridia;o_Clostridiales;f_Lachnospiraceae;g_NA
Genera with p-value <= 0.02.
k_Bacteria;p_Proteobacteria;c_Gammaproteobacteria;o_Enterobacteriales;f_Enterobacteriaceae;g_Raoultella
k_Bacteria;p_Firmicutes;c_Clostridia;o_Clostridiales;f_Lachnospiraceae;g_Anaerostipes
k_Bacteria;p_Proteobacteria;c_Alphaproteobacteria;o_Rickettsiales;f_mitochondria;g_Sarcandra
R code in 5_networks_AG folder.
Peschel et al.’s
(2020)
R package NetCoMi enables
the estimation and comparision of networks for compositional data.
[Holle et al., 2005] Holle R, Happich M, Löwel H, Wichmann HE (2005); MONICA/KORA Study Group. KORA–a research platform for population based health research. Gesundheitswesen, 67.
[Willis and Bunge, 2015] Willis A and Bunge J (2015); Estimating diversity via frequency ratios. Biometric Methodology, 71:1042-1049.
[Willis and Bryan, 2020] Willis A and Bryan DM (2020); Estimating diversity in networked ecological communities Biostatistics, kxaa015.
[Zhao et al., 2015] Zhao N, Chen J, Carroll IM et al. (2015); Testing in Microbiome-Profiling Studies with MiRKAT, the Microbiome Regression-Based Kernel Association Test. Am J Hum Genet., 96(5):797-807.
[Cao, Lin, Li, 2018] Cao Y, Lin W, and Li H (2018); Two-sample tests of high-dimensional means for compositional data. Biometrika, 105:115-132.
[Brill, Amir, and Heller, 2020] Brill B, Amir A, and Heller R (2020) Testing for differential abundance in compositional counts data, with application to microbiome studies.] arXiv
[Peschel et al., 2020] Peschel et al. (2020) NetCoMi: network construction and comparison for microbiome data in R. Briefings in Bioinformatics, bbaa290.
