Line Segmentation Evaluator for the ICDAR2017 competition on Layout Analysis for Challenging Medieval Manuscripts
Minimal usage: java -jar LineSegmentationEvaluator.jar -igt image_gt.png -xgt page_gt.xml -xp page_to_evaluate.xml
Parameters list: utility-name
 -igt,--imageGroundTruth <arg>   Ground Truth image at pixel-level (not the original image)
 -xgt,--xmlGroundTruth <arg>     Ground Truth XML
 -xp,--xmlPrediction <arg>       Prediction XML
 -overlap <arg>                  (Optional) Original image, to be overlapped with the results visualization
 -mt,--matchingThreshold <arg>   (Optional) Matching threshold for detected lines
 -out,--outputPath <arg>         (Optional) Output path (relative to prediction input path)
 -csv                            (Optional) (Flag) Save the results to a CSV file
Note: this also outputs a human-friendly visualization of the results next to the
page_to_evaluate.xml which can be overlapped to the original image if provided
with the parameter -overlap to enable deeper analysis.
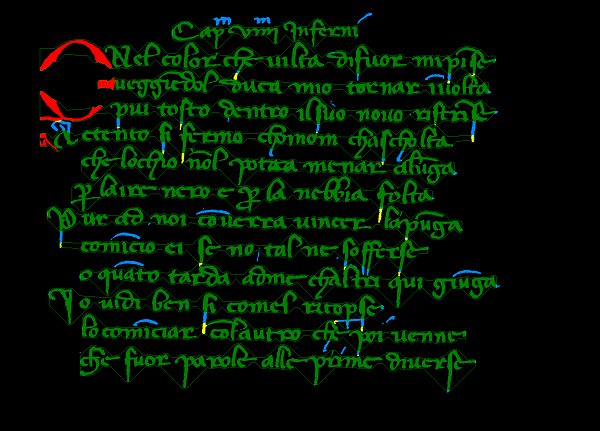
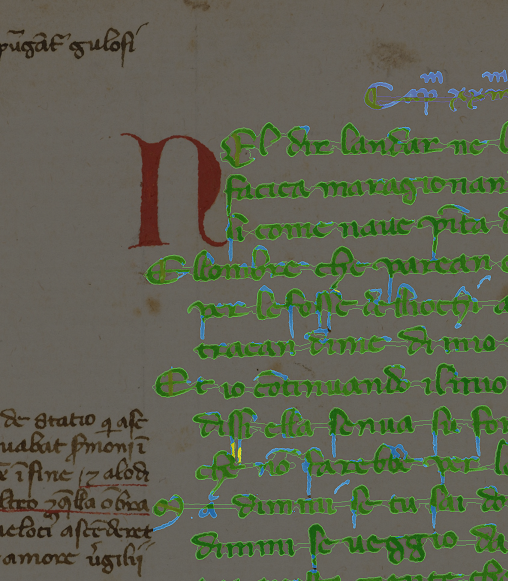
Along with the numerical results (such as the Lines/Pixels Intersection over Union (IU), precision, recall,F1) the tool provides a human friendly visualization of the results. The three images below are exampels of such visualization:
Pixel colors are assigned depending on the type of the pixel (TP,FP,FN or shared among different polygons)
- GREEN: Foreground pixel predicted correctly
- RED: Foreground pixel does not belong to this line (False positive)
- BLUE: Foreground pixel that should have been in this (False negative)
- YELLOW: Foreground pixel which belong to another line
Polygon colors are assigned depending on the total pixel precision and recall for the corresponding line:
- GREEN: Precision & Recall both above the threshold (default 75%)
- RED: Precision below threshold
- BLUE: Recall below threshold
- PINK: Precision & Recall both below the threshold
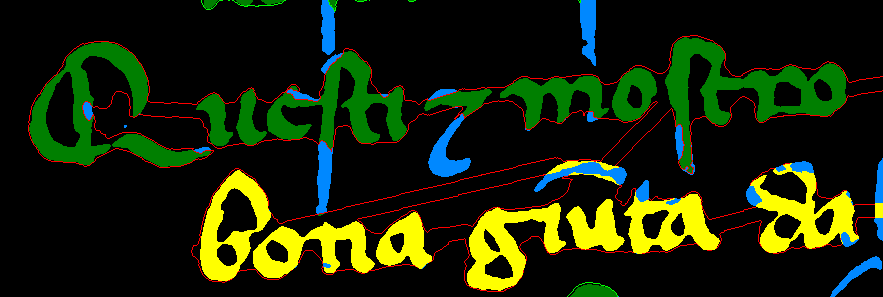
In the zoomed image below one can extract the some information:
-
Since the polygon is RED, it means that there are too many foreground pixels which don't belong to its matched line. This is easily explainable as one see how the polygon of the top line (red line) is extended to the line below.
-
The yellow line, is in fact yellow because considered foreground by the red polygon (see above point) and the GT polygon corresponding to that line.
-
The blue pixels are missed in the predicted lines, but are in the GT, therefore they're considered as false negatives.
Additionally, when desired one can provide the original image and it will be overlapped with the visualization of the results. This is particularly helpful to understand why certain artifacts are created.
If you use our software, please cite our paper as:
@inproceedings{alberti2017evaluation,
    address = {Kyoto, Japan},
    archivePrefix = {arXiv},
    arxivId = {1712.01656},
    author = {Alberti, Michele and Bouillon, Manuel and Ingold, Rolf and Liwicki, Marcus},
    booktitle = {2017 14th IAPR International Conference on Document Analysis and Recognition (ICDAR)},
    doi = {10.1109/ICDAR.2017.311},
    eprint = {1712.01656},
    isbn = {978-1-5386-3586-5},
    month = {nov},
    pages = {43--47},
    title = {{Open Evaluation Tool for Layout Analysis of Document Images}},
    year = {2017}
}

