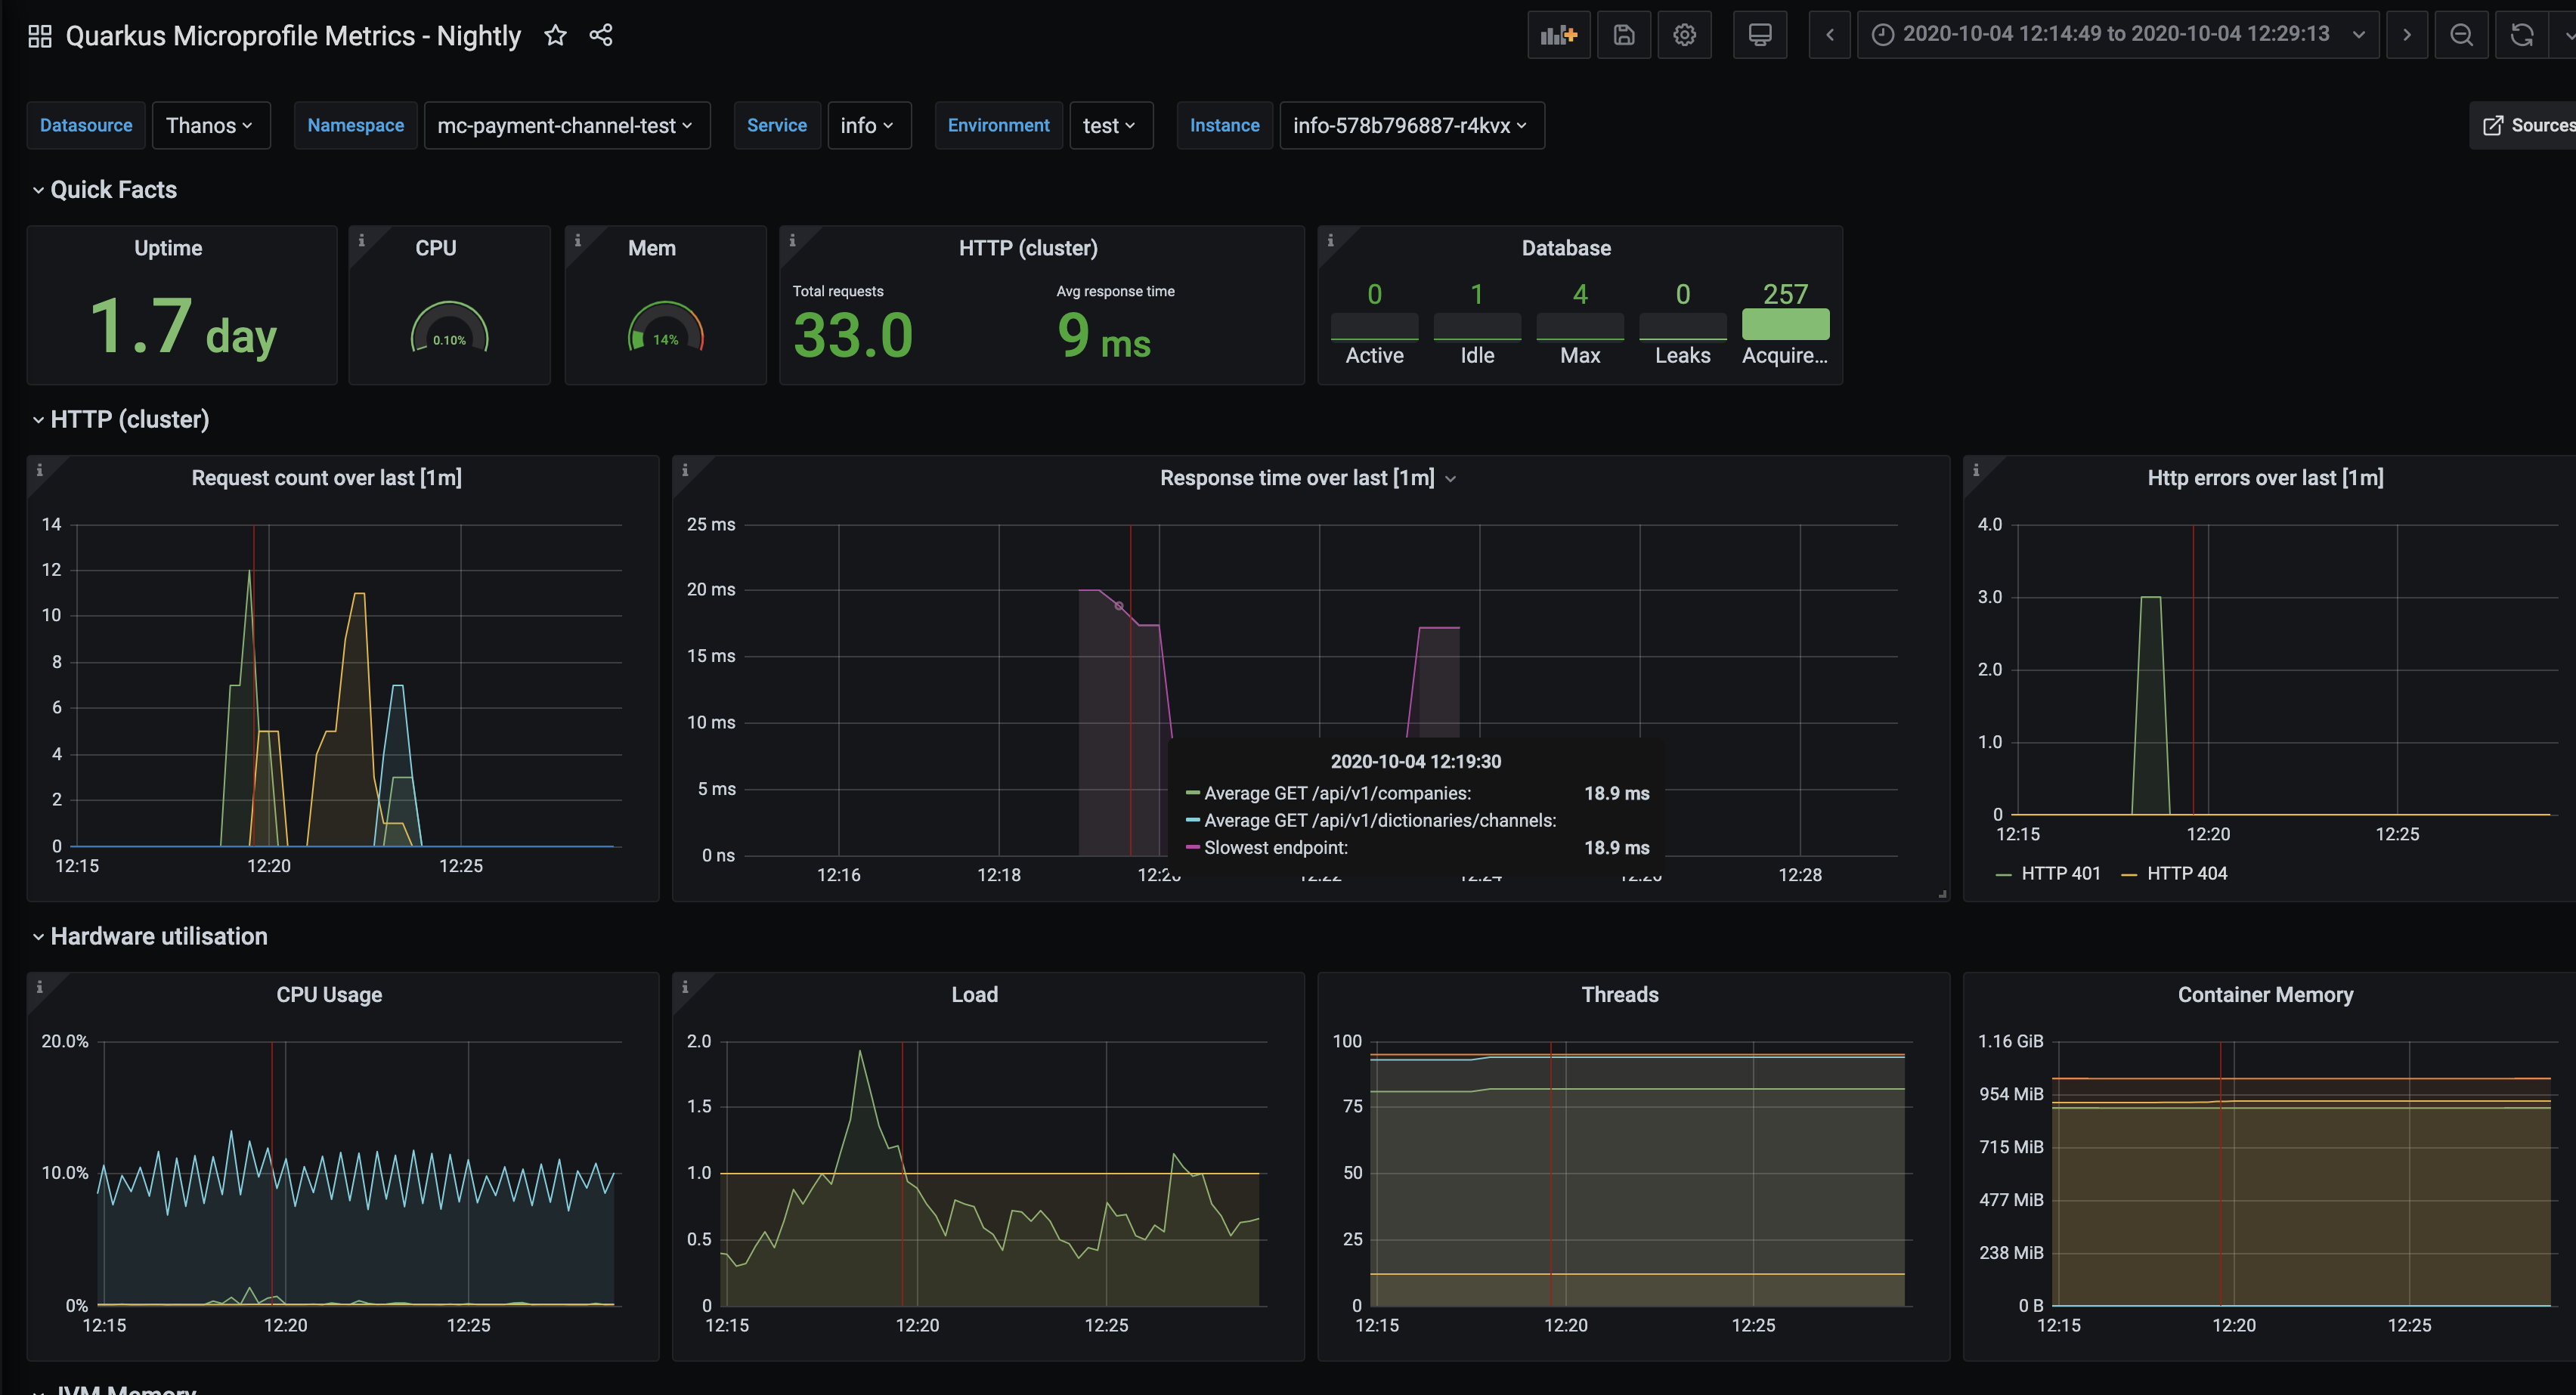
Available panels:
- Uptime
- Hardware utilization: CPU, mem, threads
- HTTP counters and timers
- Database (Agroal): connection pool counters and timers
- JVM memory and Garbage Collectors
- Import
src/quarkus-microprofile-metrics.jsoninto your Grafana. - Adjust variable definitions (namespace, service etc) for your platform.
- Enjoy!
- Edit
prometheus/prometheus.ymland add scrape targets (url to your running quarkus apps) - Run
docker-compose up -d - Open
http://localhost:3000/and useadmin:admincredentials - Open
Quarkus Microprofile Metricsdashboard
