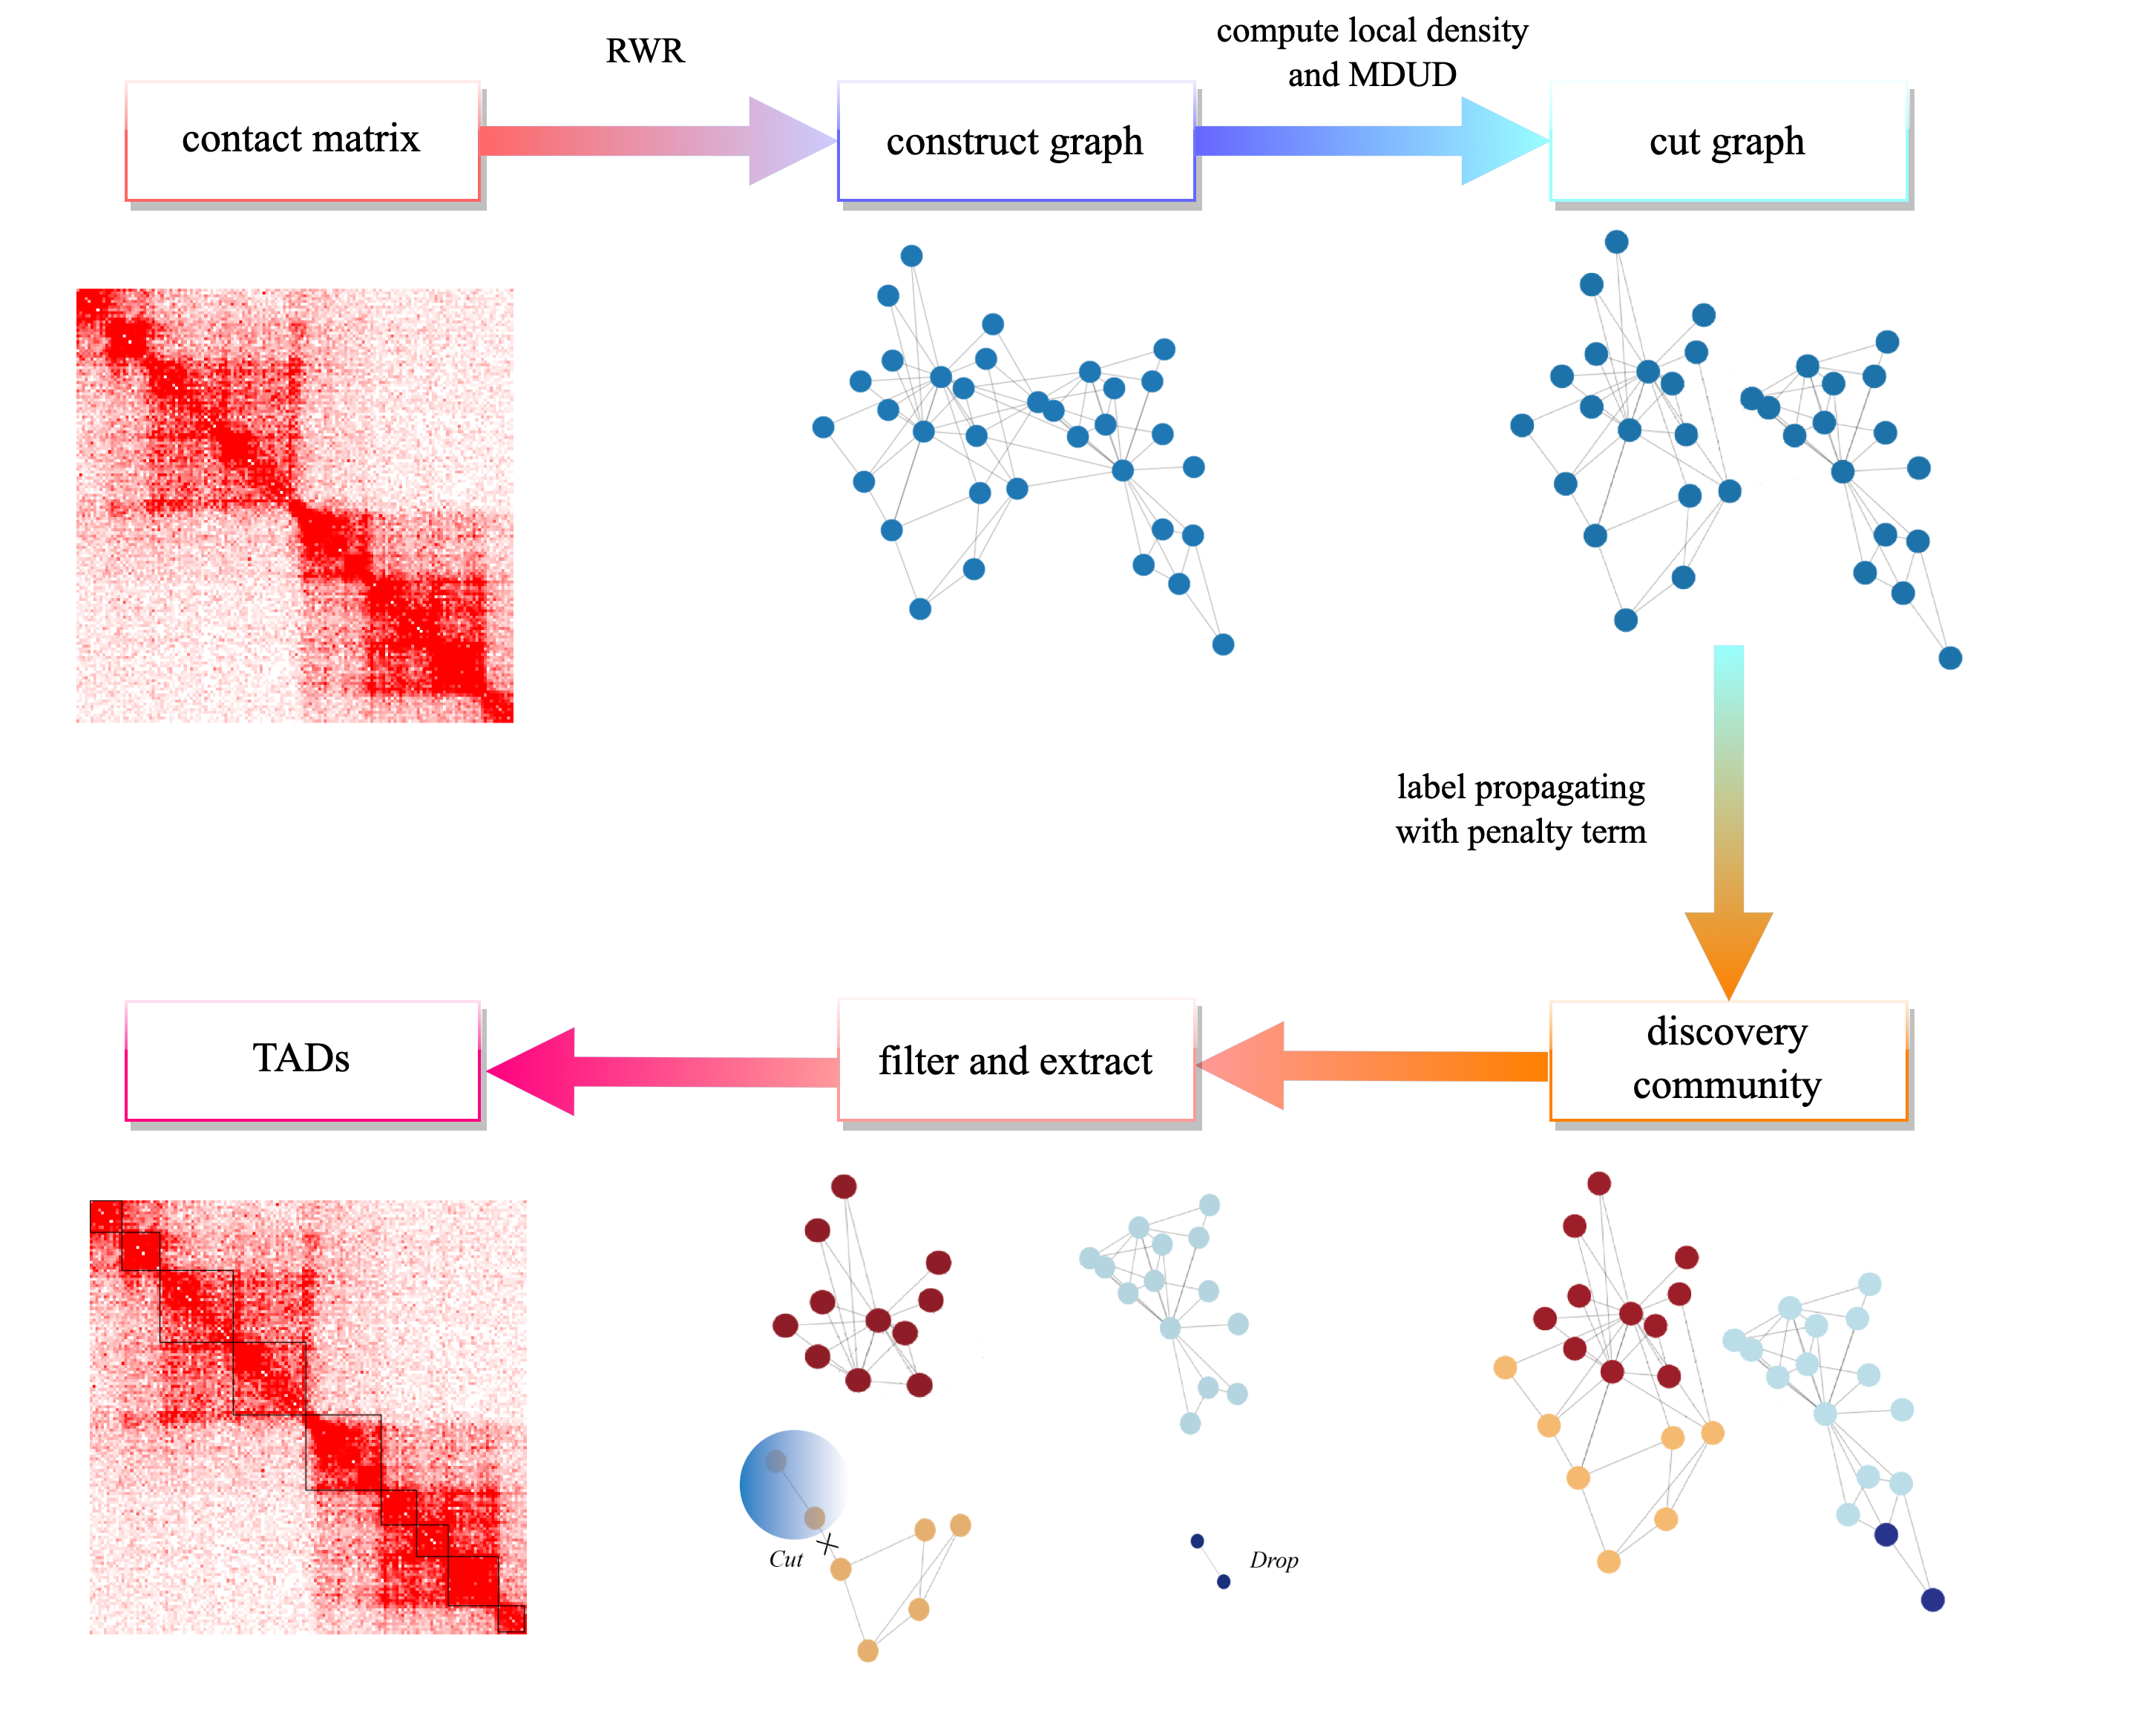
Detection of Topological Associated Domains from Hi-C Data using Network Construction and Label propagation
In our experiment, we used 3 three normalized Hi-C matrix pre-processed by Bing Ren's Lab. Data is available at : http://chromosome.sdsc.edu/mouse/hi-c/download.html.
As of January 1, 2023, this website is dead temporarily, you can use our backup at: https://mailnankaieducn-my.sharepoint.com/:f:/g/personal/2120210438_mail_nankai_edu_cn/ElUG7nVOdzpKlakCfYZPPSQB355VjGguq_t93bVLvlY-wg?e=acg2YC
Besides,we also used a simulated data extract from chr6 on mouse cortex cell line, normalized Matrix is in the folder data.
run the PLA_2.py
python PLA_2.py -husage: PLA_2.py [-h] -f F [-w W] [-c C] [-o O] [-p P] [-k K]
Detection of Topological Associated Domains from Hi-C Data using Network Construction and Label propagation
optional arguments:
-h, --help show this help message and exit
-f F the path of a intra-chromosomal Hi-C matrix seperated by Tab with N by N shaped
-w W window size,the default is 5.
-c C the restart probability, the default is 0.85
-o O the storage path and filename of result, the default is ./out
-p P optional, the Penalty coefficient, the default is 1
-k K optional, the top k, 0.1 ~ 0.9, the default value is inferred based on w automatically. Not recommended to use
- numpy
- matplotlib
- seaborn
- colormap
- pyrwr: we use this package download from https://github.com/jinhongjung/pyrwr and modify the source code. you do not need to install it.
- scipy
- tdqm
- pandas
LPAD produces a files. Note that,The output file will be named by the user in which list the TADs extracted from the input data. The first column is the start bin, and the second column is the stop bin.
cd ./annotation
python annotate.py -h
A simple tools to annotate Human TAD!
-------------------------------------
    Use example: python annotate.py -c 16 -r 40000 -b 1170,1181,677,684
    Use example: python annotate.py -c 16 -r 40000 -s 1170 -e 181
    Use example: python annotate.py -c 16 -r 40000 -f './test_TAD'

optional arguments:
  -h, --help  show this help message and exit
  -c C        index of Chromosome
  -s S        index of starting bin of TAD
  -e E        index of ending bin of TAD
  -r R        resolution(unit b) of Hi-C contact matrix
  -o O        output file to store result,the default is ./annotation.out
  -b B        a list of TAD. For example, 1,5,9,13 contains TAD (1,5) and TAD (9, 13)
  -f F        a file record TAD. One TAD per line tab separation
an example of OUTPUT:
# Annotation the TAD of 16:1170-1181, resolution:40000
[
    ...
    {
        "id": "NM_153029",
        "locus": "chr16:47,130,137-47,201,592",
        "strand": "-",
        "name": "N4BP1",
        "enhancer": "chr16:48912816-48914144,chr16:49094466-49095242,chr16:48753822-48755022,chr16:48939235-48941566",
        "promoter": "chr16:48610160-48610161",
        "super_enhancer": "",
        "diseases": "Rheumatoid Arthritis,Glycosuria,Eosinophil count procedure,Blood basophil count (lab test)",
        "TF": "",
        "target": ""
    },
    {
        "id": "NM_001006610",
        "locus": "chr16:46,951,947-46,957,299",
        "strand": "-",
        "name": "SIAH1",
        "enhancer": "",
        "promoter": "chr16:48365886-48365887,chr16:48385409-48385410,chr16:48448397-48448398",
        "super_enhancer": "",
        "diseases": "Body Height,Neoplasms,Finding of Mean Corpuscular Hemoglobin,Carcinogenesis,Liver carcinoma,Tumor Cell Invasion,Malignant neoplasm of breast,Parkinson Disease,Breast Carcinoma",
        "TF": "EHMT2(-),TP53(?)",
        "target": ""
    }
    ...
]
