This is a companion repository to the paper "Combining First-Principles and Deep Learning for Model Predictive Control."
The goals for this repository are the following:
- Provide all data used for the experiments (contained in
./data/) - Provide all training code
- Show an example of how you would use the models for inference/control
- Make our methodology more transparent to allow for easier replication
To clone repo, run:
git clone https://github.com/tsor13/DL-MPCThis repo contains all data used and all training code used for the paper. There is also a script for inference that you can use to simulate your own plots to see how the models fit the data.
This code is provided by Taylor Sorensen, Curtis Johnson, Tyler Quackenbush, David Wingate, and Marc Killpack. For any questions, please reach out to Taylor at tsor1313@gmail.com.
To generate your own plots for how well the models fit the data, run
python3 inference.py
This will generate 10 random plots for both simulated first-principles data and hardware data. It outputs these plots under ./plots/.
If you wish to retrain the models on the data, run
python3 train_simulated.py
python3 train_error.py
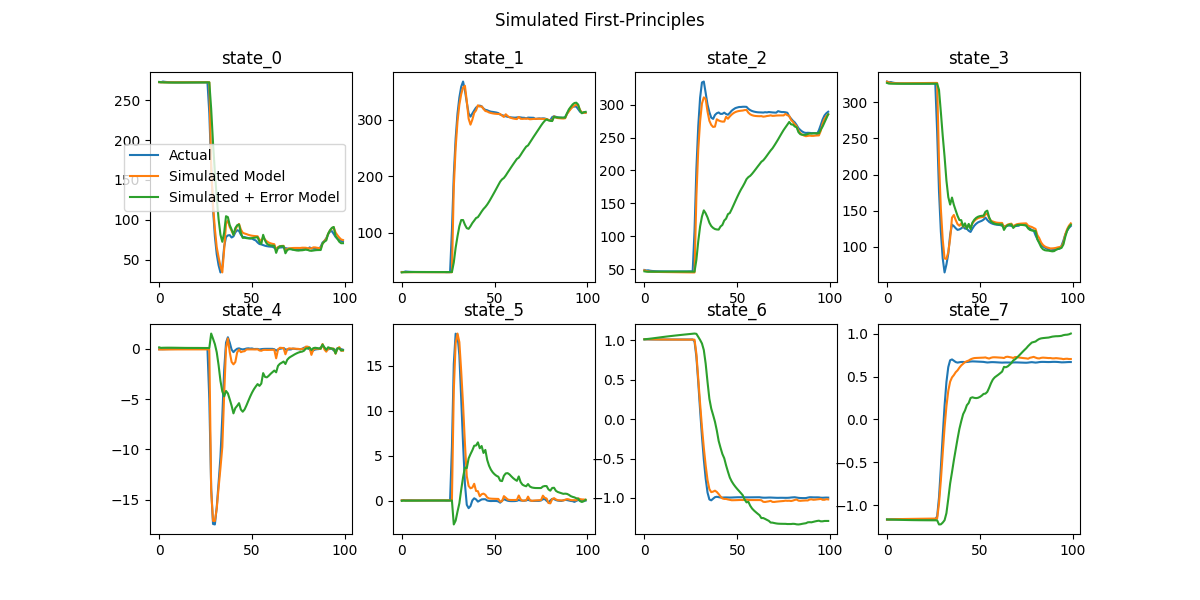
Let us look at some example plots we used to validate our models. The following are not cherry picked.
 To explain the plot: the models are all shown the initial state, and try to predict the next 100 states, given the inputs to the robot.
Each state is 8-dimensional, so we show how well it estimates all states.
The blue line represents actual data, the orange line represents the DNN trained on the simulated model, and the green line represents the simulated plus error model (estimates for hardware).
As expected, the orange line matches the blue line very tightly here.
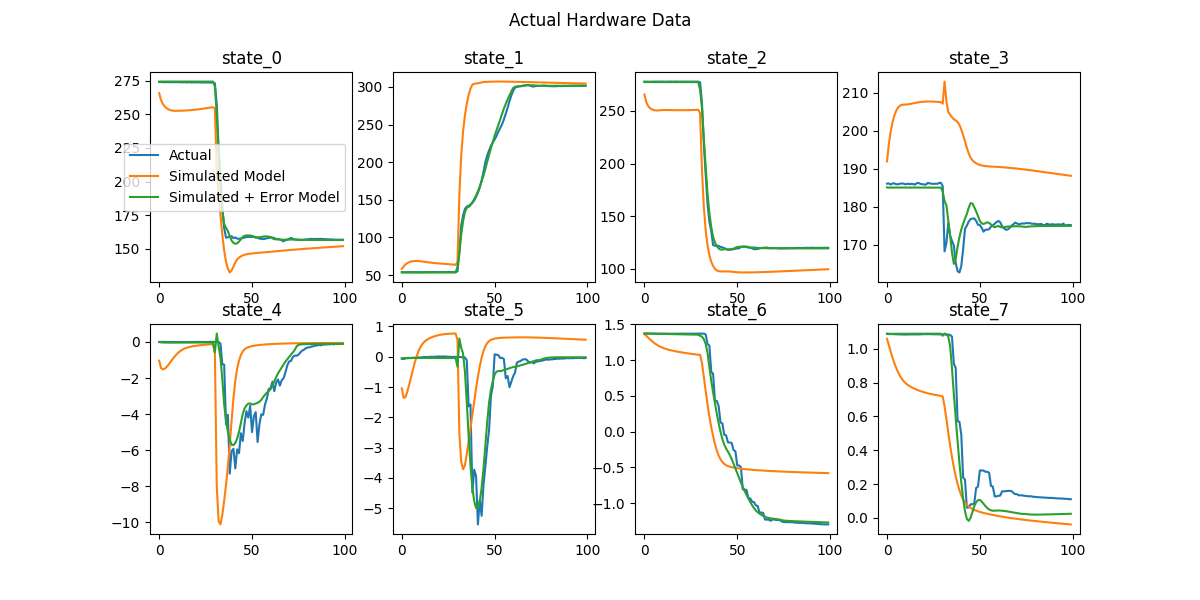
Meanwhile, let's look at some hardware data:

In this case, the green line matches much better, as the error model has learned the unexplained dynamics well. The gap between the orange and blue lines represent both the difference between the first-principles model and the simulated DNN plus the gap between the first-principles model and unexplained dynamics.
We encourage interested readers to generate their own plots to validate the performance of the models.